This is the results breakdown of the local elections held in Catalonia on 27 May 2007. The following tables show detailed results in the autonomous community's most populous municipalities, sorted alphabetically.[1]
Municipalities
Badalona
- Population: 221,520
← Summary of the 27 May 2007 City Council of Badalona election results →
|
| Parties and coalitions |
Popular vote |
Seats |
| Votes |
% |
±pp |
Total |
+/− |
|
Socialists' Party of Catalonia–Municipal Progress (PSC–PM) |
21,352 | 28.81 | –11.26 |
9 | –3 |
|
People's Party (PP) |
16,203 | 21.86 | +4.34 |
7 | +2 |
|
Convergence and Union (CiU) |
12,199 | 16.46 | +3.33 |
5 | +2 |
|
Initiative–EUiA–Agreement for Municipal Progress (ICV–EUiA–EPM) |
10,954 | 14.78 | –1.66 |
5 | ±0 |
|
Republican Left of Catalonia–Municipal Agreement (ERC–AM) |
4,276 | 5.77 | –1.94 |
1 | –1 |
|
|
Citizens–Party of the Citizenry (C's) |
3,086 | 4.16 | New |
0 | ±0 |
|
The Greens–Popular Unity Candidacy (EV–CUP) |
1,562 | 2.11 | New |
0 | ±0 |
|
Citizens of Badalona (CdB) |
1,113 | 1.50 | New |
0 | ±0 |
|
Independent Space Place (LLEI) |
560 | 0.76 | –0.02 |
0 | ±0 |
|
Unsubmissive Seats–Alternative of Discontented Democrats (Ei–ADD) |
328 | 0.44 | New |
0 | ±0 |
|
Humanist Party (PH) |
178 | 0.24 | +0.09 |
0 | ±0 |
| Blank ballots |
2,307 | 3.11 | +1.60 |
|
|
| Total |
74,118 | |
27 | ±0 |
|
| Valid votes |
74,118 | 99.60 | –0.07 |
|
| Invalid votes |
301 | 0.40 | +0.07 |
| Votes cast / turnout |
74,419 | 46.02 | –6.33 |
| Abstentions |
87,305 | 53.98 | +6.33 |
| Registered voters |
161,724 | |
|
| Sources[1][2][3][4] |
Barcelona
- Population: 1,605,602
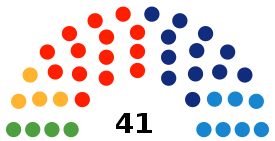
← Summary of the 27 May 2007 City Council of Barcelona election results →
|
| Parties and coalitions |
Popular vote |
Seats |
| Votes |
% |
±pp |
Total |
+/− |
|
Socialists' Party of Catalonia–Municipal Progress (PSC–PM) |
182,216 | 29.91 | –3.69 |
14 | –1 |
|
Convergence and Union (CiU) |
155,101 | 25.46 | +4.05 |
12 | +3 |
|
People's Party (PP) |
95,083 | 15.61 | –0.51 |
7 | ±0 |
|
Initiative–EUiA–Agreement for Municipal Progress (ICV–EUiA–EPM) |
56,953 | 9.35 | –2.72 |
4 | –1 |
|
Republican Left of Catalonia–Municipal Agreement (ERC–AM) |
53,707 | 8.81 | –3.99 |
4 | –1 |
|
|
Citizens–Party of the Citizenry (C's) |
23,625 | 3.88 | New |
0 | ±0 |
|
The Greens–The Ecologist Alternative (EV–AE) |
4,754 | 0.78 | New |
0 | ±0 |
|
Anti-Bullfighting Party Against Mistreatment of Animals (PACMA) |
3,073 | 0.50 | New |
0 | ±0 |
|
Unsubmissive Seats–Alternative of Discontented Democrats (Ei–ADD) |
2,290 | 0.38 | +0.28 |
0 | ±0 |
|
Catalan Republican Party (RC) |
1,214 | 0.20 | New |
0 | ±0 |
|
Communist Party of the Catalan People (PCPC) |
972 | 0.16 | New |
0 | ±0 |
|
Republican Left–Left Republican Party (IR–PRE) |
822 | 0.13 | New |
0 | ±0 |
|
For a Fairer World (PUM+J) |
717 | 0.12 | New |
0 | ±0 |
|
Barcelona for Self-determination (BxA–FIC) |
692 | 0.11 | New |
0 | ±0 |
|
Carmel/Blue Party (PAzul) |
618 | 0.10 | New |
0 | ±0 |
|
Citizen Force (FC's) |
591 | 0.10 | New |
0 | ±0 |
|
Family and Life Party (PFiV) |
463 | 0.08 | New |
0 | ±0 |
|
Humanist Party (PH) |
402 | 0.07 | ±0.00 |
0 | ±0 |
|
Platform for Catalonia (PxC) |
351 | 0.06 | +0.02 |
0 | ±0 |
|
Democratic and Social Centre (CDS) |
270 | 0.04 | –0.03 |
0 | ±0 |
|
Internationalist Struggle (LI (LIT–CI)) |
209 | 0.03 | ±0.00 |
0 | ±0 |
|
Internationalist Solidarity and Self-Management (SAIn) |
183 | 0.03 | New |
0 | ±0 |
| Blank ballots |
25,002 | 4.10 | +2.42 |
|
|
| Total |
609,308 | |
41 | ±0 |
|
| Valid votes |
609,308 | 99.48 | –0.17 |
|
| Invalid votes |
3,201 | 0.52 | +0.17 |
| Votes cast / turnout |
612,509 | 49.62 | –9.62 |
| Abstentions |
621,859 | 50.38 | +9.62 |
| Registered voters |
1,234,368 | |
|
| Sources[1][2][5][6][7] |
Girona
- Population: 89,890
← Summary of the 27 May 2007 City Council of Girona election results →
|
| Parties and coalitions |
Popular vote |
Seats |
| Votes |
% |
±pp |
Total |
+/− |
|
Socialists' Party of Catalonia–Municipal Progress (PSC–PM) |
11,279 | 34.80 | –3.75 |
10 | –1 |
|
Convergence and Union (CiU) |
7,111 | 21.94 | +1.91 |
6 | +1 |
|
Republican Left of Catalonia–Municipal Agreement (ERC–AM) |
4,167 | 12.86 | –4.56 |
4 | ±0 |
|
Initiative–EUiA–Agreement for Municipal Progress (ICV–EUiA–EPM) |
3,511 | 10.83 | +0.55 |
3 | +1 |
|
People's Party (PP) |
2,892 | 8.92 | –1.64 |
2 | –1 |
|
|
Popular Unity Candidacy (CUP) |
916 | 2.83 | +1.82 |
0 | ±0 |
|
Citizens–Party of the Citizenry (C's) |
737 | 2.27 | New |
0 | ±0 |
|
Catalan Republican Party (RC) |
211 | 0.65 | New |
0 | ±0 |
|
Family and Life Party (PFiV) |
105 | 0.32 | New |
0 | ±0 |
|
Internationalist Struggle (LI (LIT–CI)) |
73 | 0.23 | –0.07 |
0 | ±0 |
|
Humanist Party (PH) |
53 | 0.16 | ±0.00 |
0 | ±0 |
| Blank ballots |
1,352 | 4.17 | +2.67 |
|
|
| Total |
32,407 | |
25 | ±0 |
|
| Valid votes |
32,407 | 99.26 | –0.21 |
|
| Invalid votes |
240 | 0.74 | +0.21 |
| Votes cast / turnout |
32,647 | 51.29 | –10.04 |
| Abstentions |
31,001 | 48.71 | +10.04 |
| Registered voters |
63,648 | |
|
| Sources[1][2][8][9] |
L'Hospitalet de Llobregat
- Population: 248,150
← Summary of the 27 May 2007 City Council of L'Hospitalet de Llobregat election results →
|
| Parties and coalitions |
Popular vote |
Seats |
| Votes |
% |
±pp |
Total |
+/− |
|
Socialists' Party of Catalonia–Municipal Progress (PSC–PM) |
43,576 | 52.76 | –0.42 |
17 | +1 |
|
People's Party (PP) |
12,294 | 14.88 | –1.01 |
5 | +1 |
|
Convergence and Union (CiU) |
8,484 | 10.27 | +0.49 |
3 | ±0 |
|
Initiative–EUiA–Agreement for Municipal Progress (ICV–EUiA–EPM) |
7,368 | 8.92 | –2.78 |
2 | –1 |
|
|
Republican Left of Catalonia–Municipal Agreement (ERC–AM) |
3,939 | 4.77 | –0.68 |
0 | –1 |
|
Citizens–Party of the Citizenry (C's) |
3,105 | 3.76 | New |
0 | ±0 |
|
The Greens–Green Option (EV–OV) |
1,174 | 1.42 | New |
0 | ±0 |
|
National Democracy (DN) |
238 | 0.29 | New |
0 | ±0 |
|
Catalan Republican Party (RC) |
227 | 0.27 | New |
0 | ±0 |
|
Unsubmissive Seats–Alternative of Discontented Democrats (Ei–ADD) |
221 | 0.27 | New |
0 | ±0 |
|
Spain 2000 (E–2000) |
84 | 0.10 | New |
0 | ±0 |
| Blank ballots |
1,886 | 2.28 | +0.96 |
|
|
| Total |
82,596 | |
27 | ±0 |
|
| Valid votes |
82,596 | 99.66 | +0.02 |
|
| Invalid votes |
285 | 0.34 | –0.02 |
| Votes cast / turnout |
82,881 | 46.69 | –8.12 |
| Abstentions |
94,632 | 53.31 | +8.12 |
| Registered voters |
177,513 | |
|
| Sources[1][2][10][11] |
Lleida
- Population: 125,677
← Summary of the 27 May 2007 City Council of Lleida election results →
|
| Parties and coalitions |
Popular vote |
Seats |
| Votes |
% |
±pp |
Total |
+/− |
|
Socialists' Party of Catalonia–Municipal Progress (PSC–PM) |
22,172 | 46.23 | +9.93 |
15 | +5 |
|
Convergence and Union (CiU) |
9,613 | 20.04 | –3.37 |
6 | –1 |
|
People's Party (PP) |
5,690 | 11.86 | –2.04 |
3 | –1 |
|
Republican Left of Catalonia–Municipal Agreement (ERC–AM) |
3,336 | 6.96 | –5.60 |
2 | –1 |
|
Initiative–EUiA–Agreement for Municipal Progress (ICV–EUiA–EPM) |
2,737 | 5.71 | –4.58 |
1 | –2 |
|
|
Popular Unity Candidacy (CUP) |
1,030 | 2.15 | New |
0 | ±0 |
|
Citizens–Party of the Citizenry (C's) |
981 | 2.05 | New |
0 | ±0 |
|
Organization of Independent Neighbors (OVI) |
464 | 0.97 | –0.70 |
0 | ±0 |
|
Civil Society (SOC) |
158 | 0.33 | New |
0 | ±0 |
|
Family and Life Party (PFiV) |
125 | 0.26 | New |
0 | ±0 |
|
Working Lleida (LT) |
117 | 0.24 | New |
0 | ±0 |
|
Catalan Republican Party (RC) |
93 | 0.19 | New |
0 | ±0 |
|
Platform for Catalonia (PxC) |
62 | 0.13 | New |
0 | ±0 |
|
Humanist Party (PH) |
45 | 0.09 | –0.06 |
0 | ±0 |
| Blank ballots |
1,335 | 2.78 | +1.16 |
|
|
| Total |
47,958 | |
27 | ±0 |
|
| Valid votes |
47,958 | 99.50 | –0.13 |
|
| Invalid votes |
242 | 0.50 | +0.13 |
| Votes cast / turnout |
48,200 | 51.80 | –7.63 |
| Abstentions |
44,846 | 48.20 | +7.63 |
| Registered voters |
93,046 | |
|
| Sources[1][2][12][13] |
Sabadell
- Population: 200,545
← Summary of the 27 May 2007 City Council of Sabadell election results →
|
| Parties and coalitions |
Popular vote |
Seats |
| Votes |
% |
±pp |
Total |
+/− |
|
Socialists' Party of Catalonia–Municipal Progress (PSC–PM) |
30,091 | 41.08 | –7.52 |
13 | –2 |
|
Convergence and Union (CiU) |
11,053 | 15.09 | +2.28 |
5 | +2 |
|
Initiative–EUiA–Agreement for Municipal Progress (ICV–EUiA–EPM) |
9,550 | 13.04 | +2.29 |
4 | +1 |
|
People's Party (PP) |
6,054 | 8.27 | –0.80 |
2 | ±0 |
|
Agreement for Sabadell–Vallès Alternative Candidacies (ES–CAV) |
5,969 | 8.15 | +1.16 |
2 | ±0 |
|
Republican Left of Catalonia–Municipal Agreement (ERC–AM) |
4,258 | 5.81 | –3.21 |
1 | –1 |
|
|
Citizens–Party of the Citizenry (C's) |
2,073 | 2.83 | New |
0 | ±0 |
|
Citizen Platform for Sabadell (PCpS) |
1,191 | 1.63 | +0.99 |
0 | ±0 |
|
Family and Life Party (PFiV) |
217 | 0.30 | New |
0 | ±0 |
|
Catalan Republican Party (RC) |
211 | 0.29 | New |
0 | ±0 |
|
Unsubmissive Seats–Alternative of Discontented Democrats (Ei–ADD) |
196 | 0.27 | New |
0 | ±0 |
|
Republican Left–Left Republican Party (IR–PRE) |
148 | 0.20 | –0.07 |
0 | ±0 |
|
Republican Social Movement (MSR) |
144 | 0.20 | –0.02 |
0 | ±0 |
| Blank ballots |
2,087 | 2.85 | +1.62 |
|
|
| Total |
73,242 | |
27 | ±0 |
|
| Valid votes |
73,242 | 99.59 | –0.10 |
|
| Invalid votes |
302 | 0.41 | +0.10 |
| Votes cast / turnout |
73,544 | 48.02 | –8.86 |
| Abstentions |
79,600 | 51.98 | +8.86 |
| Registered voters |
153,144 | |
|
| Sources[1][2][14][15] |
Tarragona
- Population: 131,158
← Summary of the 27 May 2007 City Council of Tarragona election results →
|
| Parties and coalitions |
Popular vote |
Seats |
| Votes |
% |
±pp |
Total |
+/− |
|
Socialists' Party of Catalonia–Municipal Progress (PSC–PM) |
20,366 | 39.76 | +8.22 |
13 | +4 |
|
Convergence and Union (CiU) |
11,819 | 23.07 | –10.48 |
8 | –2 |
|
People's Party (PP) |
6,976 | 13.62 | –1.23 |
4 | ±0 |
|
Republican Left of Catalonia–Municipal Agreement (ERC–AM) |
3,938 | 7.69 | –1.17 |
2 | ±0 |
|
|
Initiative–EUiA–Agreement for Municipal Progress (ICV–EUiA–EPM) |
2,439 | 4.76 | –4.00 |
0 | –2 |
|
Citizens–Party of the Citizenry (C's) |
1,917 | 3.74 | New |
0 | ±0 |
|
Independent Group Tarragona (TGI–FIC) |
1,371 | 2.68 | New |
0 | ±0 |
|
Municipal Democratic Group (ADMC) |
599 | 1.17 | New |
0 | ±0 |
|
We Are–People's Unity Assembly (NSom–AUP) |
261 | 0.51 | New |
0 | ±0 |
|
Bloc of Committed Citizens (BCC) |
258 | 0.50 | New |
0 | ±0 |
|
Unsubmissive Seats–Alternative of Discontented Democrats (Ei–ADD) |
165 | 0.32 | New |
0 | ±0 |
|
Family and Life Party (PFiV) |
64 | 0.12 | New |
0 | ±0 |
|
National Alliance (AN) |
55 | 0.11 | New |
0 | ±0 |
|
Humanist Party (PH) |
47 | 0.09 | –0.10 |
0 | ±0 |
| Blank ballots |
948 | 1.85 | +0.37 |
|
|
| Total |
51,223 | |
27 | ±0 |
|
| Valid votes |
51,223 | 99.57 | –0.06 |
|
| Invalid votes |
219 | 0.43 | +0.06 |
| Votes cast / turnout |
51,442 | 53.06 | –7.45 |
| Abstentions |
45,516 | 46.94 | +7.45 |
| Registered voters |
96,958 | |
|
| Sources[1][2][16][17] |