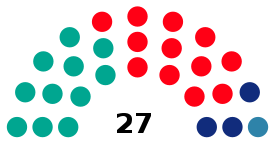
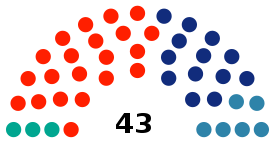
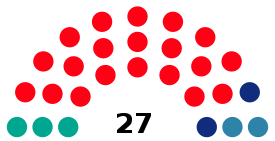
This is the results breakdown of the local elections held in Catalonia on 8 May 1983. The following tables show detailed results in the autonomous community's most populous municipalities, sorted alphabetically.[1]
Municipalities
Badalona
- Population: 231,175
← Summary of the 8 May 1983 City Council of Badalona election results →
|
| Parties and coalitions |
Popular vote |
Seats |
| Votes |
% |
±pp |
Total |
+/− |
|
Socialists' Party of Catalonia (PSC–PSOE) |
39,093 | 39.39 | +8.34 |
12 | +2 |
|
Unified Socialist Party of Catalonia (PSUC) |
35,926 | 36.20 | +1.31 |
11 | –1 |
|
Convergence and Union (CiU) |
10,118 | 10.19 | –0.53 |
3 | ±0 |
|
People's Coalition (AP–PDP–UL)1 |
6,208 | 6.26 | +6.26 |
1 | +1 |
|
|
Party of the Communists of Catalonia (PCC) |
3,947 | 3.98 | New |
0 | ±0 |
|
Republican Left of Catalonia (ERC) |
1,973 | 1.99 | +0.14 |
0 | ±0 |
|
United Left of Badalona (EUB) |
1,068 | 1.08 | New |
0 | ±0 |
|
Workers' Socialist Party (PST) |
645 | 0.65 | New |
0 | ±0 |
|
Centrists of Catalonia (CC–UCD) |
n/a | n/a | –8.64 |
0 | –2 |
| Blank ballots |
269 | 0.27 | –0.04 |
|
|
| Total |
99,247 | |
27 | ±0 |
|
| Valid votes |
99,247 | 99.20 | –0.28 |
|
| Invalid votes |
799 | 0.80 | +0.28 |
| Votes cast / turnout |
100,046 | 62.55 | +3.15 |
| Abstentions |
59,909 | 37.45 | –3.15 |
| Registered voters |
159,955 | |
|
| Sources[1][2][3] |
|
|
Barcelona
- Population: 1,771,998
← Summary of the 8 May 1983 City Council of Barcelona election results →
|
| Parties and coalitions |
Popular vote |
Seats |
| Votes |
% |
±pp |
Total |
+/− |
|
Socialists' Party of Catalonia (PSC–PSOE) |
412,991 | 45.80 | +11.75 |
21 | +5 |
|
Convergence and Union (CiU) |
246,780 | 27.37 | +8.78 |
13 | +5 |
|
People's Coalition (AP–PDP–UL)1 |
117,052 | 12.98 | +9.98 |
6 | +6 |
|
Unified Socialist Party of Catalonia (PSUC) |
62,421 | 6.92 | –11.98 |
3 | –6 |
|
|
Republican Left of Catalonia (ERC) |
34,777 | 3.86 | –1.37 |
0 | –2 |
|
Party of the Communists of Catalonia (PCC) |
9,653 | 1.07 | New |
0 | ±0 |
|
Democratic and Social Centre (CDS) |
8,518 | 0.94 | New |
0 | ±0 |
|
Workers' Socialist Party (PST) |
2,699 | 0.30 | New |
0 | ±0 |
|
Spanish Phalanx of the CNSO (FE–JONS) |
1,194 | 0.13 | New |
0 | ±0 |
|
Revolutionary Workers' Party of Spain (PORE) |
864 | 0.10 | New |
0 | ±0 |
|
Popular Struggle Coalition (CLP) |
848 | 0.09 | New |
0 | ±0 |
|
Conservatives of Catalonia (CC) |
0 | 0.00 | New |
0 | ±0 |
|
Centrists of Catalonia (CC–UCD) |
n/a | n/a | –16.73 |
0 | –8 |
| Blank ballots |
3,847 | 0.43 | +0.11 |
|
|
| Total |
901,644 | |
43 | ±0 |
|
| Valid votes |
901,644 | 98.36 | –1.27 |
|
| Invalid votes |
15,040 | 1.64 | +1.27 |
| Votes cast / turnout |
916,684 | 67.42 | +13.15 |
| Abstentions |
442,905 | 32.58 | –13.15 |
| Registered voters |
1,359,589 | |
|
| Sources[1][4][5][6] |
|
|
Gerona
- Population: 65,586
← Summary of the 8 May 1983 City Council of Gerona election results →
|
| Parties and coalitions |
Popular vote |
Seats |
| Votes |
% |
±pp |
Total |
+/− |
|
Socialists' Party of Catalonia (PSC–PSOE) |
16,554 | 51.73 | +19.75 |
15 | +6 |
|
Convergence and Union (CiU) |
7,202 | 22.51 | –2.76 |
6 | –1 |
|
People's Coalition (AP–PDP–UL) |
3,772 | 11.79 | New |
3 | +3 |
|
Unified Socialist Party of Catalonia (PSUC) |
1,842 | 5.76 | –10.74 |
1 | –3 |
|
|
Republican Left of Catalonia (ERC) |
1,570 | 4.91 | New |
0 | ±0 |
|
Democratic and Social Centre (CDS) |
584 | 1.83 | New |
0 | ±0 |
|
Party of the Communists of Catalonia (PCC) |
346 | 1.08 | New |
0 | ±0 |
|
Centrists of Catalonia (CC–UCD) |
n/a | n/a | –20.89 |
0 | –5 |
| Blank ballots |
128 | 0.40 | +0.10 |
|
|
| Total |
31,998 | |
25 | ±0 |
|
| Valid votes |
31,998 | 98.98 | –0.50 |
|
| Invalid votes |
330 | 1.02 | +0.50 |
| Votes cast / turnout |
32,328 | 69.69 | +5.20 |
| Abstentions |
14,058 | 30.31 | –5.20 |
| Registered voters |
46,386 | |
|
| Sources[1][7][8] |
Hospitalet
- Population: 291,066
← Summary of the 8 May 1983 City Council of Hospitalet election results →
|
| Parties and coalitions |
Popular vote |
Seats |
| Votes |
% |
±pp |
Total |
+/− |
|
Socialists' Party of Catalonia (PSC–PSOE) |
86,128 | 64.69 | +23.60 |
20 | +8 |
|
Unified Socialist Party of Catalonia (PSUC) |
16,835 | 12.64 | –22.35 |
3 | –8 |
|
Convergence and Union (CiU) |
11,442 | 8.59 | +1.18 |
2 | ±0 |
|
People's Coalition (AP–PDP–UL)1 |
10,727 | 8.06 | +8.06 |
2 | +2 |
|
|
Party of the Communists of Catalonia (PCC) |
3,353 | 2.52 | New |
0 | ±0 |
|
Republican Left of Catalonia (ERC) |
2,004 | 1.51 | New |
0 | ±0 |
|
Democratic and Social Centre (CDS) |
1,320 | 0.99 | New |
0 | ±0 |
|
Workers' Socialist Party (PST) |
503 | 0.38 | New |
0 | ±0 |
|
Communist League (LC) |
387 | 0.29 | New |
0 | ±0 |
|
Centrists of Catalonia (CC–UCD) |
n/a | n/a | –8.93 |
0 | –2 |
| Blank ballots |
440 | 0.33 | –0.01 |
|
|
| Total |
133,139 | |
27 | ±0 |
|
| Valid votes |
133,139 | 98.18 | –1.32 |
|
| Invalid votes |
2,463 | 1.82 | +1.32 |
| Votes cast / turnout |
135,602 | 63.95 | +5.37 |
| Abstentions |
76,455 | 36.05 | –5.37 |
| Registered voters |
212,057 | |
|
| Sources[1][9][10] |
|
|
Lérida
- Population: 109,397
← Summary of the 8 May 1983 City Council of Lérida election results →
|
| Parties and coalitions |
Popular vote |
Seats |
| Votes |
% |
±pp |
Total |
+/− |
|
Socialists' Party of Catalonia (PSC–PSOE) |
25,678 | 54.18 | +22.93 |
17 | +8 |
|
Convergence and Union (CiU) |
7,894 | 16.66 | +4.85 |
5 | +2 |
|
People's Coalition (AP–PDP–UL)1 |
7,622 | 16.08 | +13.59 |
5 | +5 |
|
|
Unified Socialist Party of Catalonia (PSUC) |
1,878 | 3.96 | –13.94 |
0 | –5 |
|
Republican Left of Catalonia (ERC) |
1,659 | 3.50 | –3.73 |
0 | –2 |
|
Democratic and Social Centre (CDS) |
1,382 | 2.92 | New |
0 | ±0 |
|
Party of the Communists of Catalonia (PCC) |
1,086 | 2.29 | New |
0 | ±0 |
|
Centrists of Catalonia (CC–UCD) |
n/a | n/a | –25.21 |
0 | –8 |
| Blank ballots |
197 | 0.42 | +0.10 |
|
|
| Total |
47,396 | |
27 | ±0 |
|
| Valid votes |
47,396 | 98.58 | –0.78 |
|
| Invalid votes |
681 | 1.42 | +0.78 |
| Votes cast / turnout |
48,077 | 61.10 | +8.67 |
| Abstentions |
30,608 | 38.90 | –8.67 |
| Registered voters |
78,685 | |
|
| Sources[1][11][12] |
|
|
Sabadell
- Population: 189,147
← Summary of the 8 May 1983 City Council of Sabadell election results →
|
| Parties and coalitions |
Popular vote |
Seats |
| Votes |
% |
±pp |
Total |
+/− |
|
Unified Socialist Party of Catalonia (PSUC) |
48,426 | 51.33 | +7.81 |
15 | +2 |
|
Convergence and Union (CiU) |
18,002 | 19.08 | –0.45 |
5 | –1 |
|
Socialists' Party of Catalonia (PSC–PSOE) |
16,402 | 17.39 | –3.24 |
5 | –1 |
|
People's Coalition (AP–PDP–UL) |
6,288 | 6.67 | New |
2 | +2 |
|
|
Party of the Communists of Catalonia (PCC) |
2,888 | 3.06 | New |
0 | ±0 |
|
Republican Left of Catalonia (ERC) |
1,631 | 1.73 | +0.28 |
0 | ±0 |
|
Workers' Socialist Party (PST) |
291 | 0.31 | New |
0 | ±0 |
|
Popular Struggle Coalition (CLP) |
151 | 0.16 | New |
0 | ±0 |
|
Communist League (LC) |
1 | 0.00 | New |
0 | ±0 |
|
Centrists of Catalonia (CC–UCD) |
n/a | n/a | –8.64 |
0 | –2 |
| Blank ballots |
256 | 0.27 | +0.01 |
|
|
| Total |
94,336 | |
27 | ±0 |
|
| Valid votes |
94,336 | 99.56 | –0.06 |
|
| Invalid votes |
420 | 0.44 | +0.06 |
| Votes cast / turnout |
94,756 | 70.08 | +3.17 |
| Abstentions |
40,452 | 29.92 | –3.17 |
| Registered voters |
135,208 | |
|
| Sources[1][13][14] |
Tarragona
- Population: 112,238
← Summary of the 8 May 1983 City Council of Tarragona election results →
|
| Parties and coalitions |
Popular vote |
Seats |
| Votes |
% |
±pp |
Total |
+/− |
|
Socialists' Party of Catalonia (PSC–PSOE) |
21,267 | 43.52 | +17.64 |
14 | +6 |
|
Convergence and Union (CiU) |
9,090 | 18.60 | +4.32 |
6 | +2 |
|
People's Coalition (AP–PDP–UL)1 |
8,458 | 17.31 | +14.71 |
5 | +5 |
|
Unified Socialist Party of Catalonia (PSUC) |
3,467 | 7.09 | –14.58 |
2 | –4 |
|
|
Republican Left of Catalonia (ERC) |
2,270 | 4.64 | –0.43 |
0 | –1 |
|
Party of the Communists of Catalonia (PCC) |
1,660 | 3.40 | New |
0 | ±0 |
|
Candidacy for the Neighbors' Participation in the City Council (CPV) |
1,648 | 3.37 | –3.35 |
0 | –2 |
|
Democratic and Social Centre (CDS) |
799 | 1.63 | New |
0 | ±0 |
|
Centrists of Catalonia (CC–UCD) |
n/a | n/a | –20.26 |
0 | –6 |
| Blank ballots |
211 | 0.43 | +0.12 |
|
|
| Total |
48,870 | |
27 | ±0 |
|
| Valid votes |
48,870 | 99.09 | –0.29 |
|
| Invalid votes |
448 | 0.91 | +0.29 |
| Votes cast / turnout |
49,318 | 63.73 | +7.05 |
| Abstentions |
28,065 | 36.27 | –7.05 |
| Registered voters |
77,383 | |
|
| Sources[1][15][16] |
|
|


