Pilot Mound, Manitoba
| Pilot Mound | |
|---|---|
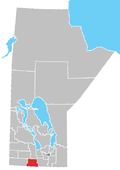
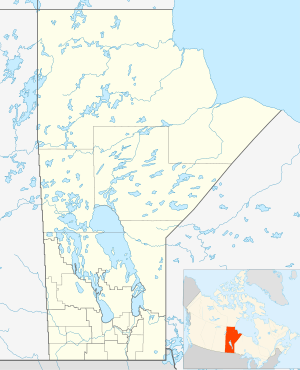 Pilot Mound Location of Pilot Mound in Manitoba | |
| Coordinates: 49°12′05″N 98°53′38″W / 49.20139°N 98.89389°WCoordinates: 49°12′05″N 98°53′38″W / 49.20139°N 98.89389°W | |
| Country | Canada |
| Province | Manitoba |
| Region | Westman |
| Rural Municipality | Rural Municipality of Louise |
| Established | 1881 |
| Government | |
| • MP (Brandon-Souris) | Larry Maguire (CPC) |
| • MLA (Midland) | Blaine Pedersen (PC) |
| Area | |
| • Total | 2.65 km2 (1.02 sq mi) |
| Elevation | 338 m (1,125 ft) |
| Population (2016) | |
| • Total | 627 |
| • Density | 236.6/km2 (613/sq mi) |
| • Change 2011-2016 | Template:Decreased1.3% |
| Time zone | UTC-6 (CST) |
| • Summer (DST) | UTC-5 (CDT) |
| Postal code span | R0G |
| Area code(s) | 204 |

Pilot Mound is an unincorporated community recognized as a local urban district[1] that also once held town status in the Canadian province of Manitoba. It is located within the Municipality of Louise approximately 60 km west of the City of Morden.
Sports
- Pilot Mound is home to the Pilot Mound Pilots ice hockey team who play in the Tiger Hills Hockey League.
- The community has featured heavily as a finalist in CBC Television's Kraft Hockeyville 2008 competition.
- It is the birthplace of NHL hall of famer Black Jack Stewart.
- Riley Weselowski (born 1985 in Pilot Mound) is a professional ice hockey player.
- Home of Brett slips Pinkerton
- Nolan Thiessen two time Tim Hortons Brier champion and 2010 World Men's Curling Championship winner.
Climate
| Climate data for Pilot Mound (1981-2010) | |||||||||||||
|---|---|---|---|---|---|---|---|---|---|---|---|---|---|
| Month | Jan | Feb | Mar | Apr | May | Jun | Jul | Aug | Sep | Oct | Nov | Dec | Year |
| Record high °C (°F) | 9 (48) |
11 (52) |
20 (68) |
35 (95) |
35.7 (96.3) |
37.2 (99) |
37.8 (100) |
38.3 (100.9) |
37.8 (100) |
32.2 (90) |
22.2 (72) |
12.2 (54) |
38.3 (100.9) |
| Average high °C (°F) | −11.1 (12) |
−7.1 (19.2) |
−1.1 (30) |
9.8 (49.6) |
18.2 (64.8) |
22.8 (73) |
24.9 (76.8) |
24.8 (76.6) |
19.0 (66.2) |
10.1 (50.2) |
−0.4 (31.3) |
−7.9 (17.8) |
8.5 (47.3) |
| Daily mean °C (°F) | −15.7 (3.7) |
−11.9 (10.6) |
−5.6 (21.9) |
4.1 (39.4) |
11.8 (53.2) |
17.0 (62.6) |
19.2 (66.6) |
18.6 (65.5) |
13.1 (55.6) |
4.9 (40.8) |
−4.5 (23.9) |
−12 (10) |
3.2 (37.8) |
| Average low °C (°F) | −20.2 (−4.4) |
−16.6 (2.1) |
−10.1 (13.8) |
−1.6 (29.1) |
5.4 (41.7) |
11.1 (52) |
13.4 (56.1) |
12.3 (54.1) |
7.0 (44.6) |
−0.3 (31.5) |
−8.6 (16.5) |
−16.1 (3) |
−2 (28) |
| Record low °C (°F) | −41.1 (−42) |
−40 (−40) |
−36.7 (−34.1) |
−26 (−15) |
−12.2 (10) |
−3.3 (26.1) |
2.2 (36) |
−0.1 (31.8) |
−7.2 (19) |
−16.9 (1.6) |
−35.1 (−31.2) |
−39 (−38) |
−41.1 (−42) |
| Average precipitation mm (inches) | 23.3 (0.917) |
19.7 (0.776) |
24.3 (0.957) |
25.6 (1.008) |
75.0 (2.953) |
92.9 (3.657) |
82.1 (3.232) |
72.5 (2.854) |
44.8 (1.764) |
35.9 (1.413) |
26.5 (1.043) |
25.4 (1) |
548.0 (21.575) |
| Source: Environment Canada[2] | |||||||||||||
References
- ↑ "Local Urban Districts Regulation". Government of Manitoba. April 23, 2016. Retrieved April 24, 2016.
- ↑ "Canadian Climate Normals 1981–2010". Environment Canada. Retrieved 24 July 2017.
External links
| Wikimedia Commons has media related to Pilot Mound, Manitoba. |
Places adjacent to Pilot Mound, Manitoba | ||||||||||
|---|---|---|---|---|---|---|---|---|---|---|
| ||||||||||
| Towns |
|  | ||
|---|---|---|---|---|
| Villages |
| |||
| Rural municipalities |
| |||
| First Nations | ||||
| Indian reserves | ||||
| Unincorporated communities | ||||
This article is issued from
Wikipedia.
The text is licensed under Creative Commons - Attribution - Sharealike.
Additional terms may apply for the media files.