Municipalities of Zacatecas
.svg.png)
Zacatecas is a state in North Central Mexico that is divided into 58 municipalities.[1] According to the 2015 Mexican Intercensal Survey, it is the state that has the 8th smallest population with 1,579,209[2] inhabitants and the 8th largest by land area spanning 75,539 square kilometres (29,166 sq mi).[3]
Municipalities in Zacatecas are administratively autonomous of the state according to the 115th article of the 1917 Constitution of Mexico.[4] Every three years, citizens elect a municipal president (Spanish: presidente municipal) by a plurality voting system who heads a concurrently elected municipal council (ayuntamiento) responsible for providing all the public services for their constituents. The municipal council consists of a variable number of trustees and councillors (regidores y síndicos).[5] Municipalities are responsible for public services (such as water and sewerage), street lighting, public safety, traffic, supervision of slaughterhouses and the maintenance of public parks, gardens and cemeteries.[6] They may also assist the state and federal governments in education, emergency fire and medical services, environmental protection and maintenance of monuments and historical landmarks. Since 1984, they have had the power to collect property taxes and user fees, although more funds are obtained from the state and federal governments than from their own income.[6]
The largest municipality by population in Zacatecas is Fresnillo, with 230,865 residents, and the smallest municipality by population is El Plateado de Joaquín Amaro with 1,160 residents.[1] The largest municipality by area is the municipality of Mazapil which spans 12,143.256 km2 (4,688.537 sq mi), while Vetagrande is the smallest at 160.362 km2 (61.916 sq mi).[7]
Municipalities
- Largest municipalities in Zacatecas by population
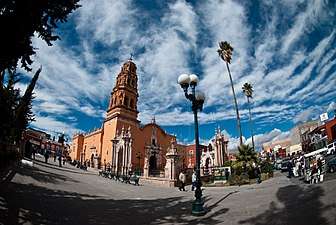 Parish of the Purification in downtown Fresnillo, Zacatecas' largest municipality by population
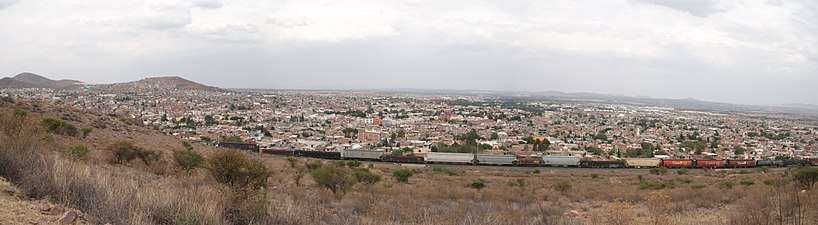 Panorama of Guadalupe , the second largest municipality by population in Zacatecas
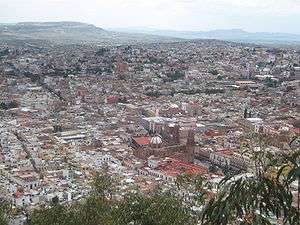 Skyline of Zacatecas, Capital of Zacatecas and third largest municipality by population
| Name | Municipal Seat | Population (2015)[1][8] |
Population (2010)[9] |
Change | Land area (km2) [7] | Population density | Incorporation date | |
|---|---|---|---|---|---|---|---|---|
| km2 | sq mi | |||||||
| Apozol | Apozol | 6,086 | 6,314 | −3.6% | 293.631 | 113.372 | 20.7/km2 (53.7/sq mi) | |
| Apulco | Apulco | 4,738 | 5,005 | −5.3% | 203.03 | 78.39 | 23.3/km2 (60.4/sq mi) | |
| Atolinga | Atolinga | 2,427 | 2,692 | −9.8% | 281.968 | 108.868 | 8.6/km2 (22.3/sq mi) | |
| Benito Juárez | Benito Juárez | 3,990 | 4,372 | −8.7% | 329.698 | 127.297 | 12.1/km2 (31.3/sq mi) | |
| Calera | Víctor Rosales | 45,204 | 39,917 | +13.2% | 388.387 | 149.957 | 116.4/km2 (301.4/sq mi) | |
| Cañitas de Felipe Pescador | Cañitas de Felipe Pescador | 8,393 | 8,239 | +1.9% | 450.52 | 173.95 | 18.6/km2 (48.3/sq mi) | |
| Chalchihuites | Chalchihuites | 11,416 | 10,565 | +8.1% | 903.025 | 348.660 | 12.6/km2 (32.7/sq mi) | |
| Concepción del Oro | Concepción del Oro | 12,944 | 12,803 | +1.1% | 2,423.522 | 935.727 | 5.3/km2 (13.8/sq mi) | |
| Cuauhtémoc | San Pedro Piedra Gorda | 12,590 | 11,915 | +5.7% | 325.204 | 125.562 | 38.7/km2 (100.3/sq mi) | |
| El Plateado de Joaquín Amaro | El Plateado de Joaquín Amaro | 1,160 | 1,609 | −27.9% | 354.501 | 136.874 | 3.3/km2 (8.5/sq mi) | |
| El Salvador | El Salvador | 2,455 | 2,710 | −9.4% | 625.226 | 241.401 | 3.9/km2 (10.2/sq mi) | |
| Fresnillo | Fresnillo | 230,865 | 213,139 | +8.3% | 5,104.663 | 1,970.921 | 45.2/km2 (117.1/sq mi) | |
| Genaro Codina | Genaro Codina | 8,185 | 8,104 | +1.0% | 796.786 | 307.641 | 10.3/km2 (26.6/sq mi) | |
| General Enrique Estrada | General Enrique Estrada | 6,325 | 5,894 | +7.3% | 198.187 | 76.520 | 31.9/km2 (82.7/sq mi) | |
| General Francisco R Murguía | Nieves | 21,809 | 21,974 | −0.8% | 5,034.261 | 1,943.739 | 4.3/km2 (11.2/sq mi) | |
| General Pánfilo Natera | General Pánfilo Natera | 23,192 | 22,346 | +3.8% | 443.177 | 171.112 | 52.3/km2 (135.5/sq mi) | |
| Guadalupe | Guadalupe | 187,918 | 159,991 | +17.5% | 819.044 | 316.235 | 229.4/km2 (594.2/sq mi) | |
| Huanusco | Huanusco | 4,084 | 4,306 | −5.2% | 373.284 | 144.126 | 10.9/km2 (28.3/sq mi) | |
| Jalpa | Jalpa | 24,093 | 23,557 | +2.3% | 719.782 | 277.909 | 33.5/km2 (86.7/sq mi) | |
| Jerez | Jerez de García Salinas | 59,125 | 57,610 | +2.6% | 1,547.193 | 597.375 | 38.2/km2 (99.0/sq mi) | |
| Jiménez del Teul | Jiménez del Teul | 4,275 | 4,584 | −6.7% | 1,204.779 | 465.168 | 3.5/km2 (9.2/sq mi) | |
| Juan Aldama | Juan Aldama | 21,806 | 20,543 | +6.1% | 624.971 | 241.303 | 34.9/km2 (90.4/sq mi) | |
| Juchipila | Juchipila | 12,627 | 12,284 | +2.8% | 339.49 | 131.08 | 37.2/km2 (96.3/sq mi) | |
| Loreto | Loreto | 53,441 | 48,365 | +10.5% | 430.213 | 166.106 | 124.2/km2 (321.7/sq mi) | |
| Luis Moya | Luis Moya | 13,292 | 12,234 | +8.6% | 177.332 | 68.468 | 75.0/km2 (194.1/sq mi) | |
| Mazapil | Mazapil | 17,457 | 17,813 | −2.0% | 12,143.256 | 4,688.537 | 1.4/km2 (3.7/sq mi) | |
| Melchor Ocampo | Melchor Ocampo | 2,938 | 2,662 | +10.4% | 1,885.382 | 727.950 | 1.6/km2 (4.0/sq mi) | |
| Mezquital del Oro | Mezquital del Oro | 2,484 | 2,584 | −3.9% | 487.82 | 188.35 | 5.1/km2 (13.2/sq mi) | |
| Miguel Auza | Miguel Auza | 23,827 | 22,296 | +6.9% | 1,108.308 | 427.920 | 21.5/km2 (55.7/sq mi) | |
| Momax | Momax | 2,404 | 2,529 | −4.9% | 162.23 | 62.64 | 14.8/km2 (38.4/sq mi) | |
| Monte Escobedo | Monte Escobedo | 9,129 | 8,929 | +2.2% | 1,612.123 | 622.444 | 5.7/km2 (14.7/sq mi) | |
| Morelos | Morelos | 12,354 | 11,493 | +7.5% | 181.363 | 70.025 | 68.1/km2 (176.4/sq mi) | |
| Moyahua de Estrada | Moyahua de Estrada | 3,947 | 4,563 | −13.5% | 541.729 | 209.163 | 7.3/km2 (18.9/sq mi) | |
| Nochistlán de Mejía | Nochistlán de Mejía | 27,750 | 27,932 | −0.7% | 880.01 | 339.77 | 31.5/km2 (81.7/sq mi) | |
| Noria de Ángeles | Noria de Ángeles | 16,864 | 15,607 | +8.1% | 409.512 | 158.113 | 41.2/km2 (106.7/sq mi) | |
| Ojocaliente | Ojocaliente | 43,471 | 40,740 | +6.7% | 646.428 | 249.587 | 67.2/km2 (174.2/sq mi) | |
| Pánuco | Pánuco | 17,647 | 16,875 | +4.6% | 587.558 | 226.857 | 30.0/km2 (77.8/sq mi) | |
| Pinos | Pinos | 73,151 | 69,844 | +4.7% | 3,176.943 | 1,226.625 | 23.0/km2 (59.6/sq mi) | |
| Río Grande | Río Grande | 63,880 | 62,693 | +1.9% | 1,842.931 | 711.560 | 34.7/km2 (89.8/sq mi) | |
| Saín Alto | Saín Alto | 22,278 | 21,533 | +3.5% | 1,418.291 | 547.605 | 15.7/km2 (40.7/sq mi) | |
| Santa María de la Paz | Santa María de la Paz | 2,656 | 2,821 | −5.8% | 279.097 | 107.760 | 9.5/km2 (24.6/sq mi) | |
| Sombrerete | Sombrerete | 62,433 | 61,188 | +2.0% | 3,610.545 | 1,394.039 | 17.3/km2 (44.8/sq mi) | |
| Susticacán | Susticacán | 1,329 | 1,360 | −2.3% | 200.096 | 77.257 | 6.6/km2 (17.2/sq mi) | |
| Tabasco | Tabasco | 15,484 | 15,656 | −1.1% | 411.261 | 158.789 | 37.7/km2 (97.5/sq mi) | |
| Tepechitlán | Tepechitlán | 8,855 | 8,215 | +7.8% | 545.888 | 210.769 | 16.2/km2 (42.0/sq mi) | |
| Tepetongo | Tepetongo | 7,071 | 7,090 | −0.3% | 726.362 | 280.450 | 9.7/km2 (25.2/sq mi) | |
| Teúl de González Ortega | Tlaltenango de Sánchez Román | 5,378 | 5,506 | −2.3% | 681.309 | 263.055 | 7.9/km2 (20.4/sq mi) | |
| Tlaltenango de Sánchez Román | Tlaltenango de Sánchez Román | 26,645 | 25,493 | +4.5% | 747.927 | 288.776 | 35.6/km2 (92.3/sq mi) | |
| Trancoso | Trancoso | 19,413 | 16,934 | +14.6% | 221.352 | 85.464 | 87.7/km2 (227.1/sq mi) | |
| Trinidad García de la Cadena | Trinidad García de la Cadena | 2,884 | 3,013 | −4.3% | 307.943 | 118.897 | 9.4/km2 (24.3/sq mi) | |
| Valparaíso | Valparaíso | 32,606 | 33,323 | −2.2% | 5,722.465 | 2,209.456 | 5.7/km2 (14.8/sq mi) | |
| Vetagrande | Vetagrande | 9,796 | 9,353 | +4.7% | 160.362 | 61.916 | 61.1/km2 (158.2/sq mi) | |
| Villa de Cos | Villa de Cos | 35,252 | 34,328 | +2.7% | 6,593.771 | 2,545.869 | 5.3/km2 (13.8/sq mi) | |
| Villa García | Villa García | 18,745 | 18,269 | +2.6% | 342.621 | 132.287 | 54.7/km2 (141.7/sq mi) | |
| Villa González Ortega | Villa González Ortega | 13,099 | 12,893 | +1.6% | 433.025 | 167.192 | 30.2/km2 (78.3/sq mi) | |
| Villa Hidalgo | Villa Hidalgo | 19,155 | 18,490 | +3.6% | 376.31 | 145.29 | 50.9/km2 (131.8/sq mi) | |
| Villanueva | Villanueva | 30,240 | 29,395 | +2.9% | 2,184.719 | 843.525 | 13.8/km2 (35.8/sq mi) | |
| Zacatecas |
Zacatecas | 146,147 | 138,176 | +5.8% | 442.612 | 170.893 | 330.2/km2 (855.2/sq mi) | |
| Zacatecas | — | 1,579,209 | 1,490,668 | +5.9% | 29,136.591 | 11,249.701 | 54.2/km2 (140.4/sq mi) | — |
| Mexico | — | 119,938,473 | 112,336,538 | +6.8% | 1,972,550 | 761,610 | 60.8/km2 (157.5/sq mi) | — |
Defunct municipalities
- Sauceda Municipality Now part of Guadalupe.
- Sierra Hermosa Municipality Now part of Mazapil.
- Tenayuca Municipality
References
- 1 2 3 "Número de habitantes". INEGI. Retrieved July 15, 2017.
- ↑ "Encuesta Intercensal 2015" (PDF) (in Spanish). INEGI. Archived from the original (PDF) on June 29, 2017. Retrieved July 28, 2017.
- ↑ "Resumen" (in Spanish). Cuentame INEGI. Archived from the original on May 13, 2013. Retrieved February 12, 2013.
- ↑ "Constitución Política de los Estados Unidos Mexicanos". Article 115, of 1917 (in Spanish). Retrieved September 27, 2017.
- ↑ OECD (November 12, 2004). New Forms of Governance for Economic Development. OECD Publishing. p. 121. ISBN 9264015329.
- 1 2 International Business Publications (2009). Mexico Company Laws and Regulations Handbook. p. 42. ISBN 1-4330-7030-8.
- 1 2 "Unidad de Microrregiones Cedulas de Informacion Municipal (SCIM)" (in Spanish). Secretara de Desarrollo Social. Retrieved November 18, 2017.
- ↑ "Tabulados de la Encuesta Intercensal 2015" (xls) (in Spanish). INEGI. Retrieved July 15, 2017.
- ↑ "Localidades y su boblacion por mnicipio segun tamano de localidad" (PDF) (in Spanish). INEGI. Retrieved July 15, 2017.