Maryland's 6th congressional district
| Maryland's 6th congressional district | |
|---|---|
.tif.png) Maryland's 6th congressional district - since January 3, 2013. | |
| Current Representative | John Delaney (D–Potomac) |
| Area | 3,062.27 sq mi (7,931.2 km2) |
| Distribution |
|
| Population (2015) | 761,921 |
| Median income | 73,641 |
| Ethnicity |
|
| Cook PVI | D+6[1] |
Maryland's 6th congressional district elects a representative to the United States House of Representatives from the northwest part of the state. Today the district comprises all of Garrett, Allegany, and Washington counties as well as portions of Montgomery and Frederick counties. The seat is currently represented by John Delaney (D). The current boundaries of the district are currently the subject of a Supreme Court lawsuit over partisan gerrymandering.
History
The Maryland 6th District was one of the original districts that had a congressman starting in 1789. At that time, the district essentially had what remains its modern boundaries, consisting of the Maryland panhandle and areas eastward, all the way to the modern western boundary of the District of Columbia. However after the 1790 census Maryland's representation increased to 8 congresspersons. The new sixth district was in the north-east corner of the state east of Baltimore, covering essentially the modern counties of Harford, Cecil and Kent.[2]
In 2012 the district was found to be the ninth least compact congressional district in the United States.[3]
For years, the 6th was a mostly rural and conservative district anchored in western Maryland. It was in Republican hands for all but one term from 1943 to 1971, before conservative Democrat Goodloe Byron won it in 1971. He died in 1978 and was succeeded by his widow, Beverly, who held it for seven terms before being ousted by a more liberal challenger in the 1992 Democratic primary. Republican Roscoe Bartlett won the general election, and was reelected without serious challenge nine more times.
However, redistricting after the 2010 census significantly altered the 6th. It lost heavily Republican Carroll County, as well as the more rural and conservative portions of Frederick County, to the 8th District. It also lost its shares of Baltimore and Harford counties to the already heavily Republican 1st District. Taking their place was a heavily Democratic spur of western Montgomery County, which had almost three times as many people as the rest of the district combined.
The new map turned the 6th from a heavily Republican district into a Democratic-leaning district. While John McCain carried the 6th with 57 percent of the vote in 2008,[4] Barack Obama would have carried the new 6th with 56 percent.[5]
In his bid for an 11th term, Bartlett was defeated by Democrat John Delaney, who lives in the Montgomery County portion of the district, by over 21 points.
In 2013, Republican voters filed a federal lawsuit, alleging that the Democratic legislature and Governor Martin O'Malley had engaged in partisan gerrymandering, redrawing the 6th district after the 2010 census in a way that intentionally and unconstitutionally diluted Republican voters by including parts of the heavily-Democratic Washington, D.C. suburbs. A federal district judge initially dismissed the lawsuit, as did the Fourth Circuit Court of Appeals, for failure to state a claim. The Republicans appealed to the Supreme Court, which ruled unanimously in 2015 that the lower courts had improperly dismissed the case. The case went back to the lower courts where a three judge panel ruled that the Republicans could not prove that John Delaney's election in 2012 was a result of the redistricting. Republican voters again appealed to the Supreme Court, which agreed to hear the case, Benisek v. Lamone, in December 2017.[6][7]
Voting
| Election results from presidential races | ||
|---|---|---|
| Year | Office | Results |
| 2016 | President | Clinton 55.8% - 39.7% |
| 2012 | President | Obama 55.4% - 42.6% |
| 2008 | President | McCain 58% - 40% |
| 2004 | President | Bush 65% - 34% |
| 2000 | President | Bush 61% - 36% |
List of representatives
| Representative | Took office | Left office | Party | Notes/Events | |
|---|---|---|---|---|---|
| 1 | _(cropped).jpg) | March 4, 1789 | March 3, 1791 | Pro-Administration | |
| 2 |  | March 4, 1791 | March 3, 1793 | Anti-Administration | |
| 3 | |
March 4, 1793 | March 3, 1795 | Anti-Administration | |
| March 4, 1795 | March 3, 1797 | Democratic-Republican | |||
| 4 | | March 4, 1797 | March 3, 1799 | Federalist | |
| 5 | | March 4, 1799 | March 3, 1801 | Democratic-Republican | |
| 6 |  | March 4, 1801 | March 3, 1807 | Democratic-Republican | |
| 7 | | March 4, 1807 | April 29, 1811 | Democratic-Republican | resigned after being appointed Attorney General of Maryland |
| 8 |  | October 26, 1811 | March 3, 1817 | Democratic-Republican | |
| 9 | | March 4, 1817 | March 3, 1821 | Democratic-Republican | |
| 10 | | March 4, 1821 | March 19, 1822 | Democratic-Republican | contested election |
| 11 |  | March 19, 1822 | March 3, 1823 | Democratic-Republican | |
| 12 | |
March 4, 1823 | March 3, 1825 | Adams-Clay DR | |
| March 4, 1825 | March 3, 1827 | Jacksonian | |||
| 13 | | March 4, 1827 | March 3, 1829 | Jacksonian | |
| 14 | | December 7, 1829 | June 28, 1832 | Jacksonian | Died |
| 15 | | October 1, 1832 | March 3, 1833 | Jacksonian | |
| 16 | | March 4, 1833 | March 3, 1835 | Anti-Jacksonian | |
| 17 |  |
March 4, 1835 | March 3, 1837 | Jacksonian | Redistricted from the 7th district |
| March 4, 1837 | March 3, 1841 | Democratic | |||
| 18 | | March 4, 1841 | March 3, 1843 | Democratic | |
| 19 | | March 4, 1843 | March 3, 1845 | Whig | |
| 20 | | March 4, 1845 | March 3, 1847 | Whig | |
| 21 |  | March 4, 1847 | March 3, 1849 | Whig | |
| 22 |  | March 4, 1849 | March 3, 1851 | Whig | |
| 23 | | March 4, 1851 | March 3, 1853 | Independent Whig | |
| 24 | | March 4, 1853 | March 3, 1855 | Whig | |
| 25 |  | March 4, 1855 | March 3, 1859 | Democratic | |
| 26 |  | March 4, 1859 | March 3, 1861 | Democratic | |
| 27 |  | March 4, 1861 | March 3, 1863 | Unionist | |
| This seat was abolished after the census of 1860, but was reinstated after the census of 1870. | |||||
| 28 |  | March 4, 1873 | March 3, 1875 | Republican | |
| 29 |  | March 4, 1875 | March 3, 1879 | Democratic | |
| 30 | .jpg) | March 4, 1879 | March 3, 1883 | Republican | |
| 31 |  | March 4, 1883 | March 3, 1891 | Republican | |
| 32 |  | March 4, 1891 | March 3, 1895 | Democratic | |
| 33 |  | March 4, 1895 | March 3, 1897 | Republican | |
| 34 | | March 4, 1897 | March 3, 1899 | Republican | |
| 35 |  | March 4, 1899 | March 3, 1911 | Republican | |
| 36 |  | March 4, 1911 | March 3, 1917 | Democratic | |
| 37 |  | March 4, 1917 | March 3, 1931 | Republican | |
| 38 | | March 4, 1931 | January 3, 1939 | Democratic | |
| 39 | .jpg) | January 3, 1939 | February 27, 1941 | Democratic | Died |
| 40 |  | May 27, 1941 | January 3, 1943 | Democratic | |
| 41 |  | January 3, 1943 | January 3, 1953 | Republican | |
| 42 | .jpg) | January 3, 1953 | January 3, 1959 | Republican | |
| 43 | .jpg) | January 3, 1959 | January 3, 1961 | Democratic | |
| 44 | 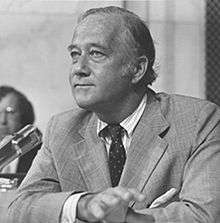 | January 3, 1961 | January 3, 1969 | Republican | |
| 45 | 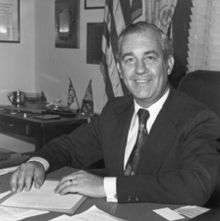 | January 3, 1969 | January 3, 1971 | Republican | |
| 46 | 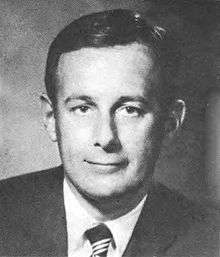 | January 3, 1971 | October 11, 1978 | Democratic | Died |
| 47 | 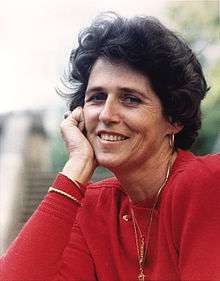 | January 3, 1979 | January 3, 1993 | Democratic | |
| 48 |  | January 3, 1993 | January 3, 2013 | Republican | |
| 49 |  | January 3, 2013 | Present | Democratic | Incumbent |
Election results
1990
| Party | Candidate | Votes | % | |
|---|---|---|---|---|
| Democratic | Beverly B. Byron (inc.) | 106,502 | 65.35 | |
| Republican | Christopher P. Fiotes, Jr. | 56,479 | 34.65 | |
| Total votes | 162,981 | 100.00 | ||
| Democratic hold | ||||
1992
| Party | Candidate | Votes | % | |||
|---|---|---|---|---|---|---|
| Republican | Roscoe Bartlett | 125,564 | 54.17 | |||
| Democratic | Thomas H. Hattery | 106,224 | 45.83 | |||
| Total votes | 231,788 | 100.00 | ||||
| Republican gain from Democratic | ||||||
1994
| Party | Candidate | Votes | % | |
|---|---|---|---|---|
| Republican | Roscoe Bartlett (inc.) | 122,809 | 65.95 | |
| Democratic | Paul Muldowney | 63,411 | 34.05 | |
| Total votes | 186,220 | 100.00 | ||
| Republican hold | ||||
1996
| Party | Candidate | Votes | % | |
|---|---|---|---|---|
| Republican | Roscoe Bartlett (inc.) | 132,853 | 56.83 | |
| Democratic | Stephen Crawford | 100,910 | 43.16 | |
| Write-ins | 25 | 0.01 | ||
| Total votes | 233,788 | 100.00 | ||
| Republican hold | ||||
1998
| Party | Candidate | Votes | % | |
|---|---|---|---|---|
| Republican | Roscoe Bartlett (inc.) | 127,802 | 63.42 | |
| Democratic | Timothy D. McCown | 73,728 | 36.58 | |
| Total votes | 201,530 | 100.00 | ||
| Republican hold | ||||
2000
| Party | Candidate | Votes | % | |
|---|---|---|---|---|
| Republican | Roscoe Bartlett (inc.) | 168,624 | 60.65 | |
| Democratic | Donald M. DeArmon | 109,136 | 39.25 | |
| Write-ins | 285 | 0.10 | ||
| Total votes | 278,045 | 100.00 | ||
| Republican hold | ||||
2002
| Party | Candidate | Votes | % | |
|---|---|---|---|---|
| Republican | Roscoe Bartlett (inc.) | 147,825 | 66.17 | |
| Democratic | Donald M. DeArmon | 75,575 | 33.83 | |
| Total votes | 223,400 | 100.00 | ||
| Republican hold | ||||
2004
| Party | Candidate | Votes | % | |
|---|---|---|---|---|
| Republican | Roscoe Bartlett (inc.) | 206,076 | 67.45 | |
| Democratic | Kenneth T. Bosley | 90,108 | 29.49 | |
| Green | Gregory T. Hemingway | 9,324 | 3.05 | |
| Total votes | 305,508 | 100.00 | ||
| Republican hold | ||||
2006
| Party | Candidate | Votes | % | |
|---|---|---|---|---|
| Republican | Roscoe Bartlett (inc.) | 141,200 | 58.97 | |
| Democratic | Andrew J. Duck | 92,030 | 38.43 | |
| Green | Robert E. Kozak | 6,095 | 2.55 | |
| Write-ins | 128 | 0.05 | ||
| Total votes | 239,453 | 100.00 | ||
| Republican hold | ||||
2008
| Party | Candidate | Votes | % | |
|---|---|---|---|---|
| Republican | Roscoe Bartlett (inc.) | 190,926 | 57.76 | |
| Democratic | Jennifer Dougherty | 128,207 | 38.79 | |
| Libertarian | Gary W. Hoover, Sr. | 11,060 | 3.35 | |
| Write-ins | 342 | 0.10 | ||
| Total votes | 330,535 | 100.00 | ||
| Republican hold | ||||
2010
| Party | Candidate | Votes | % | |
|---|---|---|---|---|
| Republican | Roscoe Bartlett (inc.) | 148,820 | 61.45 | |
| Democratic | Andrew J. Duck | 80,455 | 33.22 | |
| Libertarian | Dan Massey | 6,816 | 2.81 | |
| Constitution | Michael Reed | 5,907 | 2.44 | |
| Write-ins | 191 | 0.08 | ||
| Total votes | 242,189 | 100.00 | ||
| Republican hold | ||||
2012
| Party | Candidate | Votes | % | |||
|---|---|---|---|---|---|---|
| Democratic | John Delaney | 181,921 | 58.8 | |||
| Republican | Roscoe G. Bartlett (inc.) | 117,313 | 37.9 | |||
| Libertarian | Nickolaus Mueller | 9,916 | 3.2 | |||
| N/A | Others (write-in) | 399 | 0.1 | |||
| Total votes | 309,549 | 100 | ||||
| Democratic gain from Republican | ||||||
2014
| Party | Candidate | Votes | % | |
|---|---|---|---|---|
| Democratic | John Delaney (inc.) | 94,704 | 49.7 | |
| Republican | Dan Bongino | 91,930 | 48.2 | |
| Green | George Gluck | 3,762 | 2 | |
| N/A | Others (write-in) | 140 | 0.1 | |
| Total votes | 190,536 | 100 | ||
| Democratic hold | ||||
2016
| Party | Candidate | Votes | % | |
|---|---|---|---|---|
| Democratic | John Delaney (Incumbent) | 185,770 | 56.0% | |
| Republican | Amie Hoeber | 133,081 | 40.1% | |
| Libertarian | David L. Howser | 6,889 | 2.1% | |
| Green | George Gluck | 5,824 | 1.8% | |
| Write-in | Ted Athey | 103 | 0.0% | |
| No party | Write-ins | 306 | 0.1% | |
| Total votes | 331,973 | 100 | ||
| Democratic hold | ||||
Historical district boundaries

See also
References
- ↑ "Partisan Voting Index – Districts of the 115th Congress" (PDF). The Cook Political Report. April 7, 2017. Retrieved April 7, 2017.
- ↑ The Historical cal Parties in Congress, p. 74
- ↑ Lazarick, Len (3 October 2012). "Maryland has least compact congressional districts in nation". MarylandReporter.com. Retrieved 7 October 2012.
- ↑ "Swing State Project: Presidential Results by Congressional District, 2000-2008". 16 October 2015. Archived from the original on 16 October 2015.
- ↑ "Daily Kos Elections 2008 & 2012 presidential election results for congressional districts used in 2012 & 2014 elections". Google Docs.
- ↑ Supreme Court will take up a second gerrymandering case this term (Washington Post)
- ↑ "Benisek v. Lamone". Brennancenter.org. Retrieved 2018-01-24.
- ↑ http://clerk.house.gov/member_info/electionInfo/1990election.pdf
- ↑ "92 PRESIDENTIAL and CONGRESSIONAL ELECTION STATISTICS". Office of the Clerk. Retrieved 2018-01-24.
- ↑ "94 CONGRESSIONAL ELECTION STATISTICS". Office of the Clerk. Retrieved 2018-01-24.
- ↑ "96 PRESIDENTIAL and CONGRESSIONAL ELECTION STATISTICS". Office of the Clerk. Retrieved 2018-01-24.
- ↑ "1998 Election Statistics - Legislative Activities". Office of the Clerk. Retrieved 2018-01-24.
- ↑ "2000 ELECTION STATISTICS". Office of the Clerk. Retrieved 2018-01-24.
- ↑ "2002 ELECTION STATISTICS". Office of the Clerk. Retrieved 2018-01-24.
- ↑ "2004 ELECTION STATISTICS". Office of the Clerk. Retrieved 2018-01-24.
- ↑ "2006 Election Statistics". Office of the Clerk. Retrieved 2018-01-24.
- ↑ "2008 Election Statistics". Office of the Clerk. Retrieved 2018-01-24.
- ↑ http://clerk.house.gov/member_info/electionInfo/2010election.pdf
- 1 2 "Unofficial 2012 Presidential General Election results for Representative in Congress". Maryland State Board of Elections. Retrieved Nov 12, 2012.
Bibliography
- Martis, Kenneth C. (1989). The Historical Atlas of Political Parties in the United States Congress. New York: Macmillan Publishing Company.
- Martis, Kenneth C. (1982). The Historical Atlas of United States Congressional Districts. New York: Macmillan Publishing Company.
- Congressional Biographical Directory of the United States 1774–present