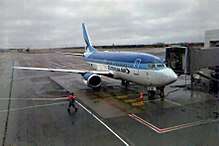
List of the busiest airports in the Baltic states
This is a list of the busiest airports in the Baltic states in terms of total number of Passengers, Aircraft movements and Freight and Mail Tonnes per year. The statistics includes all airports in the Baltic States with commercial regular traffic for 2012. Aircraft movements and Freight and Mail Tonnes only include statics for the 5 busiest airports in 2012 since reliable data is not available for all airports. Included are also a list of the Busiest Air Routes to/from and between the Baltic States for 2011, data for 2012 will be added as soon as the data becomes available.
The Baltic States

The term Baltic states (also Baltics, Baltic nations or Baltic countries) refers to the Baltic provinces which gained independence in 1918 from the German Empire during the World War I: primarily the contiguous trio of Estonia, Latvia, Lithuania (from north to south).
Passengers
| Rank | Country | Airport | 2017 | 2016 | 2015 | 2014 | 2013 | 2012 | 2011 | 2010 | 2009 | 2008 | 2007 | 2006 | 2005 | 2004 |
|---|---|---|---|---|---|---|---|---|---|---|---|---|---|---|---|---|
| 1. | Latvia | Riga International Airport | 6,097,765 | 5,402,545 | 5,162,675 | 4,814,073 | 4,793,213 | 4,767,764 | 5,106,692 | 4,663,647 | 4,066,854 | 3,690,549 | 3,160,945 | 2,495,020 | 1,878,035 | 1,060,426 |
| 2. | Lithuania | Vilnius International Airport | 3,761,837 | 3,814,001 | 3,336,084 | 2,942,670 | 2,661,869 | 2,208,096 | 1,712,467 | 1,373,859 | 1,308,632 | 2,048,439 | 1,717,222 | 1,451,468 | 1,281,872 | 964,164 |
| 3. | Estonia | Tallinn Airport | 2,648,361 | 2,203,536 | 2,166,663 | 2,017,291 | 1,958,801 | 2,206,791 | 1,913,172 | 1,384,831 | 1,346,236 | 1,811,536 | 1,728,430 | 1,541,832 | 1,401,059 | 997,941 |
| 4. | Lithuania | Kaunas International Airport | 1,186,081 | 740,448 | 747,284 | 724,314 | 695,509 | 830,268 | 872,618 | 809,732 | 456,698 | 410,165 | 390,881 | 248,228 | 77,350 | 27,113 |
| 5. | Lithuania | Palanga International Airport | 297,197 | 232,630 | 145,441 | 132,931 | 127,890 | 128,169 | 111,133 | 102,528 | 104,600 | 101,586 | 93,379 | 110,828 | 94,000 | 76,020 |
| 6. | Latvia | Liepaja International Airport | 4,780 | 0 | — | — | 0 | 0 | 0 | 0 | 2,051 | 44,705 | 32,039 | 1,572 | 1,026 | 1,512 |
2013 statistics
| Rank | Country | City | Airport | Code (IATA/ICAO) | Passengers (2013) | Change 2012–2013 |
|---|---|---|---|---|---|---|
| 1. | Latvia | Riga | Riga International Airport | RIX/EVRA | 4,793,213 | +0.6% |
| 2. | Lithuania | Vilnius | Vilnius International Airport | VNO/EYVI | 2,661,869 | +20.6% |
| 3. | Estonia | Tallinn | Lennart Meri Tallinn Airport | TLL/EETN | 1,958,801 | -11.2% |
| 4. | Lithuania | Kaunas | Kaunas International Airport | KUN/EYKA | 695,509 | -16.2% |
| 5. | Lithuania | Palanga | Palanga International Airport | PLQ/EYPA | 127,890 | -1.0% |
| 6. | Estonia | Tartu | Tartu Airport | TAY/EETU | 13,690 | -32.7% |
| 7. | Estonia | Kuressaare | Kuressaare Airport | URE/EEKE | 13,163 | |
| 8. | Estonia | Kärdla | Kärdla Airport | KDL/EEKA | 10,222 | |
| 9. | Estonia | Pärnu | Pärnu Airport | EPU/EEPU | 3,538 | |
| 10. | Estonia | Kihnu | Kihnu Airfield | ---/EEKU | 2,434 | -1.4% |
| 11. | Estonia | Ruhnu | Ruhnu Airfield | ---/EERU | 1,214 | |
2012 statistics
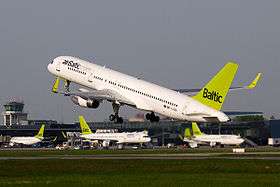
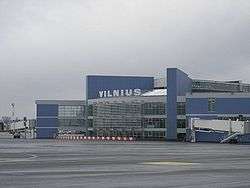
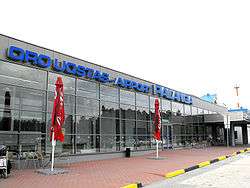


| Rank | Country | City | Airport | Code (IATA/ICAO) | Passengers (2012) | Change 2011–2012 |
|---|---|---|---|---|---|---|
| 1. | Latvia | Riga | Riga International Airport | RIX/EVRA | 4,767,878 | -6.6% |
| 2. | Lithuania | Vilnius | Vilnius International Airport | VNO/EYVI | 2,208,096 | +28.9% |
| 3. | Estonia | Tallinn | Lennart Meri Tallinn Airport | TLL/EETN | 2,206,692 | +15.3% |
| 4. | Lithuania | Kaunas | Kaunas International Airport | KUN/EYKA | 830,268 | -4.9% |
| 5. | Lithuania | Palanga | Palanga International Airport | PLQ/EYPA | 128,169 | +15.3% |
| 6. | Estonia | Tartu | Tartu Airport | TAY/EETU | 20,302 | +9.3% |
| 7. | Estonia | Kuressaare | Kuressaare Airport | URE/EEKE | 11,421 | -35.9% |
| 8. | Estonia | Kärdla | Kärdla Airport | KDL/EEKA | 9,700 | -9.3% |
| 9. | Estonia | Pärnu | Pärnu Airport | EPU/EEPU | 5,634 | -59.6% |
| 10. | Estonia | Kihnu | Kihnu Airfield | ---/EEKU | 2,474 | +7.9% |
| 11. | Estonia | Ruhnu | Ruhnu Airfield | ---/EERU | 1,364 | -7.0% |
Aircraft movements
2012 statistics
| Rank | Country | City | Airport | Code (IATA/ICAO) | Movements (2012) | Change 2011–2012 |
|---|---|---|---|---|---|---|
| 1. | Latvia | Riga | Riga International Airport | RIX/EVRA | 68,570 | -5.9% |
| 2. | Estonia | Tallinn | Lennart Meri Tallinn Airport | TLL/EETN | 48,531 | +20.4% |
| 3. | Lithuania | Vilnius | Vilnius International Airport | VNO/EYVI | 29,995 | +8.3% |
| 4. | Lithuania | Kaunas | Kaunas International Airport | KUN/EYKA | 8,559 | -5.1% |
| 5. | Lithuania | Palanga | Palanga International Airport | PLQ/EYPA | 3,047 | +2.9% |
Freight and Mail Tonnes
2012 statistics
| Rank | Country | City | Airport | Code (IATA/ICAO) | Cargo (2012) | Change 2011–2012 |
|---|---|---|---|---|---|---|
| 1. | Latvia | Riga | Riga International Airport | RIX/EVRA | 32,9531 | +160.2% |
| 2. | Estonia | Tallinn | Lennart Meri Tallinn Airport | TLL/EETN | 23,921 | +30.2% |
| 3. | Lithuania | Vilnius | Vilnius International Airport | VNO/EYVI | 5,927 | +2.5% |
| 4. | Lithuania | Kaunas | Kaunas International Airport | KUN/EYKA | 3,364 | -20.3% |
| 5. | Lithuania | Palanga | Palanga International Airport | PLQ/EYPA | 104 | +316.0% |
1 Note: Based on data published by State Joint Stock Company (SJSC) Riga International Airport of the Republic of Latvia which not yet has been compared by official data still to be published by European Commission Eurostat Regional Transport Statistics
Busiest Air Routes
Busiest nonstop air routes within and to/from the Baltic States based on total annually carried passengers on each route.
2011 statistics
The routes ranked no 1, 2, 5, 10, 11, 12, 14, 17 and 22 includes the following airports:
- No 1: London Stansted Airport and Gatwick Airport
- No 2: London Stansted Airport, London Luton Airport and Gatwick Airport
- No 5: Stockholm-Arlanda Airport and Stockholm-Skavsta Airport
- No 10: Gatwick Airport, London Stansted Airport and London Luton Airport
- No 11: Malpensa Airport and Orio al Serio Airport
- No 12: Brussels Airport and Brussels South Charleroi Airport
- No 14: Stockholm-Arlanda Airport and Stockholm-Skavsta Airport
- No 17: London Luton Airport and London Stansted Airport
- No 22: Oslo Airport, Gardermoen and Moss Airport, Rygge
| Rank | City 1 | City 2 | Passengers (2011) | Change 2010-2011 |
|---|---|---|---|---|
| 1. | Riga | London | 345,780 | +1.0% |
| 2. | Kaunas | London | 272,672 | +38.5% |
| 3. | Riga | Helsinki | 264,903 | +15.3% |
| 4. | Riga | Moscow | 226,481 | +24.1% |
| 5. | Riga | Stockholm | 215,592 | -3.3% |
| 6. | Riga | Vilnius | 191,977 | +22.5% |
| 7. | Riga | Oslo | 188,940 | +4.9% |
| 8. | Tallinn | Helsinki | 184,762 | +24.9% |
| 9. | Riga | Tallinn | 173,768 | +15.8% |
| 10. | Tallinn | London | 161,423 | +91.4% |
| 11. | Riga | Milan | 155,274 | +126.4% |
| 12. | Riga | Brussels | 152,362 | +0.4% |
| 13. | Vilnius | Frankfurt | 149,909 | +45.4% |
| 14. | Tallinn | Stockholm | 145,964 | +26.9% |
| 15. | Riga | Berlin | 143,658 | +7.4% |
| 16. | Riga | Copenhagen | 137,267 | +0.0% |
| 17. | Vilnius | London | 135,498 | +200.0% |
| 18. | Riga | Frankfurt | 133,210 | 6.3% |
| 19. | Tallinn | Copenhagen | 133,101 | -5.6% |
| 20. | Riga | Kiev | 123,834 | +41.9% |
| 21. | Riga | Dublin | 122,508 | -18.7% |
| 22. | Tallinn | Oslo | 121,184 | +40.9% |
| 23. | Vilnius | Copenhagen | 118,464 | -20.0% |
| 24. | Riga | Istanbul | 114,314 | +4.3% |
| 25. | Riga | Paris | 98,577 | +14.9% |
| 26. | Riga | Barcelona | 94,417 | +11.5% |
| 27. | Riga | Amsterdam | 92,647 | +34.3% |
| 28. | Riga | Rome | 89,809 | +9.8% |
| 29. | Riga | Saint Petersburg | 89,037 | +56.4% |
| 30. | Vilnius | Antalya | 86,550 | -4.2% |
See also
References
- State Joint Stock Company (SJSC) Riga International Airport of the Republic of Latvia
- Tallinn Airport Ltd
- State Enterprise Vilnius International Airport
- State Enterprise Kaunas International Airport
- State Enterprise Palanga International Airport
- European Commission Eurostat Regional Transport Statistics
