List of districts in Northern Ireland by national identity

This is a list of local government districts in Northern Ireland by national identity.
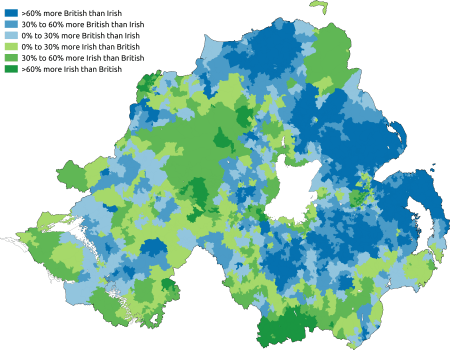
In 2011 the decennial UK Census asked respondents for the first time “How would you describe your national identity?” In Northern Ireland respondents were given a list of options (including British, Irish, and Northern Irish) from which they could choose as many as they wanted.
Irish national identity was numerically in a majority in two districts, Derry and Newry, where 55.03% and 52.09% respectively consider themselves as having an Irish national identity.[1] Whilst 45.14% of the population of Northern Ireland said that they were either Catholic or that they had been raised Catholic, only 28.35% described their nationality as Irish. In the Larne Borough Council area the percentage of Catholics was 24.87% and the figure for Irish nationality was 10.1%, meaning that no more (and almost certainly less) than 32.40% of Catholics described themselves as having an Irish nationality.[2]
British nationality was numerically in a majority in eleven districts. The fact that the overall number of people who described their nationality as British (48.41%) is very similar to the proportion who said that they were from a Protestant community background (48.36%) is not tantamount to proving that all Protestants see themselves primarily as British. In nine of Northern Ireland’s 26 council areas, British nationality was a higher proportion than the number of Protestants. For example, in the Down District Council the figure for British nationality (40.21%) is 123.38% of the figure for Protestants (32.08%), meaning that, even if every single Protestant were to have chosen a British nationality, a substantial amount of those choosing a British nationality were evidently not Protestant.
Northern Irish nationality was geographically evenly spread throughout the region. There was no strong correlation between Northern Irish nationality at local government level and religion or community background. For instance the two highest areas of Northern Irish national identity were Down (34.12%) and North Down (32.95%); the former being mostly Catholic (62.51%) and the latter being mostly Protestant (73.23%).
There was a British national identity majority or plurality over Irish nationality in 20 of the 26 council areas, and there was an Irish national identity majority or plurality over British national identity in 6 of the 26 council areas.
National Identity by District

| District | British | Irish | Northern Irish | English, Scottish or Welsh | All Other |
|---|---|---|---|---|---|
| Antrim | 55.2% | 20.1% | 30.4% | 2.3% | 3.9% |
| Ards | 73.6% | 7.5% | 31.9% | 1.9% | 1.5% |
| Armagh | 44.4% | 32.4% | 27.1% | 1.1% | 3.9% |
| Ballymena | 69.0% | 11.1% | 27.9% | 1.4% | 3.8% |
| Ballymoney | 60.6% | 16.4% | 30.9% | 1.7% | 1.7% |
| Banbridge | 61.1% | 16.2% | 31.8% | 1.5% | 1.8% |
| Belfast | 43.2% | 34.8% | 26.8% | 1.5% | 5.1% |
| Carrickfergus | 76.5% | 5.3% | 30.3% | 2.1% | 1.8% |
| Castlereagh | 66.2% | 14.7% | 31.3% | 1.5% | 2.6% |
| Coleraine | 62.4% | 14.5% | 31.6% | 2.0% | 3.2% |
| Cookstown | 37.3% | 33.5% | 32.1% | 1.2% | 3.7% |
| Craigavon | 48.3% | 25.6% | 28.7% | 1.4% | 6.4% |
| Derry | 23.7% | 55.0% | 24.6% | 1.4% | 2.0% |
| Down | 40.2% | 32.2% | 34.1% | 1.9% | 2.0% |
| Dungannon and South Tyrone | 30.9% | 38.8% | 27.1% | 0.9% | 9.6% |
| Fermanagh | 37.2% | 36.1% | 29.5% | 1.7% | 3.1% |
| Larne | 69.8% | 10.1% | 31.4% | 2.1% | 1.2% |
| Limavady | 42.2% | 32.0% | 30.7% | 1.5% | 1.4% |
| Lisburn | 55.6% | 24.7% | 28.7% | 2.0% | 2.4% |
| Magherafelt | 31.4% | 42.7% | 29.8% | 1.0% | 2.8% |
| Moyle | 38.6% | 34.1% | 32.1% | 2.2% | 1.4% |
| Newry and Mourne | 20.2% | 53.0% | 27.6% | 1.2% | 4.3% |
| Newtownabbey | 66.5% | 13.4% | 31.2% | 1.3% | 2.4% |
| North Down | 71.1% | 9.1% | 33.0% | 3.0% | 2.4% |
| Omagh | 28.6% | 40.9% | 32.7% | 1.1% | 3.4% |
| Strabane | 33.0% | 39.2% | 31.8% | 1.4% | 1.3% |
National identity by religion or religion brought up in for each district[3]
| District | Catholic | Protestant and other Christian | Other Religion or None | |||||||||
|---|---|---|---|---|---|---|---|---|---|---|---|---|
| British | Irish | Northern Irish | All Other | British | Irish | Northern Irish | All Other | British | Irish | Northern Irish | All Other | |
| Antrim | 23.1% | 43.7% | 34.2% | 7.1% | 80.6% | 3.1% | 27.8% | 3.3% | 60.4% | 6.5% | 26.8% | 19.0% |
| Ards | 34.1% | 31.7% | 38.2% | 6.4% | 80.9% | 3.7% | 30.4% | 2.2% | 67.7% | 6.0% | 35.1% | 9.1% |
| Armagh | 7.1% | 62.5% | 28.7% | 6.2% | 81.6% | 3.6% | 25.7% | 2.3% | 49.3% | 10.5% | 25.1% | 25.3% |
| Ballymena | 24.6% | 38.9% | 34.7% | 11.0% | 83.6% | 2.7% | 25.7% | 2.5% | 62.3% | 6.5% | 28.4% | 14.4% |
| Ballymoney | 19.0% | 44.5% | 38.8% | 4.1% | 81.1% | 2.9% | 27.2% | 2.2% | 65.1% | 8.4% | 28.0% | 13.3% |
| Banbridge | 22.6% | 41.7% | 39.4% | 4.5% | 81.2% | 3.8% | 27.7% | 2.0% | 59.1% | 8.3% | 33.8% | 11.5% |
| Belfast | 11.7% | 64.3% | 25.0% | 5.6% | 78.3% | 5.5% | 28.7% | 3.6% | 47.7% | 13.3% | 27.5% | 26.3% |
| Carrickfergus | 41.1% | 24.6% | 35.6% | 10.7% | 82.0% | 3.0% | 29.2% | 2.4% | 68.3% | 5.3% | 33.7% | 8.5% |
| Castlereagh | 22.1% | 50.0% | 34.5% | 6.3% | 81.3% | 3.9% | 29.9% | 2.3% | 61.9% | 8.9% | 33.7% | 11.8% |
| Coleraine | 25.0% | 39.2% | 36.5% | 8.4% | 79.1% | 4.3% | 29.3% | 2.6% | 56.5% | 10.3% | 33.4% | 16.8% |
| Cookstown | 8.1% | 53.8% | 37.7% | 5.2% | 82.5% | 3.6% | 24.0% | 2.1% | 44.2% | 9.1% | 24.4% | 31.5% |
| Craigavon | 12.2% | 51.2% | 31.5% | 10.6% | 82.5% | 3.2% | 26.3% | 2.7% | 49.9% | 9.1% | 26.7% | 26.4% |
| Derry | 7.3% | 70.5% | 24.3% | 2.5% | 76.7% | 7.2% | 25.9% | 3.5% | 39.4% | 24.7% | 21.9% | 26.2% |
| Down | 20.1% | 47.4% | 37.1% | 2.9% | 77.4% | 5.6% | 28.7% | 3.6% | 52.1% | 14.4% | 32.1% | 16.7% |
| Dungannon and South Tyrone | 5.7% | 57.6% | 28.6% | 13.0% | 79.6% | 4.5% | 24.5% | 3.0% | 33.3% | 12.0% | 22.8% | 42.1% |
| Fermanagh | 11.4% | 56.2% | 32.4% | 4.8% | 77.1% | 6.2% | 25.5% | 3.0% | 43.4% | 16.8% | 24.0% | 28.1% |
| Larne | 38.8% | 30.6% | 37.7% | 3.0% | 81.7% | 3.0% | 28.6% | 2.5% | 64.1% | 6.5% | 35.4% | 12.1% |
| Limavady | 18.1% | 50.5% | 34.4% | 2.5% | 79.8% | 4.1% | 24.9% | 2.5% | 51.4% | 10.9% | 28.8% | 18.7% |
| Lisburn | 16.5% | 58.6% | 27.8% | 4.3% | 80.2% | 4.7% | 29.0% | 3.2% | 62.2% | 8.8% | 30.3% | 13.9% |
| Magherafelt | 6.5% | 62.1% | 33.0% | 3.8% | 82.4% | 4.2% | 23.1% | 2.3% | 46.9% | 13.4% | 30.2% | 22.1% |
| Moyle | 14.6% | 53.1% | 35.3% | 2.8% | 76.3% | 5.0% | 27.8% | 3.3% | 49.4% | 17.8% | 23.8% | 19.8% |
| Newry and Mourne | 7.1% | 64.7% | 28.0% | 5.0% | 76.3% | 5.8% | 26.8% | 3.8% | 34.6% | 22.8% | 22.1% | 28.9% |
| Newtownabbey | 24.7% | 46.1% | 34.1% | 5.7% | 80.9% | 3.4% | 30.1% | 1.7% | 63.1% | 7.3% | 32.1% | 12.3% |
| North Down | 37.1% | 31.5% | 36.1% | 9.7% | 78.8% | 5.2% | 31.9% | 3.4% | 63.7% | 7.9% | 35.7% | 11.6% |
| Omagh | 8.7% | 55.7% | 36.0% | 4.4% | 78.5% | 4.9% | 25.0% | 2.5% | 40.6% | 15.9% | 23.7% | 28.9% |
| Strabane | 8.9% | 57.4% | 35.4% | 2.6% | 79.2% | 4.7% | 25.2% | 1.9% | 40.9% | 21.1% | 25.5% | 26.4% |
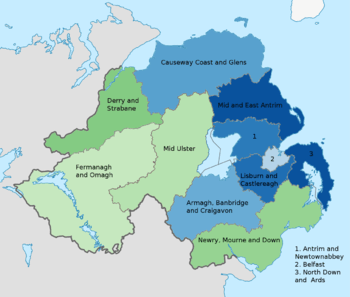
New districts, 2015
Following the reform of local government in Northern Ireland the twenty-six districts created in 1973 were replaced with eleven "super districts". The first election using these districts took place on 22 May 2014, electing councillors who sat in shadow form until 1 April 2015. The breakdown of national identity within these new boundaries at the time of the 2011 census was as follows.[4]
| District | British | Irish | Northern Irish | English, Scottish or Welsh | All Other |
|---|---|---|---|---|---|
| Antrim and Newtownabbey | 62.2% | 16.0% | 30.9% | 1.7% | 2.9% |
| Armagh, Banbridge and Craigavon | 50.5% | 25.2% | 28.9% | 1.3% | 4.6% |
| Belfast | 43.3% | 35.1% | 26.9% | 1.5% | 4.6% |
| Causeway Coast and Glens | 54.3% | 21.4% | 31.3% | 1.9% | 2.2% |
| Derry and Strabane | 26.2% | 50.8% | 26.5% | 1.4% | 1.8% |
| Fermanagh and Omagh | 33.3% | 38.3% | 31.0% | 1.4% | 3.2% |
| Lisburn and Castlereagh | 65.4% | 14.8% | 30.5% | 2.1% | 2.7% |
| Mid and East Antrim | 71.4% | 9.2% | 29.4% | 1.7% | 2.6% |
| Mid Ulster | 32.5% | 38.8% | 29.3% | 1.0% | 5.9% |
| Newry, Mourne and Down | 28.5% | 44.3% | 30.4% | 1.5% | 3.3% |
| North Down and Ards | 72.4% | 8.3% | 32.4% | 2.4% | 1.9% |
See also
- Demography of Northern Ireland
- Local Councils in Northern Ireland
- List of districts in Northern Ireland by population
- List of districts in Northern Ireland by area
- List of districts in Northern Ireland by religion or religion brought up in
- Census in the United Kingdom
- British people
- Irish people
- Northern Irish people
- Ulster Scots people
References
- ↑ Northern Ireland Statistics and Research Agency, 2011 UK Census, National Identity (Classification 2) http://www.ninis2.nisra.gov.uk/public/pivotgrid.aspx?dataSetVars=ds-2427-lh-38-yn-2011-sk-136-sn-Census+2011-yearfilter--
- ↑ Northern Ireland Statistics and Research Agency, 2011 UK Census, Religion or Religion Brought Up In http://www.ninis2.nisra.gov.uk/public/pivotgrid.aspx?dataSetVars=ds-2426-lh-38-yn-2011-sk-136-sn-Census+2011-yearfilter--
- 1 2 "Northern Ireland Neighbourhood Information Service". Retrieved 22 July 2014.
- ↑ "Northern Ireland Neighbourhood Information Service". Retrieved 25 July 2014.