List of countries by rail usage
This is a list of countries by rail usage. Rail usage may be measured in tonne-kilometres (tkm) or passenger-kilometres (pkm) travelled for freight and passenger transport respectively. This is the number of tonnes or passengers multiplied by the average distance of their journeys in kilometres.
Overview
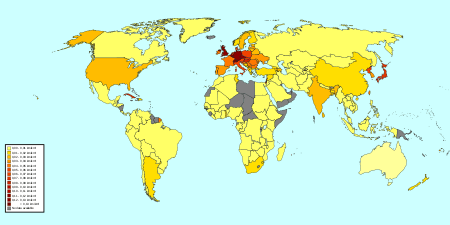
Almost 10,000 billion freight tonne-kilometres are travelled around the world. Roughly one quarter of these are travelled in the United States, another quarter in China, and a third in Russia. Of the 3,000bn passenger-kilometres travelled across the world, 1,346bn of these are travelled solely in China. The average Swiss person travels 2,430 km by train each year, almost 500 more than the average Japanese person (the Japanese having the second-highest average kilometres travelled per passenger in the world).
In 2014 there were around 1 million kilometres of railway in the world (a decrease of 3% compared to 2013). Of this, 350,000 km were in Europe and mainly used for passenger service, 370,000 km were in North America and mainly used for freight, and 230,000 km were in Asia and used for both freight and passenger service.[1] In America and Europe, there are many low cost airlines and motorways which compete with rail for passenger traffic, while Asia has seen a large growth in high-speed rail with 257bn pkm representing 72% of total world high-speed rail passenger traffic.[1]
Passenger rail
These figures do not include metro railway systems; see Lists of rapid transit systems for metro rail statistics.
Passenger-kilometres of rail transport per year
Countries with more than five billion passenger-kilometres (tkm) travelled per year. Unless otherwise specified, data come from the Railway Statistics 2015 Report by the International Union of Railways (UIC).
| Rank | Country/Region | Billion passenger-kilometres | Data year |
|---|---|---|---|
| 1 | 1,346[2] | 2017 | |
| 2 | 1,147 | 2015 | |
| 3 | 427[3] | 2015 | |
| 4 | 120.4 | 2014 | |
| 5 | 83.2 | 2015 | |
| 6 | 79.3 | 2015 | |
| 7 | 66.0[4] | 2016 | |
| 8 | 40.4 | 2015 | |
| 9 | 37.1 | 2015 | |
| 10 | 25.9 | 2015 | |
| 11 | 23.1 | 2015 | |
| 12 | 20.3 | 2015 | |
| 13 | 19.8 | 2015 | |
| 14 | 18.8 | 2015 | |
| 15 | 18.5 | 2015 | |
| 16 | 17.8 | 2015 | |
| 17 | 17.6 [5] | 2015 | |
| 18 | 16.3 | 2014 | |
| 19 | 16.6 | 2011 | |
| 20 | 11.6 | 2015 | |
| 21 | 10.3 | 2015 | |
| 22 | 10.3[note 1] | 2010 | |
| 23 | 7.2 | 2015 | |
| 24 | 7.5 | 2011 | |
| 25 | 7.3 | 2010 | |
| 26 | 7.2 | 2015 | |
| 27 | 6.3 | 2015 | |
| 28 | 4.8 | 2015 | |
| 29 | 6.0 | 2015 | |
| 30 | 5.7 | 2015 | |
| 31 | 5.3 | 2014 | |
| World | 2,954 | 2014 | |
| 583.7 | 2015 |
Passengers carried in rail transport per year
Countries with more than 20 million passengers per year. Unless otherwise specified, data come from the Railway Statistics 2015 Report by the International Union of Railways.
| Rank | Country | Million passengers | Data year | Notes |
|---|---|---|---|---|
| 1 | 9,090 | 2015 | ||
| 2 | 8,224 | 2015 | ||
| 3 | 2,007 | 2015 | ||
| 4 | 1,731 | 2016[6] | The London Underground ("The Tube") had an additional 1.34 billion passengers in 2015-16[7] | |
| 5 | 1,544 | 2015 | Beijing Metro alone had 3.41 billion passengers in 2014.[8] | |
| 6 | 1,123 | 2015 | ||
| 7 | 1,020 | 2015 | Moscow Metro alone had 2.45 billion passengers in 2014[9] | |
| 8 | 622 | 2015 | ||
| 9 | 571 | 2015 | ||
| 10 | 488 | 2015 | ||
| 11 | 399 | 2014 | ||
| 12 | 320 | 2015 | ||
| 13 | 280 | 2015 | Passengers carried by all rail passenger transport companies in Poland.[5] | |
| 14 | 277 | 2015 | ||
| 15 | 248 | 2015 | ||
| 16 | 232 | 2015 | ||
| 17 | 198 | 2008 | ||
| 18 | 192 | 2015 | ||
| 19 | 179 | 2016 | [10] | |
| 20 | 134 | 2015 | ||
| 21 | 132 | 2015 | ||
| 22 | 112 | 2015 | ||
| 23 | 92 | 2014 | ||
| 24 | 78 | 2014 | ||
| 25 | 64.6[11] | 2017 | Heavy rail only. The Jerusalem Light Rail had an additional 42.5 million passengers in 2017.[12] | |
| 26 | 61 | 2015 | ||
| 27 | 50 | 2017[13] | ||
| 28 | 40 | 2011 | ||
| 29 | 31 | 2015 | Amtrak had 30.8 million passengers in the year 2014-15.[14] Among regional systems that report to the American Public Transportation Association, there were 3.945 billion metro/subway riders, 529.6 million commuter rail riders, and 489.8 million light rail/streetcar riders in 2015.[15] | |
| 30 | 22 | 2015 | ||
| 31 | 20 | 2015 |
Passenger modal share for rail
The modal share of railway transport (excluding tram & metro) as compared to other modes of transport.
| Rank | Country | Modal share (%) | year |
|---|---|---|---|
| 1 | 30.5 | 2009[16] | |
| 2 | 17.2 | 2012[17] | |
| 3 | 11.5 | 2012[17] | |
| 4 | 10.1 | 2012[17] | |
| 5 | 10.1 | 2012[17] | |
| 6 | 9.6 | 2014[18] | |
| 7 | 9.5 | 2012[17] | |
| 8 | 9.1 | 2012[17] | |
| 9 | 9.0 | 2012[17] | |
| 10 | 8.8 | 2012[17] | |
| 11 | 8.4 | 2012[17] | |
| 12 | 8.0 | 2010[19] | |
| 13 | 7.1 | 2012[17] | |
| 14 | 7.1 | 2012[17] | |
| 15 | 6.3 | 2005[20] | |
| 16 | 6.1 | 2012[17] | |
| 17 | 5.6 | 2012[17] | |
| 18 | 5.3 | 2012[17] | |
| 19 | 5.0 | 2014[21] | |
| 20 | 4.9 | 2012[17] | |
| 21 | 4.8 | 2012[17] | |
| 22 | 4.8 | 2012[17] | |
| 23 | 4.7 | 2012[17] | |
| 24 | 4.6 | 2012[17] | |
| 25 | 4.1 | 2012[17] | |
| 26 | 3.5 | 2012[17] | |
| 27 | 2.8 | 2012[17] | |
| 28 | 2.3 | 2012[17] | |
| 29 | 1.8 | 2012[17] | |
| 30 | 1.7 | 2012[17] | |
| 31 | 1.5 | 2012[17] | |
| 32 | 0.8 | 2012[17] | |
| 33 | 0.7 | 2012[17] | |
| 34 | 0.3 | 2004[22] |
Passenger rail by passenger-kilometres per capita
Countries with more than five billion passenger-kilometres travelled per year.
| Country | Kilometers/year | Year |
|---|---|---|
| 2430.9 | 2013[23][24] | |
| 1,995 | ||
| 1,329 | ||
| 1,298[25] | 2014 | |
| 1,245 | ||
| 1,220 | ||
| 1,150 | ||
| 1,030 | ||
| 1,009 | ||
| 981[26] | 2015 | |
| 959[27] | 2014 | |
| 940 | ||
| 880 | ||
| 780 | ||
| 777 | ||
| 690 | ||
| 660 | ||
| 653 | ||
| 650 | ||
| 620 | ||
| 550 | ||
| 460 | ||
| 450 | ||
| 410 | ||
| 380 | ||
| 180 | ||
| 170 | ||
| 160 | ||
| 150 | ||
| 110 | ||
| 80 | ||
| 80 |
Freight rail
Tonne-kilometres of rail transport per year
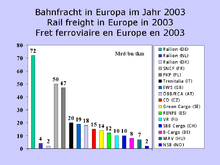
Countries with more than one billion tonne-kilometres (tkm) travelled per year. Unless otherwise specified, data come from the Railway Statistics 2014 Report by the International Union of Railways.
| Rank | Country | Billion tkm | Data year |
|---|---|---|---|
| 1 | 2,696[28] | 2017 | |
| 2 | 2,326[29] | 2016 | |
| 3 | 2,306[30] | 2015 | |
| 4 | 666 | 2014 | |
| 5 | 352 | 2011 | |
| 6 | 267 | 2014 | |
| — | 261 | 2014 | |
| 7 | 237 | 2011 | |
| 8 | 236 | 2012 | |
| 9 | 198[31] | 2008 | |
| 10 | 135 | 2014 | |
| 11 | 81[32] | 2014 | |
| 12 | 75 | 2014 | |
| 13 | 45 | 2014 | |
| 14 | 32 | 2014 | |
| 15 | 32 | 2014 | |
| 16 | 24.4[33] | 2014 | |
| 17 | 22 | 2012 | |
| 18 | 22 | 2013 | |
| 19 | 21.1[34] | 2014 | |
| 20 | 21[32] | 2014 | |
| 21 | 16 | 2014 | |
| 22 | 15 | 2014 | |
| 23 | 14 | 2014 | |
| 24 | 12 | 2010 | |
| 25 | 12 | 2012 | |
| 26 | 12 | 2009 | |
| 27 | 11 | 2014 | |
| 28 | 10 | 2013 | |
| 29 | 10 | 2014 | |
| 30 | 10 | 2014 | |
| 31 | 9.6[1] | 2014 | |
| 32 | 9 | 2014 | |
| 33 | 8 | 2014 | |
| 34 | 8 | 2014 | |
| 35 | 8 | 2010 | |
| 36 | 7 | 2010 | |
| 37 | 6[35] | 2013 | |
| 38 | 6 | 2011 | |
| 39 | 5 | 2014 | |
| 40 | 5 | 2012 | |
| 41 | 4[35] | 2013 | |
| 42 | 4 | 2009 | |
| 43 | 4 | 2012 | |
| 44 | 3 | 2011 | |
| 45 | 3 | 2014 | |
| 46 | 3 | 2011 | |
| 47 | 2 | 2014 | |
| 48 | 2 | 2014 | |
| 49 | 2[35] | 2013 | |
| 50 | 2 | 2010 | |
| 51 | 2 | 2010 | |
| 52 | 1.7 | 2014[36] | |
| 53 | 1.4 | 2016[37] | |
| 54 | 1 | 2012 | |
| 55 | 1 | 2011 |
Tonnes carried in rail transport per year
Countries with more than ten million tonnes carried per year. Unless otherwise specified, data come from the Railway Statistics 2014 Report by the International Union of Railways.
| Rank | Country | Million tonnes | Data year |
|---|---|---|---|
| 1 | 3,358[38] | 2015 | |
| 2 | 1,710 | 2011 | |
| 3 | 1,298[39] | 2014 | |
| 4 | 1,218[40] | 2015 | |
| 5 | 1,050[41] | 2014 | |
| 6 | 460 | 2014 | |
| 7 | 457 | 2011 | |
| 8 | 310 | 2011 | |
| 9 | 295 | 2012 | |
| 10 | 225 [42] | 2015 | |
| 11 | 221 | 2014 | |
| 12 | 197 | 2011 | |
| 13 | 141 | 2014 | |
| 14 | 110.1[43] | 2014 | |
| 15 | 105 | 2010 | |
| 16 | 82 | 2014 | |
| 17 | 74 | 2014 | |
| 18 | 65 [44] | 2015 | |
| 19 | 63 | 2011 | |
| 20 | 59 | 2014 | |
| 21 | 57 | 2014 | |
| 22 | 57 | 2014 | |
| 23 | 50[1] | 2014 | |
| 24 | 49 | 2014 | |
| 25 | 44 | 2014 | |
| 26 | 40 | 2013 | |
| 27 | 38 | 2014 | |
| 28 | 37 | 2014 | |
| 29 | 37 | 2009 | |
| 30 | 36 | 2014 | |
| 31 | 37 | 2011 | |
| 32 | 33 | 2013 | |
| 33 | 31 | 2010 | |
| 34 | 27 | 2012 | |
| 35 | 26 | 2014 | |
| 36 | 26 | 2012 | |
| 37 | 25 | 2014 | |
| 38 | 25 | 2013 | |
| 39 | 24 | 2010 | |
| 40 | 23 | 2012 | |
| 41 | 20 | 2012 | |
| 42 | 20 | 2010 | |
| 43 | 18 | 2011 | |
| 44 | 17 | 2014 | |
| 45 | 13 | 2014 | |
| 46 | 12 | 2011 | |
| 47 | 12 | 2014 | |
| 48 | 11 | 2012 | |
| 49 | 11 | 2011 | |
| 50 | 10 | 2014 | |
| 51 | 10 | 2012 |
Freight modal share for rail
The modal share carried by rail of all freight in a given country.
| Rank | Country | Modal share (%) | Data year |
|---|---|---|---|
| 1 | 68[45] | 2009 | |
| 2 | 61[46] | 2012 | |
| 3 | 59[45] | 2010 | |
| 4 | 47[46] | 2012 | |
| 5 | 46[23] | 2012 | |
| 6 | 44[45] | 2008 | |
| 7 | 41[46] | 2012 | |
| 8 | 40[46] | 2012 | |
| 9 | 40[47] | 2009 | |
| 10 | 38[46] | 2012 | |
| 11 | 31[45] | 2009 | |
| 12 | 31[48] | 2016 | |
| 13 | 27[46] | 2012 | |
| 14 | 25[49] | 2005 | |
| 15 | 24[46] | 2012 | |
| 16 | 23[46] | 2012 | |
| 17 | 22[46] | 2012 | |
| 18 | 21[46] | 2012 | |
| 19 | 20[46] | 2012 | |
| 20 | 18[46] | 2012 | |
| 21 | 18[46] | 2012 | |
| 22 | 15[46] | 2012 | |
| 23 | 14[46] | 2012 | |
| 24 | 12[46] | 2012 | |
| 25 | 9[46] | 2012 | |
| 26 | 6.2[45] | 2010 | |
| 27 | 5[46] | - | |
| 28 | 0.7[50] | 2007 | |
Freight rail by tonne-kilometres per capita
| Rank | Country | Tonne-kilometre per capita | Data year |
|---|---|---|---|
| 1 | 12,599 | ||
| 2 | 10,517 | ||
| 3 | 9,165 | ||
| 4 | 2,308 | ||
| 5 | 2,150 | ||
| 6 | 1,480[23][24] | 2013 | |
| 7 | 1,060 | ||
| 782 |
Brief railway statistics by country
| Country | area (million km2) | pop (million) | Rail company | Net km | Double km | Electrified km | HSR km | passenger-km | tonne-km | HS. PKm | Pass. modal % | Frt. modal % | Pass/ pop % | Elec % |
|---|---|---|---|---|---|---|---|---|---|---|---|---|---|---|
| 0.08 | 8.57 | OBB | ||||||||||||
| 8.54 | 209 | 29 | 0.5 | 232 | ||||||||||
| 9.6 | 1,382 | CR | 127 | 71 | 86 | 25 | 876 | 2764 | 68 | |||||
| 1 | 93 | ENR | 5 | 1.5 | 0.07 | 41 | 4 | 6.1 | ||||||
| 0.55 | 64 | SNCF | 29 | 16 | 14 | 1.8 | 81 | 40 | 48 | 16.8 | ||||
| 0.36 | 80.68 | DB | 34 | 18 | 20 | 1.2 | 74 | 91 | 22 | 10 | 17 | 22.4 | 60 | |
| 3.28 | 1,326 | IR | 63 | 17.4 | 17.8 | 696 | 481 | 5.5 | ||||||
| 1.6 | 80.04 | RAI | 7 | 1 | 0.15 | 0.25 | 13 | 21 | 0 | 4 | 7 | 0.3 | 1 | |
| 0.3 | 59 | FS | 16 | 7 | 12 | 0.82 | 45 | 21 | 9 | |||||
| 0.38 | 126 | JR | 20 | 8 | 12 | 2.5 | 253 | 23 | 79 | 29 | 69.6 | 100 | ||
| 2.72 | 17 | KTZ | 14 | 5 | 4 | 14 | 191 | |||||||
| 0.44 | 34 | ONCFM | 2 | 0.6 | 1 | 4 | 6 | 0.8 | 89 | |||||
| 0.04 | 17 | NS | 3.2 | 2.0 | 2.3 | 0.1 | 17.8 | 6 | 8.8 | 5 | 76.4 | |||
| .796 | 192 | PR | 7 | 0.3 | 26 | 6 | ||||||||
| 0.31 | 38 | PKP | 19 | 9 | 12 | |||||||||
| 17.09 | 143 | RZD | 128 | 36 | 48 | 1.3 | 173 | 2090 | 14 | 42 | 67 | 9.1 | 80 | |
| 1.22 | 54 | SAR | 24 | 2 | 8 | 14 | 109 | 11 | ||||||
| 0.1 | 50 | KNR | 3 | 1 | 2 | 0.32 | 32 | 11 | 10 | 20.4 | 20 | |||
| 0.51 | 46 | Renfe | 15 | 5 | 9 | 1.27 | 21 | 11 | 4 | |||||
| 0.041 | 8.38 | SBB | 4 | 2 | 3 | 15 | 13 | 40.9 | 100 | |||||
| 0.036 | 23 | TRA | 1 | 0.67 | 0.69 | 0.33 | 9 | 1 | ||||||
| 0.78 | 79 | TCDD | 9 | 04 | 1.9 | 0.25 | 6 | 10 | 24 | |||||
| 0.24 | 65 | NR | 16 | 5 | 0.3 | 48 | 21 | |||||||
| 9.6 | 324 | AMTK | 227 | 2820 | 42 | 1 | ||||||||
| World | 149 | 7,432 | United Nations | 900 | 250 | 240 | 9 | 2468 | 9486 | 178 | 10 | 20 | 50 |
See also
Notes
References
- 1 2 3 4 "Railway Statistics – 2014 Synopsis" (PDF). Paris, France: UIC (International Union of Railways). 2014. Retrieved November 8, 2015.
- ↑ "2017年12月份全国铁路主要指标完成情况-铁路-中华人民共和国交通运输部". www.mot.gov.cn.
- ↑ "Transport - Passenger transport - OECD Data". OECD.
- ↑ http://dataportal.orr.gov.uk/displayreport/report/html/34856085-cf9c-4e0d-a7f8-8f9e5ee1b772
- 1 2 Internet, JSK. "Passenger rail transport results 2015".
- ↑ "Passenger journeys by sector" (PDF). Retrieved 2 June 2016.
- ↑ "Facts & Figures". London: Transport for London.
- ↑ 北京市统计局 国家统计局北京调查总队 (2014-02-12). "北京市2014年国民经济和社会发展统计公报". Archived from the original on 2016-03-12. Retrieved 2015-02-12.
- ↑ "Moscow Metro in numbers".
- ↑ Statistická ročenka 2016 p. 522.
- ↑ Weissman, Shahar. "Annual Report, 2017" (PDF) (in Hebrew). Israel Railways. p. 22. Retrieved July 7, 2018.
- ↑ "ביצוע תקציב 2017" [Budget Report 2017] (PDF) (in Hebrew). Israel Ministry of Transport. 2018. Retrieved May 24, 2018.
- ↑ "50 Years of Reliable Rail in Thailand". GE Report.
- ↑ "Amtrak Ridership and Ticket Revenue Steady in Fiscal Year 2015" (PDF) (Press release). Amtrak.com. December 2, 2015. Retrieved January 10, 2016.
- ↑ "Ridership Report". American Public Transportation Association. Retrieved 2016-08-29.
- ↑ "Transport - Transport activity - Passenger transport". OECD Statistics (online statistics). OECD. 2009. Retrieved 2016-02-01.
- 1 2 3 4 5 6 7 8 9 10 11 12 13 14 15 16 17 18 19 20 21 22 23 24 25 26 27 28 "Modal split of inland passenger transport, 2002 and 2012". eurostat Statistics Explained. Retrieved February 1, 2016.
- ↑ "Rail modal share 1952-2014".
- ↑ "ANNEX to Proposal for a Regulation of the European Parliament and of the Council amending Regulation (EC) No 1370/2007 concerning the opening of the market for domestic passenger transport services by rail" (PDF) (COMMISSION STAFF WORKING DOCUMENT: IMPACT ASSESSMENT). Brussels: European Commission. 2013. p. 4. Archived from the original (PDF) on 2013-05-03. Retrieved 2016-02-01.
- ↑ "High Speed Train Project in Indonesia (Jakarta – Surabaya corridor)" (PDF). Ministry of Transportation. Archived from the original (PDF) on 2011-06-14.
- ↑ "UT Magazine: Transport of Russia". 2014. Archived from the original on 2016-08-26.
- ↑ "EU Transport in Figures; Statistical Pocketbook". European Commission Directorate-General for Energy and Transport; Eurostat. 2007. Archived from the original on 2008-06-01.
- 1 2 3 "Mobility and Transport: Pocket Statistics 2014" (PDF) (Official publication) (in English, German, French, and Italian). Switzerland: Federal Office for Statistics. July 30, 2013. Retrieved 14 October 2014.
- 1 2 "Mobility and Transport: Key figures" (web page) (in English, German, French, and Italian). Switzerland: Federal Office for Statistics. October 2014. Retrieved 2014-10-14.
- ↑ "Population of France 2014".
- ↑ "UK Passenger Rail Usage 2014-15" (PDF).
- ↑ "Population of Germany 2014". Using above table and population at July 2014
- ↑ "2017年12月份全国铁路主要指标完成情况-铁路-中华人民共和国交通运输部". www.mot.gov.cn.
- ↑ "Rail freight transportation - U.S. 2002-2016 | Statistic". Statista.
- ↑ "ЕМИСС".
- ↑ Bureau of Infrastructure, Transport and Regional Economics; Australian Railway Association (February 2010). "Australian rail freight performance indicators 2007–08" (PDF). bitre.gov.au. p. 38. Retrieved September 6, 2016.
- 1 2 "Key Transport Statistics 2014 Data" (PDF). Archived from the original (PDF) on 2015-09-22.
- ↑ "Freight Britain: Continuity and certainty for rail freight" (PDF). Rail Delivery Group. 2015. p. 3. Retrieved September 6, 2016.
- ↑ "Railway transport 2014, quarter 4" (PDF). Trafa.se (in Swedish). March 10, 2015. p. 8. Retrieved September 6, 2016.
- 1 2 3 "IRG–Rail 3rd Annual Market Monitoring Report 2014" (PDF). IRG-Rail. April 3, 2015. p. 31. Archived from the original (PDF) on April 3, 2016. Retrieved September 6, 2016.
- ↑ "The CEO Magazine – RVR achieves Net Ton per Kilometer (NTK) target". The CEO Magazine. March 6, 2015. Retrieved March 17, 2015.
- ↑ "Railway Services (2011 Classification)" (PDF). Israel Central Bureau of Statistics. August 30, 2017. Retrieved July 7, 2018.
- ↑ "国家铁路局". www.nra.gov.cn. Archived from the original on 2016-10-12. Retrieved 2016-09-30.
- ↑ Bureau of Infrastructure, Transport and Regional Economics; Australian Railway Association (November 2015). "Trainline 3, Statistical Report" (PDF). bitre.gov.au. p. 6. Retrieved September 6, 2016.
- ↑ "ЕМИСС".
- ↑ Ministry of Railways (India) (February 2015). "Indian Railways, Lifeline of the Nation" (PDF). indianrailways.gov.in. p. 6. Retrieved December 18, 2016.
- ↑ Internet, JSK. "Freight rail transport results 2015".
- ↑ Amusan, Folusho (May 21, 2015). "Freight Rail Usage 2014-15 Quarter 4 Statistical Release" (PDF). Office of Rail and Road. p. 10. Retrieved September 6, 2016.
- ↑ Rail Traffic 2015. Trafikanalys, page 25. Retrieved 2016-12-28.
- 1 2 3 4 5 OECD Competition Committee (2014). "Recent Developments in Rail Transportation Services" (PDF). The Organisation for Economic Co-operation and Development. p. 40. Retrieved September 6, 2016.
- 1 2 3 4 5 6 7 8 9 10 11 12 13 14 15 16 17 18 Statistics Explained (2012). "Freight transport statistics". European Commission. Retrieved May 29, 2015.
- ↑ Bureau of Infrastructure, Transport and Regional Economics (2009). "Road and rail freight: competitors or complements?" (PDF). bitre.gov.au. Retrieved February 4, 2016.
- ↑ Anirban Chowdhury (2016). "Railway Budget 2016: Suresh Prabhu announces measures for freight to increase modal share". Economic Times (India). Retrieved Dec 18, 2016.
- ↑ "Prices, Investment and Efficiency on the Railways" (PDF). The Department of Trade and Industry (Republic of South Africa). 2008. p. 134. Retrieved December 19, 2016.
- ↑ Derval Cummins, Booz and Company (2009). "Rail Freight in Ireland" (PDF). Engineers Ireland. p. 22. Retrieved December 18, 2016.
_(%25_of_total_inland_passenger-km)_YB15.png)