List of busiest railway stations in Great Britain
This is a list of the busiest railway stations in Great Britain on the National Rail network. The figures are collected by the Office of Rail and Road, and are estimates based on ticket usage data use of a Origin Destination Matrix, a comprehensive matrix of rail flows between stations throughout Great Britain in the financial year of 2016–17.[1] The data count entries and exits at any station. Only tickets sold for National Rail services are included. As such, London Underground, special tours, local light rail and heritage railway tickets are excluded. Note that these data cover Great Britain and surrounding small islands (such as the Isle of Wight), not the United Kingdom, and so exclude tickets within Northern Ireland and Eurostar. There are various further limits to the data due to the variety of ticketing options available on rail services within the UK; these are outlined in full in the report on the data.[2]
Only the top 30 stations are shown.
List
| Rank | Railway Station | Annual entries/exits (millions) 2016–17 |
Annual interchanges (millions) 2016–17 |
Location | Main Services | Number of platforms | Interchange systems | Image |
|---|---|---|---|---|---|---|---|---|
| 1 | London Waterloo | 99.403 | 6.105 | London | South Western Main Line West of England Main Line | 24 (has Platforms 25 and 26) | London Underground | 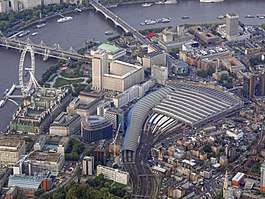 |
| 2 | London Victoria | 75.889 | 5.734 | London | Brighton Main Line Chatham Main Line | 19 | London Underground |  |
| 3 | London Liverpool Street | 67.339 | 2.745 | London | Great Eastern Main Line West Anglia Main Line | 18 | London Underground, London Overground, TfL Rail | 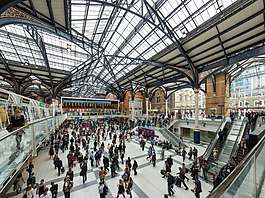 |
| 4 | London Bridge | 47.874 | 1.987 | London | South Eastern Main Line Brighton Main Line Thameslink | 15 | London Underground |  |
| 5 | London Euston | 44.059 | 3.517 | London | West Coast Main Line | 18 | London Underground, London Overground |  |
| 6 | Birmingham New Street | 42.367 | 5.791 | Birmingham | West Coast Main Line Cross Country Route | 13 | Midland Metro | 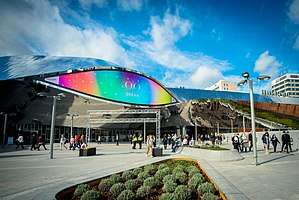 |
| 7 | Stratford | 42.251 | 3.873 | London | Great Eastern Main Line Lea Valley Lines | 21 (4 and 7 disused, 3A, 4A, 4B, and 10A exist) | London Underground, Docklands Light Railway, London Overground, TfL Rail |  |
| 8 | London Paddington | 35.836 | 2.976 | London | Great Western Main Line South Wales Main Line Reading to Plymouth Line | 14 (Platforms 15 and 16 exist) | London Underground | 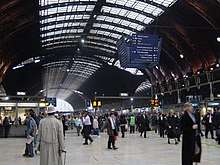 |
| 9 | London King's Cross | 33.816 | 3.473 | London | East Coast Main Line | 12 (starts at 0) | London Underground | 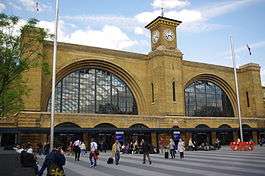 |
| 10 | London St Pancras International | 33.492 | 4.584 | London | Midland Main Line Thameslink Eurostar | 15 | London Underground | 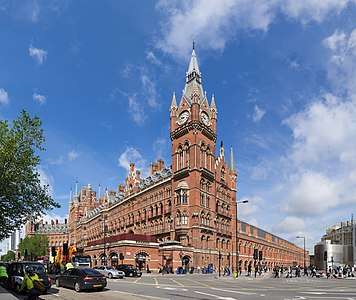 |
| 11 | Glasgow Central | 32.060 | 3.582 | Glasgow | West Coast Main Line | 17 | Glasgow Subway (close by) | 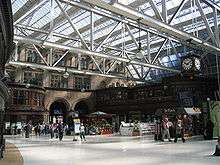 |
| 12 | Leeds | 30.943 | 3.131 | Leeds | East Coast Main Line Midland Main Line Cross Country Route | 17 |  | |
| 13 | Clapham Junction | 30.681 | 27.330 | London | South Western Main Line West of England Main Line Brighton Main Line | 17 | London Overground |  |
| 14 | Highbury and Islington | 29.853 | 3.837 | London | North London Line East London Line | 8 | London Underground, London Overground |  |
| 15 | London Charing Cross | 29.560 | 3.003 | London | South Eastern Main Line | 6 | London Underground |  |
| 16 | Manchester Piccadilly | 27.807 | 2.712 | Manchester | West Coast Main Line | 14 | Manchester Metrolink | 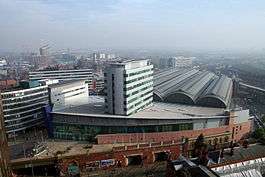 |
| 17 | Canada Water | 25.016 | <0.001 | London | East London Line | 4 | London Underground |  |
| 18 | London Cannon Street | 22.660 | 0.714 | London | South Eastern Main Line | 7 | London Underground | 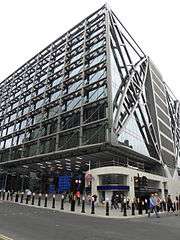 |
| 19 | East Croydon | 22.606 | 6.522 | London | Brighton Main Line | 6 | Croydon Tramlink |  |
| 20 | Edinburgh Waverley | 22.582 | 6.522 | Edinburgh | East Coast Main Line West Coast Main Line | 20 | Edinburgh Trams | 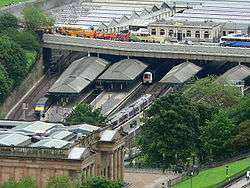 |
| 21 | Vauxhall | 22.483 | 0.000 | London | South Western Main Line | 8 | London Underground | 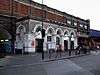 |
| 22 | Wimbledon | 20.150 | 1.206 | London | South Western Main Line | 10 | London Underground, Croydon Tramlink | 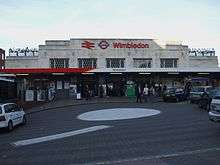 |
| 23 | Gatwick Airport | 19.362 | 1.188 | Gatwick Airport | Brighton Main Line Gatwick Express | 7 |  | |
| 24 | London Fenchurch Street | 18.526 | 1.086 | London | London, Tilbury & Southend Line | 4 | .jpg) | |
| 25 | Reading | 17.122 | 4.109 | Reading | Great Western Main Line | 15 |  | |
| 26 | London Marylebone | 16.667 | 0.637 | London | Chiltern Main Line | 6 | London Underground | 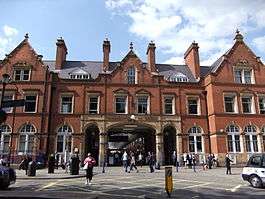 |
| 27 | Liverpool Central | 16.035 | 0.425 | Liverpool | Merseyrail services (Wirral and Northern lines) | 3 | .jpg) | |
| 28 | Brighton | 15.993 | 1.498 | Brighton | Brighton Main Line West Coastway Line | 8 | East Coastway Line | |
| 29 | Liverpool Lime Street | 15.613 | 1.104 | Liverpool | West Coast Main Line Liverpool to Manchester Lines | 10 | .jpg) | |
| 30 | Glasgow Queen Street | 20.550 | 2.070 | Glasgow | Glasgow to Edinburgh | 9 | Glasgow Subway (close by) | 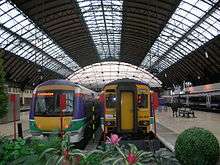 |
Below this, station usage was as follows:
- Whitechapel, Barking, Cardiff Central, Farringdon, Richmond, Cambridge, Bristol Temple Meads, Moorgate, Lewisham, West Ham, London Blackfriars and London Waterloo East reported over 10 million passengers.
- A further 56 stations had reported 5 to 10 million passengers
- 453 had reported passengers of 1–5 million
- 339 had reported passengers of 500,001–1 million
- 494 had reported passengers of 200,001–500,000
- 322 had reported passengers of 100,001–200,000
- 273 had reported passengers of 50,001–100,000
- 332 had reported passengers of 10,001–50,000
- 188 had reported passengers of 1,001–10,000
- 51 had reported passengers of 101–1,000
- In 2016-17, six stations: Reddish South (94), Kildonan (76), Redcar British Steel (50), Breich (48), Teesside Airport (30) and Barry Links (24) had reported fewer than 100 passengers.
London termini
This is a list of the busiest stations in the "London terminals" station group.
| Rank | Station | Annual entries/exits (millions) 2016–17 |
Annual interchanges (millions) 2016–17 |
|---|---|---|---|
| 1 | Waterloo | 99.403 | 6.106 |
| 2 | Victoria | 75.889 | 5.734 |
| 3 | Liverpool Street | 67.339 | 2.745 |
| 4 | London Bridge | 47.874 | 1.987 |
| 5 | Euston | 44.059 | 3.518 |
| 6 | Paddington | 35.836 | 2.976 |
| 7 | King's Cross | 33.816 | 3.473 |
| 8 | St Pancras International | 33.492 | 4.584 |
| 9 | Charing Cross | 29.560 | 3.003 |
| 10 | Cannon Street | 22.660 | 0.714 |
| 11 | Vauxhall | 22.483 | 0 |
| 12 | Fenchurch Street | 18.526 | 1.086 |
| 13 | Marylebone | 16.667 | 0.637 |
| 14 | Farringdon | 12.046 | 0.146 |
| 15 | Moorgate | 10.834 | 0.778 |
| 16 | Blackfriars | 10.576 | 0.830 |
| 17 | Waterloo East | 10.325 | 1.133 |
| 18 | City Thameslink | 6.339 | 0.012 |
| 19 | Kensington (Olympia) | 4.118 | 0.002 |
| 20 | Elephant & Castle | 2.997 | 0.296 |
Other London stations
This is a list of the busiest stations in Greater London, excluding those listed above under the London termini.
| Rank | Station | Annual entries/exits (millions) 2016–17 |
Annual interchanges (millions) 2016–17 |
|---|---|---|---|
| 1 | Stratford | 42.252 | 3.873 |
| 2 | Clapham Junction | 30.681 | 27.330 |
| 3 | Highbury & Islington | 29.853 | 3.837 |
| 4 | Canada Water | 25.016 | 0.001 |
| 5 | East Croydon | 22.606 | 6.522 |
| 6 | Wimbledon | 20.150 | 1.206 |
| 7 | Whitechapel | 14.128 | 0.000 |
| 8 | Barking | 12.787 | 0.549 |
| 9 | Richmond | 11.651 | 1.603 |
| 10 | Lewisham | 10.749 | 3.756 |
| 11 | West Ham | 10.630 | 0.009 |
| 12 | Surbiton | 9.377 | 0.730 |
| 13 | Putney | 8.868 | 0.000 |
| 14 | Romford | 8.834 | 0.766 |
| 15 | Balham | 8.751 | 0.401 |
| 16 | Bromley South | 8.532 | 1.001 |
| 17 | Ilford | 8.122 | 0.028 |
| 18 | Seven Sisters | 7.987 | 0.032 |
| 19 | Shepherd's Bush | 7.984 | 0.026 |
| 20 | Tottenham Hale | 7.939 | 0.367 |
Other stations in Great Britain
This is a list of the busiest stations in Great Britain outside London.
| Rank | Railway Station | Annual entries/exits (millions) 2016–17 |
Annual interchanges (millions) 2016–17 |
|---|---|---|---|
| 1 | Birmingham New Street | 42.367 | 5.791 |
| 2 | Glasgow Central | 32.060 | 3.542 |
| 3 | Leeds | 30.943 | 3.131 |
| 4 | Manchester Piccadilly | 27.807 | 2.712 |
| 5 | Edinburgh Waverley | 22.582 | 1.497 |
| 6 | Gatwick Airport | 19.362 | 1.188 |
| 7 | Reading | 17.122 | 4.109 |
| 8 | Liverpool Central | 16.035 | 0.425 |
| 9 | Brighton | 15.993 | 1.498 |
| 10 | Liverpool Lime Street | 15.613 | 1.104 |
| 11 | Glasgow Queen Street | 14.682 | 2.070 |
| 12 | Cardiff Central | 12.535 | 1.901 |
| 13 | Cambridge | 11.425 | 0.541 |
| 14 | Bristol Temple Meads | 11.337 | 1.513 |
| 15 | Sheffield | 9.538 | 1.054 |
| 16 | York | 9.264 | 1.449 |
| 17 | Manchester Oxford Road | 8.584 | 0.816 |
| 18 | Chelmsford | 8.537 | 0.057 |
| 19 | Newcastle | 8.427 | 0.409 |
| 20 | Watford Junction | 8.270 | 0.592 |
See also
References
- ↑ "Estimates of station usage". Office of Rail and Road. Retrieved 2018-03-21.
- ↑ "Estimates of Station Usage 2016-17" (PDF). Office of Rail and Road. 2017-12-01. Retrieved 2018-03-21.
External links
- Station usage - Main page