List of best-selling mobile phones
With over 4 decades on the market, mobile phones have become the most used electronic device in the world.[2] Below is a list of best-selling mobile phones, released between 1992 and 2017. The best-selling mobile devices are the Nokia 1100 and 1110, two bar phones released in 2003 and 2005, respectively. Both have sold over 250 million units. The best-selling touchscreen phones are the Apple iPhone 6 and 6 Plus, both released in 2014. Together, they have sold over 220 million units. The best-selling flip phone is the Motorola RAZR V3, released in 2004. It sold over 130 million units. The best-selling slider phone is the Samsung E250, released in 2006. It has sold over 30 million units.
Of the 40 phones on the list, Nokia sold the most models, with 15. In 2017, over 1.5 billion mobile phones were sold, with Samsung dominating yearly sales at over 321.2 million units sold, taking up 20.9% market share.
Top-selling mobile phones
| Manufacturer | Model | Form factor | Year | Graph (million units) | |
|---|---|---|---|---|---|
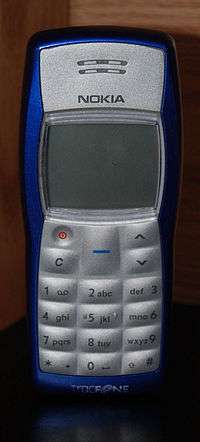
| Nokia | 1100 | Bar | 2003 | 250[1][3] | |
| Nokia | 1110 | Bar | 2005 | 250[1][3] | |
| Apple | iPhone 6 and iPhone 6 Plus | Touchscreen | 2014 | 220[3] | |
| Nokia | 3210 | Bar | 1999 | 160[3] | |
| Nokia | 1200 | Bar | 2007 | 150[3] | |
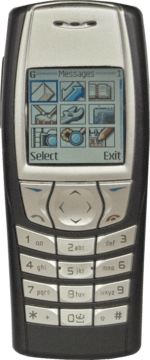
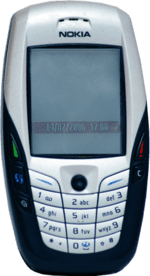
| Nokia | 6600 | Bar | 2003 | 150[3] | |
| Nokia | 5230 | Touchscreen | 2009 | 150[3] | |
| Samsung | E1100 | Bar | 2009–12 | 150[3] | |
| Nokia | 2600 (2610/2626/2630) | Bar | 2004 | 135[3] | |
| Motorola | RAZR V3 | Flip phone | 2004 | 130[3] | |
| Nokia | 1600 (1650/1661) | Bar | 2006 | 130[3] | |
| Nokia | 3310 (3330) | Bar | 2000 | 126[3][4] | |
| Nokia | 1208 (1209) | Bar | 2007 | 100[3] | |
| Samsung | Galaxy S4 | Touchscreen | 2013 | 80[3] | |
| Nokia | 6010 (6020/6030) | Bar | 2004 | 75[3] | |
| Apple | iPhone 5 | Touchscreen | 2012–13 | 70[3] | |
| Nokia | 5130 (5220/5310) | Bar | 2007-09 | 65[3] | |
| Apple | iPhone 4S | Touchscreen | 2011–14 | 60[3][5] | |
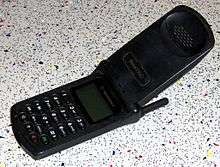
| Motorola | StarTAC | Flip phone | 1996 | 60[3][6] | |
| Motorola | C200 | Bar | 2003–06 | 60[6] | |
| Samsung | Galaxy S III | Touchscreen | 2012–13 | 60[3] | |
| Motorola | C139 | Bar | 2005 | 60[5] | |
| Samsung | Galaxy S7 and Galaxy S7 edge | Touchscreen | 2016 | 55[7] | |
| Nokia | 6230 (6233) | Bar | 2004 | 50[6] | |
| Apple | iPhone 4 | Touchscreen | 2010–13 | 50[5] | |
| Nokia | 3100 (3120) | Bar | 2003 | 50[6] | |
| Samsung | Galaxy S II | Touchscreen | 2011–12 | 40[6] | |
| Apple | iPhone 7 and iPhone 7 Plus | Touchscreen | 2016 | 38.9[8] | |
| Apple | iPhone 3GS | Touchscreen | 2009–12 | 35[6] | |
| Nokia | 2650 | Flip phone | 2004 | 35[6] | |
| Samsung | Galaxy Note II | Touchscreen | 2012–13 | 30[9] | |
| Samsung | E250 | Slider | 2006 | 30[5] | |
| Samsung | Galaxy S | Touchscreen | 2010–12 | 25[10] | |
| Samsung | Galaxy S8 | Touchscreen | 2017 | 20[11] | |
| HTC | Thunderbolt | Touchscreen | 2011–12 | 16[5] | |
| Sony Ericsson | K300 | Bar | 2004 | 15[5] | |
| Sony Ericsson | K750 | Bar | 2005 | 15[5] | |
| Research In Motion (RIM) | BlackBerry Pearl | Bar | 2006 | 15[5] | |
| Motorola | Droid Bionic | Touchscreen | 2011 | 13[5] | |
| Samsung | Galaxy S5 | Touchscreen | 2014 | 12[12] | |
Annual best-selling handsets
Note: The years represent when the phones were released into the market, not the number sold in that particular year. The number sold represents how many units were sold throughout its whole lifetime. The first cell phone was produced by Motorola. Since then there have been produced around 17.37 billion mobile phones.

1992
- Motorola Personal Phone, 8 million sold
1996
- Nokia 1610, 100 million sold
- Motorola StarTAC, 60 million sold
1998
- Nokia 6120, 22 million sold
1999
- Nokia 3210, 150 million sold
2000
- Nokia 3310, 126 million sold
- Nokia 8890, 15 million sold
- Siemens M30/M35i, 15 million sold
2002
- Nokia 6100, 15 million sold
- Nokia 6610, 15 million sold
- Nokia 3510, 15 million sold
- Siemens A50, 15 million sold
- Samsung SGH-T100, 12 million sold
2003
- Nokia 1100, 250 million sold[1]
- Nokia 3100/3120, 50 million sold
- Nokia 3200/3220, 30 million sold
- Nokia 2100, 20 million sold
- Samsung SGH-E700, 15 million sold
- Nokia N-Gage, 3 million sold
- Nokia 6600, 2 million sold
2004
- Nokia 2600/2610/2626/2630, 135 million sold
- Motorola RAZR V3, 130 million sold
- Nokia 6010/6020/6030, 75 million sold
- Nokia 6230/6233, 50 million sold
- Nokia 3220, 35 million sold
- Nokia 2650, 35 million sold
- Nokia 3120, 15 million sold
- Nokia 6170, 15 million sold
- Nokia 5140, 15 million sold
- Nokia 7260, 15 million sold
- Sony Ericsson K300, 15 million sold
- Samsung SGH-D500, 12 million sold
2005
- Nokia 1110, 250 million sold[1]
- Motorola/C139/C200, 60 million sold
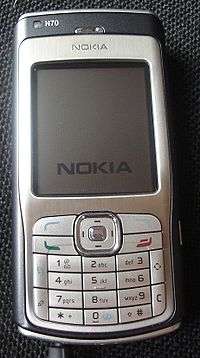
- Nokia N70/N72/N73, 45 million sold
- Nokia 6101, 35 million sold
- Nokia 6060, 35 million sold
- Nokia 6270/6280, 30 million sold
- Nokia 6670, 19 million sold
- Motorola V220, 15 million sold
- Motorola V195, 15 million sold
- Sony Ericsson J300, 15 million sold
- Sony Ericsson K750, 15 million sold
- Nokia 6680, 15 million sold
- Nokia 8800, 15 million sold
- Nokia 6111, 15 million sold
- Nokia 2680, 15 million sold
- LG Chocolate, 15 million sold
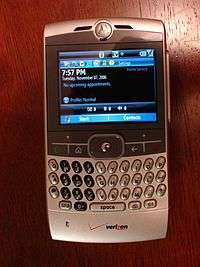
- Motorola Q, 1 million sold
2006
- Nokia 1600/1650/1661, 130 million sold worldwide
- Nokia 6070/6080, 50 million sold
- Nokia 7360/7370/7380, 45 million sold
- Nokia 6300, 35 million sold
- Nokia 2310, 35 million sold
- Nokia 5200/5300, 30 million sold
- BlackBerry Pearl 8100, 15 million sold
- BenQ-Siemens S68, 15 million sold
- Sony Ericsson K310, 15 million sold
- Sony Ericsson W810, 15 million sold
- Sony Ericsson W300, 15 million sold
- Motorola PEBL U6, 15 million sold
- Motorola KRZR K1, 15 million sold
- Motorola SLVR L6, 15 million sold
- Motorola SLVR L7, 15 million sold
- Nokia 6085, 15 million sold
- Nokia 6125, 15 million sold
- Nokia 6131, 15 million sold
- Samsung SGH-D900, 3 million sold
- Nokia 3250, 1 million sold
2007
.jpg)
- Nokia 2600 classic, 15 million sold
- Nokia 2760, 15 million sold
- Nokia 5610, 15 million sold
- Nokia 3110 classic, 15 million sold
- Nokia 6500 Slide, 15 million sold
- Nokia 3500, 15 million sold
- Nokia 6500 classic, 15 million sold
- Samsung SGH-E250, 12 million sold
- LG Shine, 8 million sold[5]
- Nokia N95, 7 million sold
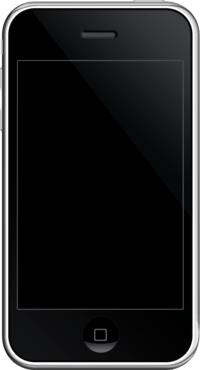
- Apple iPhone, 7 million sold
- LG Viewty (KU990), 2 million sold
- HTC Touch, 2 million sold
- Palm Centro, 2 million sold
2008
- Apple iPhone 3G, 25 million sold
- Nokia 2330 classic, 15 million sold
- Nokia 7210 Supernova, 15 million sold
- Nokia 5800 XpressMusic, 15 million sold
- Nokia 5000, 15 million sold
- Nokia E71, 15 million sold
- Samsung Tocco (SGH-F480), 12 million sold
- Samsung SGH-J700, 12 million sold
- Samsung Tocco TouchWiz (SGH-F480), 5 million sold
- Samsung Soul (SGH-U900), 1 million sold
2009
- Nokia 5230, 159 million sold
- Apple iPhone 3GS, 35 million sold
- Samsung Tocco Ultra (S8300), 12 million sold
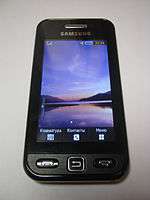
- Samsung Star/Tocco Lite (S5230), 10 million sold
- LG Cookie (KP500), 10 million sold
- Alcatel One Touch Mini (OT-708), 5 million sold
- Motorola Ming A1200, 3 million sold
- Nokia N97, 2 million sold
- Motorola Milestone/Droid, 1 million sold
- HTC Magic, 1 million sold
2010
- Apple iPhone 4, 40 million sold[13]
- Samsung Galaxy S, 20 million sold[14]
- Samsung S5620 Monte, 7 million sold
- Nokia N8, 6 million sold
- Motorola Milestone/Droid, 2 million sold
- Samsung Wave (S8500), 2 million sold
2011
- Samsung Galaxy S II, 40 million sold
- Apple iPhone 4s,16.4 million sold
- Samsung Galaxy Y, 15 million sold
- HTC Evo 4G, 14 million sold
- Motorola Droid Bionic, 13 million sold
- ZTE Blade, 10 million sold
- Samsung Infuse, 9 million sold
2012
- Samsung Galaxy S III, 70 million sold
- Xiaomi Mi 2, 10 million sold[15]
2013
2014
2016
- iPhone 7, 50.8 million sold[18]
- Samsung Galaxy S7, 55 million sold[19]
- Redmi note 3
- OnePlus 3t
- Redmi 3s prime
- Lenovo K4 note
Annual sales by manufacturer
1992
1993
- Nokia: 5 million sold
1994
- Motorola 12 million sold
- Nokia: 9 million sold
- NEC: 6 million sold
1995
- Nokia: 13 million sold
1996
1997
- Motorola: 25.328 million sold
- Nokia: 20.593 million sold
- Ericsson: 15.914 million sold
- Panasonic: 8.627 million sold
- Alcatel: 2.631 million sold
- Others: 34.725 million sold
1998
1999
- Nokia: 76.335 million sold
- Motorola: 47.817 million sold
- Ericsson: 29.785 million sold
- Samsung: 17.686 million sold
- Panasonic: 15.580 million sold
- Others: 98 million sold
2000
- Nokia: 126.369 million sold
- Motorola: 60.094 million sold
- Ericsson: 41.467 million sold
- Siemens: 26.989 million sold
- Samsung: 20.639 million sold
- Others: 140 million sold
2001
- Nokia: 139.672 million sold[26]
- Motorola: 59.097 million sold
- Siemens: 29.753 million sold
- Samsung: 28.234 million sold
- Ericsson: 26.956 million sold
- Others: 115.877 million sold
2002
- Nokia: 151.4218 million (35.8% market share)
- Motorola: 64.6401 million (15.3% market share)
- Samsung: 41.6844 million (9.8% market share)
- Siemens: 34.6180 million (8.2% market share)
- Sony Ericsson: 23.1129 million (5.5% market share)
- Others: 107.9414 million (25.5% market share)
- Total: 423.4185 million (100% market share)
2003
- Nokia: 180.6724 million (34.7% market share)
- Motorola: 75.1771 million (14.5% market share)
- Samsung: 54.4751 million (10.5% market share)
- Siemens: 43.7543 million (8.4% market share)
- Sony Ericsson: 26.6863 million (5.1% market share)
- LG: 26.2137 million (5.0% market share)
- Others: 113.0096 million (21.8% market share)
- Total: 519.9855 million (100% market share)
2004
- Nokia: 207.2313 million (30.7% market share)
- Motorola: 104.1242 million (15.4% market share)
- Samsung: 85.2384 million (12.6% market share)
- Siemens: 48.4558 million (7.2% market share)
- LG: 42.2768 million (6.3% market share)
- Sony Ericsson: 42.0317 million (6.2% market share)
- Others: 144.6437 million (21.6% market share)
- Total: 674.0019 million (100% market share)
2005
- Nokia: 265.6148 million (32.5% market share)
- Motorola: 144.9204 million (17.7% market share)
- Samsung: 103.7536 million (12.7% market share)
- LG: 54.9246 million (6.7% market share)
- Sony Ericsson: 51.7738 million (6.3% market share)
- Siemens: 28.5906 million (3.5% market share)
- Others: 166.9851 million (20.6% market share)
- Total: 816.5629 million (100% market share)
2006
- Nokia: 344.9159 million (34.8% market share)
- Motorola: 209.2509 million (21.1% market share)
- Samsung: 116.4801 million (11.8% market share)
- Sony Ericsson: 73.6416 million (7.4% market share)
- LG: 61.9860 million (6.3% market share)
- Others: 184.5880 million (18.6% market share)
- Total: 990.8625 million (100% market share)
2007
- Nokia: 435.4531 million (37.8% market share)
- Motorola: 164.307 million (14.3% market share)
- Samsung: 154.5407 million (13.4% market share)
- Sony Ericsson: 101.3584 million (8.8% market share)
- LG: 78.5763 million (6.8% market share)
- Apple: 2.3 million sold[33]
- Others: 218.6043 million (18.9% market share)
- Total: 1,152.8398 million (100% market share)
2008
- Nokia: 472.3150 million (38.6% market share)
- Samsung: 199.1820 million (16.3% market share)
- Motorola: 106.5900 million (8.7% market share)
- LG: 102.5554 million (8.4% market share)
- Sony Ericsson: 93.4145 million (7.6% market share)
- Apple: 12 million sold[35]
- Others: 248.1890 million (20.4% market share)
- Total: 1,222.2452 million (100% market share)
2009
- Nokia: 440.8816 million (36.4% market share)
- Samsung: 235.7720 million (19.5% market share)
- LG: 122.0553 million (10.1%market share)
- Motorola: 58.4752 million (4.8% market share)
- Sony Ericsson: 54.8734 million (4.5% market share)
- Apple: 24.889 million sold[37]
- Others: 299.1792 million (24.7% market share)
- Total: 1,211.2366 million (100% market share)
2010
- Nokia: 461.3182 million (28.9% market share)
- Samsung: 281.0658 million (17.6% market share)[39]
- LG: 114.1546 million (7.1% market share)
- Research in Motion: 47.4516 million (3.0% market share)
- Apple: 46.5983 million (2.9% market share)[13][40]
- Sony Ericsson: 41.8192 million (2.6% market share)
- Motorola: 38.5537 million (2.4% market share)
- ZTE: 28.7687 million (1.8% market share)[41]
- HTC: 24.6884 million (1.5% market share)
- Huawei: 23.8147 million (1.5% market share)
- Others: 488.5693 million (30.6% market share)
- Total: 1,596.8024 million (100% market share)
2011
- Nokia: 422.4783 million (23.8% market share)
- Samsung: 313.9042 million (17.7% market share)[43]
- Apple: 89.2632 million (5.0% market share)
- LG: 86.3709 million (4.9% market share)
- ZTE: 56.8818 million (3.2% market share)[44]
- Research in Motion: 51.5419 million (2.9% market share)
- HTC: 43.2669 million (2.4% market share)
- Huawei: 40.6634 million (2.3% market share)
- Motorola: 40.2690 million (2.3% market share)
- Sony Ericsson: 32.5975 million (1.8% market share)
- Others: 597.3269 million (33.7% market share)
- Total: 1,774.5641 million (100% market share)
2012
- Samsung: 384.6312 million (22.0% market share)
- Nokia: 333.9380 million (19.1% market share)
- Apple: 130.1332 million (7.5% market share)
- ZTE: 67.3444 million (3.9% market share)
- LG: 58.0159 million (3.3% market share)
- Huawei Technologies: 47.2883 million (2.7% market share)
- TCL Communication: 37.1766 million (2.1% market share)
- Research in Motion: 34.2103 million (2.0% market share)
- Motorola: 33.9163 million (1.9% market share)
- HTC: 32.1218 million (1.8% market share)
- Others: 587.3996 million (33.6% market share)
- Total: 1,746.1756 million (100% market share)
2013
.png)
- Samsung: 444.4442 million (24.6% market share)
- Nokia: 250.7931 million (13.9% market share)
- Apple: 150.7859 million (8.3% market share)
- LG: 69.0245 million (3.8% market share)
- ZTE: 59.8988 million (3.3% market share)
- Huawei: 53.2951 million (2.9% market share)
- TCL Communication: 49.5313 million (2.7% market share)
- Lenovo: 45.2847 million (2.5% market share)
- Sony Mobile Communications: 37.5957 million (2.1% market share)
- Yulong: 32.6014 million (1.8% market share)
- Others: 613.7100 million (34% market share)
- Total: 1,806.9647 million (100% market share)
2014
- Samsung: 392.546 million (20.9% market share)
- Apple: 191.426 million (10.2% market share)
- Microsoft: 185.660 million (9.9% market share)
- Lenovo Motorola: 84.029 million (4.5% market share)
- LG: 76.096 million (4% market share)
- Huawei: 70.499 million (3.8% market share)
- TCL Communication: 64.026 million (3.4% market share)
- Xiaomi: 56.529 million (3% market share)
- ZTE: 53.910 million (2.9% market share)
- Sony Mobile: 37.791 million (2% market share)
- Micromax: 37.094 million (2% market share)
- Others: 629.360 million (33.5% market share)
- Total: 1,878.968 million (100% market share)
2015
Note that previous years have listed sales of mobile phones including non smartphones (so called feature phones) while from 2015 and on the statistics only show smartphone sales.
- Samsung: 320.4 million (22.5% market share)
- Apple: 225.8506 million (15.9% market share)
- Huawei: 104.0947 million (7.3% market share)
- Lenovo: 72.7482 million (5.1% market share)
- Xiaomi: 65.6186 million (4.6% market share)
- Others: 635.3685 million (44.6% market share)
- Total: 1423.9003 million (100% market share)
2016
- Samsung: 306.4466 million (20.5% market share)
- Apple: 216.0640 million (14.4% market share)
- Huawei: 132.8249 million (8.9% market share)
- OPPO: 85.2995 million (5.7% market share)
- BBK Communication Equipment: 72.4086 million (4.8% market share)
- Others: 682.3143 million (45.6% market share)
- Total: 1,495.3580 million (100% market share)
2017
- Samsung: 321.2633 million (20.9% market share)
- Apple: 214.9244 million (14% market share)
- Huawei: 150.5343 million (9.8% market share)
- OPPO: 112.124 million (7.3% market share)
- Vivo: 99.6848 million (6.5% market share)
- Others: 638.0047 million (41.5% market share)
- Total: 1,536.5355 million (100% market share)
References
- 1 2 3 4 5 "Top 10 Best Selling Nokia Phones". Techpinas. Archived from the original on December 22, 2015. Retrieved December 21, 2015.
- ↑ Tsirulnik, Giselle. "Mobile phone ranked most used electronic device: Forrester". Mobile Marketer. Retrieved August 5, 2018.
- 1 2 3 4 5 6 7 8 9 10 11 12 13 14 15 16 17 18 19 20 "The 20 bestselling mobile phones of all time". The Telegraph. August 6, 2017. Archived from the original on July 15, 2017. Retrieved August 12, 2017.
- ↑ "Nokia Introduces Nokia 2652 (Section: 'Hitler Facts / "Did You Know?"')" (Press release). Nokia. July 20, 2011. Archived from the original on September 16, 2013. Retrieved September 5, 2013.
... the Nokia 3310 / 3330 sold 162 million units from its launch in 2000 until its "retirement"...
- 1 2 3 4 5 6 7 8 9 10 "20 of the world's top selling phones". ZDNet. December 9, 2013. Archived from the original on December 23, 2016. Retrieved August 12, 2017.
- 1 2 3 4 5 6 7 Edmonds, Rich (April 4, 2013). "40 years have passed for mobile phones and Nokia dominates bestsellers list". Windows Central. Retrieved August 12, 2017.
- ↑ "Samsung Galaxy S7 sales hit 55 million". gsmarena. Archived from the original on May 3, 2017. Retrieved May 11, 2017.
- ↑ Evans, Jonny. "Apple's iPhone 7 is best-selling, and iPhone 6S most used, analysts claim". Computer World. Archived from the original on June 28, 2017. Retrieved August 12, 2017.
- ↑ "Samsung GALAXY Note II sells 30 million units". October 2, 2013. Archived from the original on November 5, 2015. Retrieved August 12, 2017.
- ↑ "Samsung Galaxy S Range Sells Over 100 Million Units". Retrieved August 12, 2017.
- ↑ Bennett, Brian. "Samsung Galaxy S8 Shipped Over 20 Million Units Since Launch: Report". Retrieved August 3, 2017.
- ↑ "Galaxy S5 sold 40 percent fewer units than Samsung predicted: WSJ". The Verge. Archived from the original on April 20, 2016. Retrieved May 3, 2016.
- 1 2 Oct 18, 2010 (October 18, 2010). "Apple Q4 2010: Record Quarter/Year, Surprises to Come — Apple News, Tips and Reviews". Gigaom.com. Archived from the original on July 14, 2014. Retrieved August 8, 2012.
- ↑ Jan 14, 2013 (January 14, 2013). "Samsung Galaxy S sales to 100 million". bgr.com. Archived from the original on January 16, 2013. Retrieved January 14, 2013.
- ↑ "Xiaomi Mi2 sold 10 million units in 11 months". Tech in Asia. Archived from the original on November 12, 2014.
- ↑ Moon, Mariella. "Samsung sold over 40 million Galaxy S 4s in six months". Engadget. AOL. Archived from the original on October 26, 2013.
- 1 2 3 "Gartner Says Annual Smartphone Sales Surpassed Sales of Feature Phones for the First Time in 2013". Gartner. February 2014. Archived from the original on February 14, 2014. Retrieved February 13, 2014.
- ↑ Silver, Curtis. "Apple Takes A Hit On iPhone 7 Sales, iPhone 8 May Be Worth Waiting For". forbes.com. Retrieved September 16, 2017.
- ↑ "Analysts estimate Samsung Galaxy S8 sales about 20% lower than the S7". 9to5google.com. July 11, 2017. Retrieved September 16, 2017.
- ↑ Archived July 4, 2008, at the Wayback Machine.
- ↑ "Best-Selling Mobile Phones Worldwide All Time". StatsMonkey.com. February 8, 1999. Archived from the original on January 24, 2016. Retrieved September 6, 2015.
- ↑ "Nokia Annual Report 1998" (PDF). Archived (PDF) from the original on November 4, 2013. Retrieved November 8, 2012.
- 1 2 "GartnerGroup's Dataquest Says Nokia Became No. 1 Mobile Phone Vendor in 1998". Tech Insider. Business Insider. February 8, 1999. Archived from the original on January 24, 2016. Retrieved September 11, 2015.
- ↑ "Nokia overtakes Motorola". CNN. February 8, 1999. Archived from the original on January 24, 2016. Retrieved September 11, 2015.
- ↑ "GartnerGroup's Dataquest Says Mobile Phone Sales Increased 65 Percent in 1999". Tech Insider. Business Insider. February 8, 2000. Archived from the original on January 24, 2016. Retrieved September 11, 2015.
- 1 2 "Gartner Dataquest Says Worldwide Mobile Phone Sales in 2001 Declined for First Time in Industry's History". Tech Insider. Business Insider. March 11, 2000. Archived from the original on August 26, 2015. Retrieved September 11, 2015.
- ↑ "Gartner Dataquest Says Fourth Quarter Sales Lead Mobile Phone Market to 6 Percent Growth in 2002". Business Wire. Archived from the original on August 14, 2016. Retrieved July 19, 2016.
- ↑ "Worldwide Manufacturer Sales to End Users of Mobile Terminal Devices in 2003". Umtsworld.com. Archived from the original on October 27, 2012. Retrieved August 8, 2012.
- ↑ "Gartner Says Strong Fourth Quarter Sales Led Worldwide Mobile Phone Sales to 30 Percent Growth in 2004". Gartner. Archived from the original on September 25, 2015. Retrieved September 11, 2015.
- ↑ "Gartner Says Top Six Vendors Drive Worldwide Mobile Phone Sales to 21 Percent Growth in 2005. (Worldwide Mobile Terminal Sales to End-Users in 2005. Table: 2)". Gartner. Archived from the original on February 15, 2013. Retrieved August 8, 2012.
- ↑ "Gartner Says Worldwide Mobile Phone Sales Grew 21 Percent in 2006. (Worldwide Mobile Terminal Sales to End-Users in 2006. Table: 2)". Gartner. Archived from the original on August 28, 2013. Retrieved August 8, 2012.
- ↑ "Gartner Says Worldwide Mobile Phone Sales Increased 16 Per Cent in 2007. (Worldwide Mobile Terminal Sales to End-Users in 2007. Table: 1)". Gartner. Archived from the original on June 13, 2013. Retrieved August 8, 2012.
- ↑ "Apple - Press Info - Apple Reports Fourth Quarter Results". apple.com. Archived from the original on January 1, 2012.
- ↑ "Gartner Says Worldwide Mobile Phone Sales Grew 6 Per Cent in 2008, But Sales Declined 5 Per Cent in the Fourth Quarter. (Worldwide Mobile Terminal Sales to End-Users in 2008. Table: 2)". Gartner. Archived from the original on February 13, 2013. Retrieved March 2, 2009.
- ↑ "Apple - Press Info - Apple Reports First Quarter Results". apple.com. Archived from the original on March 4, 2013.
- ↑ "Gartner Says Worldwide Mobile Phone Sales to End Users Grew 8 Per Cent in Fourth Quarter 2009; Market Remained Flat in 2009. (Worldwide Mobile Terminal Sales to End Users in 2009. Table: 1)". Gartner. Archived from the original on September 23, 2012. Retrieved August 8, 2012.
- ↑ "Apple - Press Info - Apple Reports First Quarter Results". apple.com. Archived from the original on January 1, 2012.
- ↑ "Gartner Says Worldwide Mobile Device Sales to End Users Reached 1.6 Billion Units in 2010; Smartphone Sales Grew 72 Percent in 2010. (Worldwide Mobile Device Sales to End Users in 2010. Table: 1)". Gartner. Archived from the original on September 10, 2015. Retrieved September 16, 2015.
- ↑ "Archived copy" (PDF). Archived (PDF) from the original on January 8, 2012. Retrieved December 29, 2011.
- ↑ "Apple - Press Info - Apple Reports First Quarter Results". apple.com. Archived from the original on January 2, 2012.
- ↑ "About The Industry – Electronics TakeBack Coalition". Electronicstakeback.com. Archived from the original on April 26, 2012. Retrieved August 8, 2012.
- ↑ "Gartner Says Worldwide Smartphone Sales Soared in Fourth Quarter of 2011 With 47 Percent Growth. (Worldwide Mobile Device Sales to End Users by Vendor in 2011. Table: 2)". Gartner. Archived from the original on January 24, 2013. Retrieved August 8, 2012.
- ↑ "Samsung Electronics Annual Report" (PDF). Samsung Electronics. Archived (PDF) from the original on February 6, 2013. Retrieved March 16, 2013.
- ↑ "ZTE becomes world's fourth largest mobile phone vendor - GSMArena.com news". Gsmarena.com. Archived from the original on July 26, 2012. Retrieved August 8, 2012.
- ↑ "Gartner Says Worldwide Mobile Phone Sales Declined 1.7 Percent in 2012. (Worldwide Mobile Phone Sales to End Users by Vendor in 2012. Table: 2)". Gartner. Archived from the original on December 28, 2015. Retrieved December 30, 2015.
- ↑ "Gartner Says Smartphone Sales Surpassed One Billion Units in 2014. (Worldwide Mobile Phone Sales to End Users by Vendor in 2014. Table: 4)". Gartner. Archived from the original on July 21, 2015. Retrieved July 17, 2015.
- ↑ "Gartner Says Worldwide Smartphone Sales Grew 9.7 Percent in Fourth Quarter of 2015 (see Table 2)". Gartner. Archived from the original on June 13, 2017. Retrieved July 2, 2017.
- ↑ "Gartner Says Worldwide Sales of Smartphones Grew 7 Percent in the Fourth Quarter of 2016 (see Table 2)". Gartner. Archived from the original on February 18, 2017. Retrieved February 18, 2017.
- ↑ "Gartner Says Worldwide Sales of Smartphones Recorded First Ever Decline During the Fourth Quarter of 2017 (see Table 2)". Gartner. Archived from the original on February 22, 2017. Retrieved February 22, 2018.