Law, government, and crime in Winnipeg
| Mayor | Brian Bowman |
| River Heights-Fort Garry | John Orlikow |
| Charleswood-Tuxedo | Marty Morantz |
| St. Charles | Shawn Dobson |
| St. James-Brooklands | Scott Gillingham |
| Fort Rouge-East Fort Garry | Jenny Gerbasi |
| North Kildonan | Jeff Browaty |
| St. Boniface | Matt Allard |
| Old Kildonan | Devi Sharma |
| Point Douglas | Mike Pagtakhan |
| Daniel McIntyre | Cindy Gilroy |
| St. Vital | Brian Mayes |
| St. Norbert | Janice Lukes |
| Elmwood-East Kildonan | Jason Schreyer |
| Transcona | Russ Wyatt |

The municipal government of Winnipeg is represented by 15 city councillors and a mayor elected every four years. On July 27, 1971, the City of Winnipeg absorbed the R. M. of Charleswood, the R. M. of Fort Garry, the R. M. of North Kildonan, the R. M. of Old Kildonan, the Town of Tuxedo, the City of East Kildonan, the City of West Kildonan, the City of St. Vital, the City of Transcona, the City of St. Boniface, the City of St. James-Assiniboia, the old City of Winnipeg and Metropolitan Corporation of Greater Winnipeg were amalgamated to create a unicity.
The first election for the newly combined city was held on October 6, 1971. The City Council consisted of 50 councillors and one mayor. The councillors were elected on the basis of one councillor per city ward while the mayor was elected by the city-at-large. The term of office was three years. The inaugural meeting of the new council took place on January 4, 1972.
Since 50 councillors proved too unwieldy the city wards were reduced to 29 in 1977. In 1992 the city wards were reduced even further to the present 15 and city councillors became full-time politicians.
On June 22, 2004, Sam Katz was elected as the first Jewish mayor of Winnipeg. He beat out prominent politicians Dan Vandal, Al Golden, and MaryAnn Mihychuk for the job by receiving 42.51% of the vote. This came after the resignation of Glen Murray as mayor of Winnipeg to run in the 2004 federal election.
Katz was re-elected to a second term in the 2006 elections on October 25, 2006. After promising in his first election to run for only two terms, Katz ran for a third term in 2010. He was re-elected in the 2010 elections. Brian Bowman, the City's first Aboriginal Mayor, was elected as the 43rd Mayor of the City of Winnipeg in a landslide victory on October 22nd, 2014.
Winnipeg is represented in the House of Commons of Canada by eight Members of Parliament. As of 2016, seven are from the Liberal Party of Canada, and one is from the New Democratic Party.
Politics
Starting in 1900, in both provincial and federal elections, central Winnipeg elected politicians from the Labour Party. Winnipeg was the site of a general strike from May 15 to June 28, 1919. There were violent protests during this strikes, several deaths at the hands of the Royal Northwest Mounted Police, and the arrest of many of Winnipeg's future politicians. Though it was not chartered until 1932, the Co-operative Commonwealth Federation was born not only out of the depression but also out of the labour unrest of 1919. Its successor, the New Democratic Party, has enjoyed much support in Winnipeg since the early 1960s. Winnipeg's longest-serving Members of Parliament include J.S. Woodsworth (21 years), Stanley Knowles (38 years), David Orlikow (25 years), Bill Blaikie (almost 27 years and re-elected in the 2006 federal election), and Lloyd Axworthy (21 years).
Aside from being the provincial capital of Manitoba, Winnipeg has served as the capital for two other Canadian territories: the Northwest Territories from 1870 to 1876 and the District of Keewatin from 1876 to 1905.
Police and Crime
Law enforcement
Winnipeg is policed by the Winnipeg Police Service, which in 2012, had 1,442 police officers.[1] In 2017, Winnipeg had 192 police officers per 100,000 people, down from 200 in 2015. A change that is consistent with an overall decline in police officers per capita across Canada, which saw a 1% drop last year and a 1% decline the year before. At 192, Winnipeg has among the highest number of cops per capita among major Canadian cities with populations of 500,000 or more.[2]
Crime Rates
| Western Canada Prairie Crime severity index [3] | |||||||||||||||
|---|---|---|---|---|---|---|---|---|---|---|---|---|---|---|---|
| Geography | 2003 | 2004 | 2005 | 2006 | 2007 | 2008 | 2009 | 2010 | 2011 | 2012 | 2013 | 2014 | 2015 | 2016 | 2017 |
| Winnipeg | 165.49 | 170.83 | 163.93 | 166.09 | 150.73 | 125.82 | 137.52 | 117.65 | 103.55 | 98.23 | 83.84 | 81.12 | 89.64 | 102.37 | 106.93 |
| Regina | 221.85 | 229.09 | 205.96 | 196.57 | 187.00 | 164.61 | 143.67 | 133.18 | 124.12 | 117.36 | 106.05 | 103.08 | 109.73 | 125.76 | 111.89 |
| Saskatoon | 219.50 | 190.69 | 183.29 | 165.24 | 158.14 | 138.85 | 133.48 | 128.62 | 114.76 | 107.26 | 99.74 | 110.10 | 112.82 | 116.40 | 114.98 |
| Calgary | 102.98 | 98.55 | 97.01 | 96.29 | 91.80 | 84.92 | 80.78 | 76.39 | 65.34 | 61.15 | 60.99 | 60.67 | 79.11 | 77.47 | 81.76 |
| Edmonton | 141.52 | 144.32 | 141.01 | 129.75 | 128.64 | 122.69 | 114.74 | 101.81 | 87.02 | 84.49 | 85.41 | 87.90 | 102.58 | 106.51 | 112.34 |
| Western Canada Prairie Non-violent crime severity index[4] | |||||||||||||||
|---|---|---|---|---|---|---|---|---|---|---|---|---|---|---|---|
| Geography | 2003 | 2004 | 2005 | 2006 | 2007 | 2008 | 2009 | 2010 | 2011 | 2012 | 2013 | 2014 | 2015 | 2016 | 2017 |
| Index | |||||||||||||||
| Winnipeg | 162.66 | 167.89 | 154.67 | 157.17 | 139.04 | 110.79 | 116.86 | 98.49 | 81.63 | 79.72 | 70.05 | 68.08 | 76.59 | 87.21 | 89.92 |
| Regina | 232.24 | 244.95 | 213.78 | 192.01 | 188.71 | 161.97 | 138.91 | 125.99 | 124.86 | 119.56 | 105.06 | 102.74 | 109.91 | 125.01 | 114.27 |
| Saskatoon | 216.29 | 195.30 | 176.87 | 149.93 | 138.76 | 128.59 | 124.76 | 117.94 | 108.83 | 100.02 | 95.59 | 105.42 | 112.39 | 118.27 | 117.24 |
| Calgary | 106.97 | 102.59 | 97.88 | 96.86 | 90.88 | 83.11 | 77.87 | 74.69 | 63.49 | 60.82 | 60.24 | 59.32 | 81.20 | 82.10 | 84.52 |
| Edmonton | 147.60 | 154.35 | 148.34 | 135.11 | 128.90 | 119.52 | 113.47 | 99.71 | 80.42 | 80.17 | 83.18 | 85.44 | 101.45 | 107.83 | 113.99 |
| Western Canada Prairie Violent crime severity index[5] | |||||||||||||||
|---|---|---|---|---|---|---|---|---|---|---|---|---|---|---|---|
| Geography | 2003 | 2004 | 2005 | 2006 | 2007 | 2008 | 2009 | 2010 | 2011 | 2012 | 2013 | 2014 | 2015 | 2016 | 2017 |
| Index | |||||||||||||||
| Winnipeg | 172.86 | 178.47 | 188.03 | 189.27 | 181.16 | 164.92 | 191.24 | 167.48 | 163.23 | 148.53 | 121.26 | 116.50 | 124.99 | 143.86 | 153.53 |
| Regina | 194.82 | 187.86 | 185.63 | 208.41 | 182.55 | 171.47 | 156.03 | 151.86 | 121.38 | 110.63 | 108.16 | 103.41 | 108.59 | 127.01 | 104.54 |
| Saskatoon | 227.84 | 178.68 | 199.98 | 205.05 | 208.54 | 165.52 | 156.16 | 156.39 | 130.39 | 126.54 | 110.57 | 122.34 | 113.35 | 110.44 | 107.93 |
| Calgary | 92.61 | 88.04 | 94.76 | 94.80 | 94.19 | 89.63 | 88.36 | 80.82 | 70.05 | 61.70 | 62.69 | 64.04 | 72.92 | 64.09 | 73.54 |
| Edmonton | 125.69 | 118.24 | 121.95 | 115.80 | 127.96 | 130.95 | 118.04 | 107.26 | 104.67 | 95.88 | 91.05 | 94.18 | 105.09 | 102.13 | 106.99 |
Violent crime
Winnipeg has long been one of Canada's most violent cities. From 1981 to 2012, Winnipeg has been the "murder capital" 16 times, of every Canadian Metropolitan Area,[6][7] which is 51.6% of the time. From 2007 to 2012, Winnipeg was the murder capital every year. Over a similar time period, Winnipeg has consistently had the highest rates of robbery, sexual assault, and violent crime index of any large Canadian city. Winnipeg has had the highest violent crime index since 2009, where it was more than double the Canadian average (187.0 compared to 93.7), as well as in 2011 (173.8 to 85.3), although the rate has been lowering. For example, in 2009 the rate was 187.0, where in 2012 it was down to 145.4, which is still 20 points higher than the second-place city, Saskatoon. In 2011, when Winnipeg's homicide rate peaked, 41 homicides were recorded,[1] for a rate of 6.2 per 100,000 residents. There were an additional 4 unlawful deaths, which would bring the rate to 6.8. This rate was around 4 times higher than the national rate at 1.7 per 100,000 people.[8] The next year, there were 30 known homicides in Winnipeg for a rate of 4.5 per 100,000 residents, with an addition 3 unlawful deaths equating to a rate of 5.0. Again, a few times higher than the national rate at 1.6. The robbery rate in 2012 was between 250.1 and 272.9, as the annual crime report and CrimeStat[9] had different numbers. The annual crime report, reported 1,660 robberies, where as CrimeStat reported 1,811. Regardless, the rate is several times higher than the national average at 79.4.[10] Winnipeg's robbery rate peaked at 346.7 in 2009, the much lower robbery rate in 2012 of course shows a decrease in this violent crime.[11]
Even though Winnipeg experiences high rates of violent crime, the city has witnessed a general decreasing trend in the frequency of these crimes. For example, the assault rate has dropped every year since 2009 from 953.4 per 100,000 residents to 810.9 in 2012.[12] Although this rate is still not as low as the number recorded in 2007 (781.1), it is substantially lower than the years of 1996 to 2002 when the average rate was 1049.8 per 100,000 residents. The robbery and sexual assault rates are also lower than they were back in 2009. The only rate that has increased, is the homicide rate.

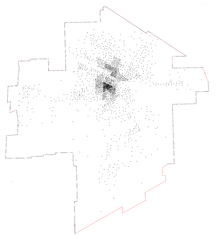
The concentration of crime in Winnipeg
Despite high overall violent crime rates compared to other Canadian cities, crime in Winnipeg is very concentrated. For example, 80 of 234 neighbourhoods had not one robbery in 2012,[13] and 32 others only had one robbery. But there were 25 neighbourhoods (about 10% of neighbourhoods) that had higher robbery rates than the highest robbery rate in Toronto (Bay Street Corridor; 640 per 100,000 residents),[14][15] such as Lord Selkirk Park with a rate of 4,395.6. These neighbourhoods also have a high native population,[16] or South Portage at 4,139.8. The two highest rankings are South Point Douglas (11,304.3) and Logan-C.P.R. (6,333.3) but both have lower populations under 1,000 residents. Lord Selkirk Park and South Portage compare to some of the most dangerous neighbourhoods in the United States of America,[17] however no ranking is 100% certain as Canada and the USA have different classifications for crimes, (robbery is one though that both countries use the same), and there is also no recorded assault rates for Winnipeg neighbourhoods.
The 20 neighborhoods in Winnipeg with the highest robbery rates, all have boundaries which connect to each other;[9][13][18] South Point Douglas, Logan - C.P.R., Lord Selkirk Park, South Portage, Portage - Ellice, Dufferin Industrial, Spence, Central Park, St. John's Park, William Whyte, West Alexander, North Point Douglas, Centennial, Colony, China Town, Dufferin, Daniel Mcintyre, St. John's, Portage & Main and West Broadway; which in 2006 had a cumulative population of 54,255.[19] In 2012, with 918 robberies (1692.9 per 100,000 people),[9] this geographical cluster is where crime the majority of violent crime happens in Winnipeg - 918 of the 1,812 (50.7%) robberies in the city, occurred in this area, where only 8.7% of the cities total population lives.[13][19] From 2009 to 2013, 95 of the 145 (65.5%) homicides in Winnipeg occurred in this smaller portion of the city,[20] creating an average homicide rate of 35.0 per 100,000 residents, peaking at 57.1 in 2011. If we subtract these areas from the city, the homicide rate average in Winnipeg is substantially lower at 1.8 per 100,000 people, and the robbery rate in the city is over 1,000% lower at 156.7.
Property crime
.jpg)
Property crime in Winnipeg has dropped immensely over the years. From the early 1990s to mid-2000s, Winnipeg had a huge auto-theft problem, where the rate peaked at 2,165.0 per 100,000 residents, in 2006.[11] For a comparison, the 2006 rate in Canada was 4.5 times lower, at 487 auto-thefts per 100,000 residents.[21] From 2000 to 2007, the rate only dipped below 1,500.0, one time, very slightly, in 2002 at 1,497.8. These rates were by far the highest in the country. Because of these insanely high rates, Manitoba Public Insurance (MPI), to combat auto theft, established financial incentives for motor vehicle owners to install ignition immobilisers in their vehicles. It now requires owners of high-risk vehicles to install immobilisers.[22] This has proven to be successful as the auto-theft rate has been on a constant drop since 2006 (in total a 562.1% drop). In 2008 the rate was 1,059.6, in 2009; 692.7, 2010; 555.8, 2011; 341.5 and in 2012 the rate was 327.0. Other than motor theft, other property crimes have been dropping as well. Regarding the latest statistics year (2012), the theft rate has dropped every year since 2003, the break & enter rate has been going down since 1991, although not on a constant slope, but a bumpy downhill ride, and the mischief rate has gone down every year since 2005. However the arson rate seems to be on a trend upwards from 2007.[23]
| Crime Rates (per 100,000 residents) in Winnipeg, MB[24][C 1][C 2] | |||||||||||
|---|---|---|---|---|---|---|---|---|---|---|---|
| Year | Homicide &
Unlawful Death[C 3] |
Attempted
Murder |
Assault | SexualAssault | Robbery | Break &Enter | Theft[C 4] | Motor Vehicle Theft | Arson | Mischief | |
| 1991 | 2.6 | 7.0 | 670.2 | 129.6 | 212.5 | 2,059.5 | 4,575.1 | 393.2 | |||
| 1992 | 1.9 | 6.0 | 789.1 | 146.1 | 244.8 | 1,883.8 | 4,943.8 | 390.9 | |||
| 1993 | 2.4 | 5.8 | 974.9 | 122.4 | 237.5 | 2,003.9 | 4,434.7 | 1,055.1 | |||
| 1994 | 2.8 | 4.4 | 956.2 | 132.0 | 278.7 | 2,110.4 | 4,523.7 | 1,272.6 | |||
| 1995 | 2.6 | 5.5 | 859.0 | 106.9 | 298.6 | 1,625.9 | 4,226.3 | 1,275.2 | |||
| 1996 | 4.5 | 3.9 | 1,150.2 | 79.7 | 303.5 | 1,596.7 | 4,071.0 | 1,349.9 | |||
| 1997 | 3.6 | 3.1 | 1,116.5 | 83.4 | 321.3 | 1,567.9 | 3,352.4 | 1,460.5 | 25.5 | 1,851.8 | |
| 1998 | 2.7 | 1.5 | 997.6 | 75.2 | 270.0 | 1,456.0 | 3,262.7 | 1,369.5 | 53.5 | 1,837.1 | |
| 1999 | 2.3 | 1.3 | 918.6 | 74.1 | 291.8 | 1,296.9 | 3,232.5 | 1,405.9 | 75.1 | 2,051.7 | |
| 2000 | 2.6 | 2.3 | 1,077.6 | 91.4 | 273.4 | 1,283.4 | 3,189.0 | 1,527.6 | 85.9 | 2,008.4 | |
| 2001 | 2.9 | 2.7 | 1,042.5 | 95.9 | 292.8 | 1,210.6 | 3,391.8 | 1,721.1 | 78.8 | 2,352.2 | |
| 2002 | 3.4 | 1.9 | 1,045.8 | 108.8 | 240.7 | 1,085.5 | 3,385.0 | 1,497.8 | 76.2 | 2,410.4 | |
| 2003 | 2.9 | 1.6 | 951.8 | 114.1 | 257.8 | 1,219.3 | 4,030.4 | 1,621 | 88.1 | 2,785.4 | |
| 2004 | 5.4 | 1.6 | 925.5 | 107.0 | 253.2 | 1,191.3 | 3,835.9 | 2,119.2 | 92.2 | 2,760.2 | |
| 2005 | 4.0 | 1.9 | 965.3 | 106.6 | 291.1 | 1,142.0 | 3,381.5 | 1,877.4 | 50.4 | 3,100.8 | |
| 2006 | 3.5 | 2.4 | 935.7 | 104.8 | 308.9 | 1,129.2 | 3,218.6 | 2,165.0 | 75.9 | 3,033.4 | |
| 2007 | 4.2 | 4.2 | 781.1 | 89.4 | 302.1 | 1,085.1 | 2,569.9 | 1,919.5 | 28.9 | 2,786.9 | |
| 2008 | 4.5 | 4.0 | 863.2 | 97.6 | 253.0 | 822.3 | 2,343.5 | 1,059.6 | 45.4 | 2,402.6 | |
| 2009 | 4.6 | 2.6 | 953.4 | 105.7 | 346.7 | 870.4 | 2,301.0 | 692.7 | 61.5 | 2,264.1 | |
| 2010 | 3.3 | 2.0 | 920.2 | 110.6 | 304.1 | 852.2 | 2,287.0 | 555.8 | 56.9 | 2,134.9 | |
| 2011 | 6.8 | 0.8 | 849.9 | 108.6 | 262.8 | 712.6 | 1,890.5 | 341.5 | 69.3 | 1,832.8 | |
| 2012 | 5.0 | 0.9 | 810.9 | 100.7 | 250.1 / 272.9 | 691.7 / 729.8 | 1,869.3 | 327.0 / 338.9 | 63.6 | 1,736.1 | |
Neighbourhoods
Only neighborhoods with over 1,000 people, and more than one homicide are accounted for in this table. These rates are from 4 years, 2009 to 2012.
| Winnipeg Homicide Rates via Neighbourhood (2009-2012)[25][26][27][28][29][30] | ||||
|---|---|---|---|---|
| Neighbourhood | Rate (per 100,000 people) | Homicides | Population | |
| Daniel Mcintyre | 33.4 | 13 | 9,750 | |
| William Whyte | 48.3 | 12 | 6,220 | |
| North Point Douglas | 123.6 | 11 | 2,225 | |
| St. John's | 32.4 | 10 | 7,725 | |
| Broadway-Assiniboine | 24.7 | 5 | 5,080 | |
| Centennial | 56.2 | 5 | 2,225 | |
| Dufferin | 48.3 | 5 | 2,090 | |
| Spence | 23.5 | 4 | 4,260 | |
| Central Park | 28.3 | 4 | 3,555 | |
| West Alexander | 25.0 | 4 | 4,000 | |
| South Portage | 40.4 | 3 | 1,860 | |
| The Maples | 3.8 | 2 | 13,335 | |
| Chalmers | 5.3 | 2 | 9,475 | |
| Melrose | 39.3 | 2 | 1,275 | |
| West Broadway | 9.4 | 2 | 5,325 | |
| Weston | 8.7 | 2 | 5,810 | |
| River East | 6.0 | 2 | 8,350 | |
| River-Osborne | 10.3 | 2 | 4,800 | |
| Sargent Park | 8.6 | 2 | 5,845 | |
| St. Matthews | 8.7 | 2 | 5,795 | |
| Wolseley | 6.6 | 2 | 7,610 | |
There are over 25 other neighbourhoods with homicides, however they did not qualify
| Crime in Winnipeg, MB by Neighborhood (2011)[9][31] | ||||||||||||
|---|---|---|---|---|---|---|---|---|---|---|---|---|
| Neighborhood | Population (2006) | Robberies | Rate | Auto Thefts | Rate | Burglaries (Break and Enter) | Rate | |||||
| South Point Douglas | 230 | 26 | 11304.3 | 9 | 3913 | 57 | 24782.6 | |||||
| Logan - C.P.R. | 300 | 19 | 6333.3 | 6 | 2000 | 16 | 5333.3 | |||||
| Polo Park | 285 | 15 | 5263.2 | 14 | 4912.3 | 9 | 3157.9 | |||||
| Lord Selkirk Park | 1365 | 60 | 4395.6 | 22 | 1611.7 | 20 | 1465.2 | |||||
| South Portage | 1860 | 77 | 4139.8 | 31 | 1666.7 | 61 | 3279.6 | |||||
| Portage - Ellice | 1105 | 43 | 3891.4 | 10 | 905 | 12 | 1086 | |||||
| Exchange District | 420 | 14 | 3333.3 | 11 | 2619 | 25 | 5952.4 | |||||
| Dufferin Industrial | 125 | 3 | 2400 | 4 | 3200 | 8 | 6400 | |||||
| Spence | 4260 | 90 | 2112.7 | 23 | 539.9 | 68 | 1596.2 | |||||
| Central Park | 3555 | 72 | 2025.3 | 20 | 562.6 | 19 | 534.5 | |||||
| Kensington | 255 | 5 | 1960.8 | 1 | 392.2 | 1 | 392.2 | |||||
| St. John's Park | 575 | 11 | 1913 | 9 | 1565.2 | 7 | 1217.4 | |||||
| William Whyte | 6220 | 117 | 1881 | 59 | 948.6 | 158 | 2540.2 | |||||
| West Alexander | 4000 | 70 | 1750 | 54 | 1350 | 63 | 1575 | |||||
| North Point Douglas | 2225 | 38 | 1707.9 | 33 | 1483.1 | 76 | 3415.7 | |||||
| Centennial | 2225 | 36 | 1618 | 14 | 629.2 | 46 | 2067.4 | |||||
| Colony | 715 | 10 | 1398.6 | 9 | 1258.7 | 24 | 3356.6 | |||||
| China Town | 605 | 7 | 1157 | 0 | 0 | 0 | 0 | |||||
| Dufferin | 2090 | 24 | 1148.3 | 19 | 909.1 | 58 | 2775.1 | |||||
| Daniel Mcintyre | 9750 | 93 | 953.8 | 49 | 502.6 | 122 | 1251.3 | |||||
| St. John's | 7725 | 67 | 867.3 | 86 | 1113.3 | 112 | 1449.8 | |||||
| West Broadway | 5325 | 45 | 845.1 | 32 | 600.9 | 87 | 1633.8 | |||||
| Burrows Central | 4805 | 36 | 749.2 | 49 | 1019.8 | 74 | 1540.1 | |||||
| Brooklands | 2255 | 16 | 709.5 | 20 | 886.9 | 28 | 1241.7 | |||||
| River - Osborne | 4880 | 34 | 696.7 | 16 | 327.9 | 56 | 1147.5 | |||||
| Mission Industrial | 150 | 1 | 666.7 | 5 | 3333.3 | 13 | 8666.7 | |||||
| St. Matthews | 5795 | 33 | 569.5 | 29 | 500.4 | 83 | 1432.3 | |||||
| Talbot - Grey | 2295 | 12 | 522.9 | 9 | 392.2 | 12 | 522.9 | |||||
| Lavalee | 1345 | 7 | 520.4 | 6 | 446.1 | 7 | 520.4 | |||||
| Varennes | 1170 | 6 | 512.8 | 1 | 85.5 | 7 | 598.3 | |||||
| Airport | 205 | 1 | 487.8 | 2 | 975.6 | 0 | 0 | |||||
| Broadway - Assiniboine | 5080 | 24 | 472.4 | 14 | 275.6 | 26 | 511.8 | |||||
| Mcmillan | 3420 | 14 | 409.4 | 15 | 438.6 | 33 | 964.9 | |||||
| Leila North | 750 | 3 | 400 | 2 | 266.7 | 4 | 533.3 | |||||
| West Wolseley | 260 | 1 | 384.6 | 3 | 1153.8 | 3 | 1153.8 | |||||
| Chalmers | 9475 | 36 | 379.9 | 75 | 791.6 | 114 | 1203.2 | |||||
| Burrows - Keewatin | 2760 | 10 | 362.3 | 14 | 507.2 | 28 | 1014.5 | |||||
| Fairfield Park | 295 | 1 | 339 | 1 | 339 | 11 | 3728.8 | |||||
| Central St. Boniface | 6215 | 21 | 337.9 | 19 | 305.7 | 52 | 836.7 | |||||
| St. Norbert | 1290 | 4 | 310.1 | 0 | 0 | 5 | 387.6 | |||||
| Weston | 5810 | 18 | 309.8 | 42 | 722.9 | 77 | 1325.3 | |||||
| Shaughnessy Park | 2285 | 7 | 306.3 | 14 | 612.7 | 39 | 1706.8 | |||||
| Riverview | 4350 | 13 | 298.9 | 15 | 344.8 | 32 | 735.6 | |||||
| Garden City | 5760 | 17 | 295.1 | 25 | 434 | 38 | 659.7 | |||||
| North St. Boniface | 1775 | 5 | 281.7 | 9 | 507 | 22 | 1239.4 | |||||
| King Edward | 5340 | 15 | 280.9 | 28 | 524.3 | 57 | 1067.4 | |||||
| Glendale | 1070 | 3 | 280.4 | 4 | 373.8 | 3 | 280.4 | |||||
| Armstrong Point | 360 | 1 | 277.8 | 1 | 277.8 | 4 | 1111.1 | |||||
| Rivergrove | 1095 | 3 | 274 | 4 | 365.3 | 18 | 1643.8 | |||||
| Glenelm | 2195 | 6 | 273.3 | 10 | 455.6 | 34 | 1549 | |||||
| Earl Grey | 4410 | 12 | 272.1 | 13 | 294.8 | 45 | 1020.4 | |||||
| Victoria West | 2600 | 7 | 269.2 | 12 | 461.5 | 21 | 807.7 | |||||
| Crestview | 8855 | 22 | 248.4 | 28 | 316.2 | 33 | 372.7 | |||||
| Worthington | 5425 | 13 | 239.6 | 9 | 165.9 | 22 | 405.5 | |||||
| Melrose | 1275 | 3 | 235.3 | 7 | 549 | 7 | 549 | |||||
| Munroe West | 3020 | 7 | 231.8 | 21 | 695.4 | 34 | 1125.8 | |||||
| Dufresne | 435 | 1 | 229.9 | 6 | 1379.3 | 2 | 459.8 | |||||
| Agassiz | 435 | 1 | 229.9 | 0 | 0 | 0 | 0 | |||||
| Norwood East | 4125 | 9 | 218.2 | 13 | 315.2 | 60 | 1454.5 | |||||
| Roslyn | 4145 | 9 | 217.1 | 5 | 120.6 | 13 | 313.6 | |||||
| Vialoux | 950 | 2 | 210.5 | 2 | 210.5 | 2 | 210.5 | |||||
| Rossmere - B | 3885 | 8 | 205.9 | 8 | 205.9 | 44 | 1132.6 | |||||
| Leila - Mcphillips Triangle | 3040 | 6 | 197.4 | 10 | 328.9 | 16 | 526.3 | |||||
| Inkster - Faraday | 4135 | 8 | 193.5 | 39 | 943.2 | 39 | 943.2 | |||||
| Robertson | 4205 | 8 | 190.2 | 20 | 475.6 | 62 | 1474.4 | |||||
| Grant Park | 2700 | 5 | 185.2 | 8 | 296.3 | 21 | 777.8 | |||||
| Wolseley | 7610 | 14 | 184 | 30 | 394.2 | 82 | 1077.5 | |||||
| Elm Park | 1710 | 3 | 175.4 | 0 | 0 | 13 | 760.2 | |||||
| Rossmere - A | 13350 | 22 | 164.8 | 41 | 307.1 | 78 | 584.3 | |||||
| Lord Roberts | 4955 | 8 | 161.5 | 17 | 343.1 | 32 | 645.8 | |||||
| Kingston Crescent | 620 | 1 | 161.3 | 1 | 161.3 | 0 | 0 | |||||
| East Elmwood | 3110 | 5 | 160.8 | 11 | 353.7 | 21 | 675.2 | |||||
| Sargent Park | 5845 | 9 | 154 | 30 | 513.3 | 69 | 1180.5 | |||||
| Pulberry | 4560 | 7 | 153.5 | 6 | 131.6 | 17 | 372.8 | |||||
| Montcalm | 4620 | 7 | 151.5 | 6 | 129.9 | 10 | 216.5 | |||||
| Minto | 5360 | 8 | 149.3 | 20 | 373.1 | 75 | 1399.3 | |||||
| Fort Richmond | 11610 | 17 | 146.4 | 23 | 198.1 | 34 | 292.9 | |||||
| The Maples | 13335 | 19 | 142.5 | 47 | 352.5 | 61 | 457.4 | |||||
| Edgeland | 1420 | 2 | 140.8 | 0 | 0 | 6 | 422.5 | |||||
| Margaret Park | 2155 | 3 | 139.2 | 16 | 742.5 | 7 | 324.8 | |||||
| Niakwa Park | 745 | 1 | 134.2 | 1 | 134.2 | 0 | 0 | |||||
| Jefferson | 8280 | 10 | 120.8 | 54 | 652.2 | 54 | 652.2 | |||||
| Rockwood | 4205 | 5 | 118.9 | 6 | 142.7 | 55 | 1308 | |||||
| Silver Heights | 5100 | 6 | 117.6 | 8 | 156.9 | 20 | 392.2 | |||||
| Varsity View | 2600 | 3 | 115.4 | 4 | 153.8 | 3 | 115.4 | |||||
| Heritage Park | 5500 | 6 | 109.1 | 19 | 345.5 | 30 | 545.5 | |||||
| Pembina Strip | 2815 | 3 | 106.6 | 6 | 213.1 | 8 | 284.2 | |||||
| Munroe East | 8460 | 9 | 106.4 | 22 | 260 | 28 | 331 | |||||
| Deer Lodge | 3785 | 4 | 105.7 | 9 | 237.8 | 30 | 792.6 | |||||
| Westdale | 4770 | 5 | 104.8 | 16 | 335.4 | 21 | 440.3 | |||||
| Seven Oaks | 2870 | 3 | 104.5 | 31 | 1080.1 | 22 | 766.6 | |||||
| Point Road | 1945 | 2 | 102.8 | 2 | 102.8 | 10 | 514.1 | |||||
| Templeton - Sinclair | 5160 | 5 | 96.9 | 23 | 445.7 | 22 | 426.4 | |||||
| Bruce Park | 2165 | 2 | 92.4 | 2 | 92.4 | 14 | 646.7 | |||||
| Minnetonka | 4340 | 4 | 92.2 | 4 | 92.2 | 26 | 599.1 | |||||
| Southdale | 6710 | 6 | 89.4 | 9 | 134.1 | 20 | 298.1 | |||||
| Tyndall Park | 12775 | 11 | 86.1 | 37 | 289.6 | 72 | 563.6 | |||||
| Richmond West | 8195 | 7 | 85.4 | 14 | 170.8 | 12 | 146.4 | |||||
| Valley Gardens | 8250 | 7 | 84.8 | 19 | 230.3 | 36 | 436.4 | |||||
| Beaumont | 2360 | 2 | 84.7 | 3 | 127.1 | 8 | 339 | |||||
| Windsor Park | 9665 | 8 | 82.8 | 22 | 227.6 | 34 | 351.8 | |||||
| Kildonan Drive | 4855 | 4 | 82.4 | 5 | 103 | 33 | 679.7 | |||||
| Glenwood | 3650 | 3 | 82.2 | 9 | 246.6 | 34 | 931.5 | |||||
| Luxton | 2565 | 2 | 78 | 10 | 389.9 | 10 | 389.9 | |||||
| Mynarski | 1350 | 1 | 74.1 | 3 | 222.2 | 9 | 666.7 | |||||
| Crescentwood | 2705 | 2 | 73.9 | 6 | 221.8 | 25 | 924.2 | |||||
| River East | 8350 | 6 | 71.9 | 12 | 143.7 | 46 | 550.9 | |||||
| Westwood | 7120 | 5 | 70.2 | 6 | 84.3 | 29 | 407.3 | |||||
| Wellington Crescent | 1605 | 1 | 62.3 | 2 | 124.6 | 16 | 996.9 | |||||
| Sturgeon Creek | 3215 | 2 | 62.2 | 4 | 124.4 | 18 | 559.9 | |||||
| St. Vital Perimeter South | 1680 | 1 | 59.5 | 3 | 178.6 | 8 | 476.2 | |||||
| Mandalay West | 5085 | 3 | 59 | 10 | 196.7 | 35 | 688.3 | |||||
| Alpine Place | 3515 | 2 | 56.9 | 7 | 199.1 | 3 | 85.3 | |||||
| River Park South | 10820 | 6 | 55.5 | 10 | 92.4 | 40 | 369.7 | |||||
| North River Heights | 5660 | 3 | 53 | 4 | 70.7 | 65 | 1148.4 | |||||
| Dakota Crossing | 10265 | 5 | 48.7 | 9 | 87.7 | 35 | 341 | |||||
| Betsworth | 4220 | 2 | 47.4 | 4 | 94.8 | 10 | 237 | |||||
| Amber Trails | 2135 | 1 | 46.8 | 8 | 374.7 | 31 | 1452 | |||||
| Maybank | 2335 | 1 | 42.8 | 4 | 171.3 | 6 | 257 | |||||
| Riverbend | 4715 | 2 | 42.4 | 6 | 127.3 | 17 | 360.6 | |||||
| Crescent Park | 2520 | 1 | 39.7 | 2 | 79.4 | 6 | 238.1 | |||||
| Eric Coy | 2540 | 1 | 39.4 | 2 | 78.7 | 9 | 354.3 | |||||
| Meadows | 5165 | 2 | 38.7 | 6 | 116.2 | 8 | 154.9 | |||||
| Mathers | 2605 | 1 | 38.4 | 9 | 345.5 | 12 | 460.7 | |||||
| Buchanan | 2820 | 1 | 35.5 | 9 | 319.1 | 8 | 283.7 | |||||
| Valhalla | 2905 | 1 | 34.4 | 1 | 34.4 | 6 | 206.5 | |||||
| Meadowood | 5970 | 2 | 33.5 | 18 | 301.5 | 26 | 435.5 | |||||
| Norwood West | 3055 | 1 | 32.7 | 12 | 392.8 | 16 | 523.7 | |||||
| Central River Heights | 3145 | 1 | 31.8 | 8 | 254.4 | 49 | 1558 | |||||
| Inkster Gardens | 3175 | 1 | 31.5 | 9 | 283.5 | 15 | 472.4 | |||||
| Radisson | 3355 | 1 | 29.8 | 4 | 119.2 | 9 | 268.3 | |||||
| Island Lakes | 6750 | 2 | 29.6 | 3 | 44.4 | 14 | 207.4 | |||||
| Whyte Ridge | 7565 | 2 | 26.4 | 4 | 52.9 | 13 | 171.8 | |||||
| Elmhurst | 4705 | 1 | 21.3 | 2 | 42.5 | 13 | 276.3 | |||||
| Waverley Heights | 5195 | 1 | 19.2 | 10 | 192.5 | 19 | 365.7 | |||||
| Canterbury Park | 5410 | 1 | 18.5 | 9 | 166.4 | 29 | 536 | |||||
| Booth | 5485 | 1 | 18.2 | 10 | 182.3 | 22 | 401.1 | |||||
| Linden Woods | 9550 | 1 | 10.5 | 3 | 31.4 | 21 | 219.9 | |||||
| Tissot | 135 | 0 | 0 | 2 | 1481.5 | 3 | 2222.2 | |||||
| Holden | 145 | 0 | 0 | 2 | 1379.3 | 1 | 689.7 | |||||
| Ridgewood South | 170 | 0 | 0 | 2 | 1176.5 | 0 | 0 | |||||
| Rosser - Old Kildonan | 220 | 0 | 0 | 2 | 909.1 | 6 | 2727.3 | |||||
| Stock Yards | 415 | 0 | 0 | 3 | 722.9 | 3 | 722.9 | |||||
| Archwood | 780 | 0 | 0 | 4 | 512.8 | 4 | 512.8 | |||||
| Maginot | 1585 | 0 | 0 | 8 | 504.7 | 6 | 378.5 | |||||
| Wilkes South | 595 | 0 | 0 | 3 | 504.2 | 3 | 504.2 | |||||
| Wildwood | 1095 | 0 | 0 | 5 | 456.6 | 4 | 365.3 | |||||
| Ebby - Wentworth | 720 | 0 | 0 | 3 | 416.7 | 15 | 2083.3 | |||||
| Birchwood | 1890 | 0 | 0 | 6 | 317.5 | 5 | 264.6 | |||||
| Peguis | 320 | 0 | 0 | 1 | 312.5 | 2 | 625 | |||||
| J.B. Mitchell | 2095 | 0 | 0 | 6 | 286.4 | 17 | 811.5 | |||||
| Transcona South | 720 | 0 | 0 | 2 | 277.8 | 2 | 277.8 | |||||
| Mission Gardens | 3590 | 0 | 0 | 9 | 250.7 | 28 | 779.9 | |||||
| St. George | 2530 | 0 | 0 | 6 | 237.2 | 31 | 1225.3 | |||||
| Grassie | 2165 | 0 | 0 | 5 | 230.9 | 21 | 970 | |||||
| Kern Park | 1735 | 0 | 0 | 4 | 230.5 | 8 | 461.1 | |||||
| Sir John Franklin | 2320 | 0 | 0 | 5 | 215.5 | 38 | 1637.9 | |||||
| Springfield North | 5245 | 0 | 0 | 11 | 209.7 | 22 | 419.4 | |||||
| Eaglemere | 1460 | 0 | 0 | 3 | 205.5 | 2 | 137 | |||||
| Springfield South | 1555 | 0 | 0 | 3 | 192.9 | 3 | 192.9 | |||||
| Linden Ridge | 1080 | 0 | 0 | 2 | 185.2 | 4 | 370.4 | |||||
| Parc La Salle | 2165 | 0 | 0 | 4 | 184.8 | 9 | 415.7 | |||||
| Kirkfield | 2770 | 0 | 0 | 5 | 180.5 | 15 | 541.5 | |||||
| Norberry | 1295 | 0 | 0 | 2 | 154.4 | 11 | 849.4 | |||||
| Kildare - Redonda | 6490 | 0 | 0 | 9 | 138.7 | 28 | 431.4 | |||||
| Marlton | 775 | 0 | 0 | 1 | 129 | 3 | 387.1 | |||||
| Old Tuxedo | 860 | 0 | 0 | 1 | 116.3 | 12 | 1395.3 | |||||
| South Tuxedo | 3790 | 0 | 0 | 4 | 105.5 | 15 | 395.8 | |||||
| Niakwa Place | 2385 | 0 | 0 | 2 | 83.9 | 7 | 293.5 | |||||
| South River Heights | 2585 | 0 | 0 | 2 | 77.4 | 13 | 502.9 | |||||
| Vista | 1385 | 0 | 0 | 1 | 72.2 | 4 | 288.8 | |||||
| Royalwood | 2840 | 0 | 0 | 2 | 70.4 | 8 | 281.7 | |||||
| River West Park | 1445 | 0 | 0 | 1 | 69.2 | 2 | 138.4 | |||||
| Southboine | 1505 | 0 | 0 | 1 | 66.4 | 2 | 132.9 | |||||
| Richmond Lakes | 1790 | 0 | 0 | 1 | 55.9 | 1 | 55.9 | |||||
| Tuxedo | 2415 | 0 | 0 | 1 | 41.4 | 12 | 496.9 | |||||
| Brockville | 705 | 0 | 0 | 0 | 0 | 8 | 1134.8 | |||||
| Cloutier Drive | 205 | 0 | 0 | 0 | 0 | 0 | 0 | |||||
| Jameswood | 1250 | 0 | 0 | 0 | 0 | 2 | 160 | |||||
| Kil-Cona Park | 360 | 0 | 0 | 0 | 0 | 3 | 833.3 | |||||
| Normand Park | 700 | 0 | 0 | 0 | 0 | 3 | 428.6 | |||||
| Ridgedale | 840 | 0 | 0 | 0 | 0 | 4 | 476.2 | |||||
| Roblin Park | 980 | 0 | 0 | 0 | 0 | 0 | 0 | |||||
| Southland Park | 1235 | 0 | 0 | 0 | 0 | 5 | 404.9 | |||||
| Victoria Crescent | 615 | 0 | 0 | 0 | 0 | 1 | 162.6 | |||||
| Woodhaven | 885 | 0 | 0 | 0 | 0 | 2 | 226 | |||||
| Assiniboia Downs | N/A | 0 | 3 | 1 | ||||||||
| Assiniboine Park | N/A | 0 | 1 | 2 | ||||||||
| Bridgewater Centre | N/A | 0 | 0 | 0 | ||||||||
| Bridgewater Forest | N/A | 0 | 5 | 10 | ||||||||
| Bridgewater Lakes | N/A | 0 | 0 | 11 | ||||||||
| Bridgewater Trails | N/A | 0 | 0 | 0 | ||||||||
| Buffalo | N/A | 0 | 2 | 3 | ||||||||
| Chevrier | N/A | 0 | 4 | 6 | ||||||||
| Civic Centre | N/A | 3 | 2 | 14 | ||||||||
| Dugald | N/A | 0 | 1 | 4 | ||||||||
| Griffin | N/A | 0 | 1 | 1 | ||||||||
| Inkster Industrial Park | N/A | 5 | 11 | 15 | ||||||||
| Kildonan Crossing | N/A | 4 | 1 | 0 | ||||||||
| Kildonan Park | N/A | 0 | 0 | 0 | ||||||||
| La Barriere | N/A | 0 | 0 | 0 | ||||||||
| Maple Grove Park | N/A | 0 | 0 | 0 | ||||||||
| McCleod Industrial | N/A | 1 | 4 | 4 | ||||||||
| Murray Industrial Park | N/A | 0 | 0 | 0 | ||||||||
| North Inkster Industrial | N/A | 0 | 3 | 4 | ||||||||
| North Transcona Yards | N/A | 0 | 1 | 1 | ||||||||
| Oak Point Highway | N/A | 0 | 9 | 13 | ||||||||
| Omand's Creek Industrial | N/A | 0 | 5 | 6 | ||||||||
| Pacific Industrial | N/A | 4 | 3 | 6 | ||||||||
| Parker | N/A | 0 | 0 | 2 | ||||||||
| Perrault | N/A | 0 | 0 | 1 | ||||||||
| Portage and Main | N/A | 10 | 1 | 3 | ||||||||
| Regent | N/A | 16 | 19 | 17 | ||||||||
| Sage Creek | N/A | 1 | 2 | 15 | ||||||||
| Saskatchewan North | N/A | 0 | 0 | 0 | ||||||||
| South Pointe | N/A | 0 | 1 | 6 | ||||||||
| St. Boniface Industrial Park | N/A | 0 | 5 | 2 | ||||||||
| St. James Industrial | N/A | 17 | 41 | 27 | ||||||||
| St. Vital Centre | N/A | 4 | 8 | 3 | ||||||||
| Symington Yards | N/A | 0 | 1 | 5 | ||||||||
| The Forks | N/A | 10 | 6 | 4 | ||||||||
| The Mint | N/A | 0 | 0 | 0 | ||||||||
| Transcona North | N/A | 0 | 0 | 0 | ||||||||
| Transcona Yards | N/A | 2 | 0 | 10 | ||||||||
| Trappistes | N/A | 1 | 0 | 0 | ||||||||
| Turnbull Drive | N/A | 0 | 0 | 0 | ||||||||
| Tyne-Tees | N/A | 3 | 3 | 17 | ||||||||
| University | N/A | 0 | 1 | 3 | ||||||||
| Waverly West B | N/A | 0 | 0 | 0 | ||||||||
| Waverly West D | N/A | 0 | 0 | 0 | ||||||||
| West Fort Garry Industrial | N/A | 0 | 7 | 5 | ||||||||
| West Kildonan Industrial | N/A | 1 | 0 | 0 | ||||||||
| West Perimeter | N/A | 0 | 0 | 0 | ||||||||
| Weston Shops | N/A | 1 | 4 | 6 | ||||||||
Crime by District
The City of Winnipeg has five distinct police districts:[32]
- District 1 - City Centre
- District 2 - St. James / Assiniboia
- District 3 - Lord Selkirk / West Kildonan
- East District - St. Boniface / St. Vital / Elmwood / East Kildonan / North Kildonan / Transcona
- District 6 - Assiniboine Park / Fort Rouge / Fort Garry
| District 1 | District 2 | District 3 | East District | District 6 | Not District Specific | |
|---|---|---|---|---|---|---|
| Violent Crime | 2,958 | 633 | 2,348 | 1,575 | 940 | 31 |
| Property Crimes | 7,691 | 3,697 | 6,414 | 7,732 | 5,309 | 1,019 |
| Other Crimes | 12,689 | 4,798 | 10,707 | 10,355 | 6,816 | 1,067 |
| Total Area | 14.22 km2 (5.49 sq mi) | 65.11 km2 (25.14 sq mi) | 65.28 km2 (25.20 sq mi) | 174.37 km2 (67.32 sq mi) | 156.22 km2 (60.32 sq mi) |
Manitoba
In 2011, Manitoba had the highest violent crime rate and homicide rate of all Canadian provinces[34]
See also
Notes
- ↑ The populations used for the rates were based on trends on the every-5-year census report. For example, the population on the 2001 Census was 619,544, and in 2006 it was 633,451. Therefore the population used for 2002 was 622,325 and for 2005 it was 630,670. The populations reported on the annual reports are much higher than the census reports, therefore likely inaccurate by an overestimation.
- ↑ If there are two rates with a "/" between them, it is because there were two different recorded rates. The rate on the left is from the Annual Crime Report, where as on the right is from CrimeStat.
- ↑ "Other violations causing death" only started showing records in the 2012 report (shows 2011 data as well), meaning from 1991 to 2010, only includes 1st and 2nd degree murders.
- ↑ Includes all thefts such as over $5,000, under $5,000, possession of stolen goods and fraud. It doesn't include motor vehicle theft however.
References
- 1 2 2012 Annual Crime Report, . Retrieved November 28th, 2013
- ↑ "BRODBECK: Winnipeg police force still among largest in Canada". Winnipeg Sun. 2018-07-12. Retrieved 2018-10-09.
- ↑ "Statistics Canada, Table Crime severity index".
- ↑ "Statistics Canada, Non-Violent Crime severity index".
- ↑ "Statistics Canada. Table 35-10-0026-01, Violent crime severity index".
- ↑ Homicide Rates in Canada: Statistics & Trends. Retrieved November 28th, 2013
- ↑ Latest numbers crown Winnipeg as Canada’s murder capital, Note: The rate in this year was 6.2/6.8 due to later discovered homicides. Retrieved November 28th, 2013
- ↑ Canada Homicide 2011, . Retrieved November 28th, 2013.
- 1 2 3 4 "CrimStat". City of Winnipeg. Retrieved 28 November 2013.
- ↑ Crimes in Canada, by type of violation, and by province and territory, . Retrieved November 28th, 2013
- 1 2 Every Annual Crime Report, . Retrieved November 28th, 2013
- ↑ Winnipeg Crime Rate Chart
- 1 2 3 Crime in Winnipeg Neighbourhoods (2012). Retrieved December 3rd, 2013
- ↑ Crime Map of Toronto. Retrieved November 28th, 2013
- ↑ Crimes, by type of violation, and by province and territory(Newfoundland and Labrador, Prince Edward Island, Nova Scotia, New Brunswick)
- ↑ To get the crime rates, I used the populations from now.Winnipeg [http://now.winnipeg.ca/census and crime figures from CrimeStat retrieved October 2013
- ↑ NeighborhoodScout's Top 25 Most Dangerous Neighborhoods in America, retrieved in mid-2013
- ↑ Note this list does not include the commercial areas Polo Park or Kensington and the Exchange District due to its residential development after 2006
- 1 2 Winnipeg 2006 Census Profiles Retrieved on 27 February 2014
- ↑ Winnipeg Homicide Map. Retrieved June-06-2014
- ↑ Crimes Rates in Canada 2006, . Retrieved November 28th, 2013
- ↑ "Immobilizers to be mandatory on high-risk used cars in Manitoba". CBC. 2006-08-23. Archived from the original on May 26, 2008. Retrieved 2009-07-17.
- ↑ , retrieved November 28th, 2013
- ↑ Annual Crime Reports: http://www.winnipeg.ca/police/AnnualReports/annualreports.stm
- ↑ "Winnipeg Homicide Map". CBC News.
- ↑ http://now.winnipeg.ca/home
- ↑ http://www.winnipegsun.com/2011/08/27/homicide-unit-on-dead-body-case
- ↑ "2 Teens Charged in Baseball Bat Beating Death". CBC News.
- ↑ "Missing Winnipeg woman's family seeks leads". CBC News.
- ↑ http://www.winnipegsun.com/2012/05/21/victims-family-talks
- ↑ City of Winnipeg Neighbourhood Profiles
- ↑ "About the Service Winnipeg Police Districts". City of Winnipeg. Retrieved 29 November 2012.
- ↑ "Annual Report 2011" (PDF). City of Winnipeg. Retrieved 29 November 2012.
- ↑ , StatCan 2011 Crime by Province/Territory
External links
| Features | |
|---|---|
| History | |
| Geography | |
| Economy | |
| Politics | |
| Public services | |
| Education |
|
| Transportation | |
| |