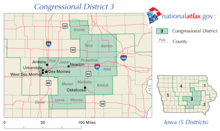
Iowa's 3rd congressional district
| Iowa's 3rd congressional district | |
|---|---|
.tif.png) Iowa's 3rd congressional district - since January 3, 2013. | |
| Current Representative | David Young (R–Van Meter) |
| Distribution |
|
| Population (2000) | 585,305[1] |
| Median income | 43,176[1] |
| Ethnicity |
|
| Cook PVI | R+1[2] |
Iowa's 3rd congressional district is a congressional district in the U.S. state of Iowa that covers the southwest portion of the state, roughly an area including Des Moines to the Nebraska and Missouri borders.
From 2003 to 2013 it encompassed Des Moines (on the western end) to the western outskirts of the Cedar Falls-Waterloo Metropolitan Area (on the northeastern end) to the western outskirts of the Cedar Rapids area (on the eastern end) and to Lucas and Monroe counties (on the southern end).
The district is represented by Republican David Young.
Redistricting
On June 22, 2001, the Iowa Legislature passed a plan to redistrict the state of Iowa. The plan went into effect in 2002 for the 108th U.S. Congress. The prior redistricting plan was effective from 1992-2001.[3]
Presidential Elections results
Election results from presidential races:
| Year | Office | Results | Political parties that won the district |
|---|---|---|---|
| 2000 | President | Al Gore 49 - George W. Bush 48% | Democratic Party (United States) |
| 2004 | President | George W. Bush 50 - John Kerry 50% | Republican Party (United States) |
| 2008 | President | Barack Obama 54 - John McCain 44% | Democratic Party (United States) |
| 2012 | President | Barack Obama 51 - Mitt Romney 47% | Democratic Party (United States) |
| 2016 | President | Donald Trump 49 - Hillary Clinton 45% | Republican Party (United States) |
List of representatives
| Representative | Party | Years | Electoral history |
|---|---|---|---|
| District created | March 4, 1863 | [Data unknown/missing.] | |
 |
Republican | March 4, 1863 – March 3, 1871 |
[Data unknown/missing.] |
 |
Republican | March 4, 1871 – March 3, 1875 |
[Data unknown/missing.] |
 |
Democratic | March 4, 1875 – March 3, 1877 |
[Data unknown/missing.] |
 |
Republican | March 4, 1877 – March 3, 1879 |
[Data unknown/missing.] |
.jpg) |
Republican | March 4, 1879 – March 3, 1883 |
[Data unknown/missing.] |
 |
Republican | March 4, 1883 – March 3, 1903 |
[Data unknown/missing.] |
 |
Republican | March 4, 1903 – March 3, 1909 |
[Data unknown/missing.] |
 |
Republican | March 4, 1909 – March 3, 1913 |
[Data unknown/missing.] |
|
Democratic | March 4, 1913 – March 3, 1915 |
[Data unknown/missing.] |
 |
Republican | March 4, 1915 – March 3, 1923 |
[Data unknown/missing.] |
 |
Republican | March 4, 1923 – March 3, 1933 |
[Data unknown/missing.] |
|
Democratic | March 4, 1933 – January 3, 1935 |
[Data unknown/missing.] |
 |
Republican | January 3, 1935 – January 3, 1949 |
[Data unknown/missing.] |
 |
Republican | January 3, 1949 – January 3, 1975 |
[Data unknown/missing.] |
 |
Republican | January 3, 1975 – January 3, 1981 |
[Data unknown/missing.] |
 |
Republican | January 3, 1981 – January 3, 1987 |
[Data unknown/missing.] |
 |
Democratic | January 3, 1987 – January 3, 1993 |
[Data unknown/missing.] |
 |
Republican | January 3, 1993 – January 3, 1997 |
Redistricted from the 5th district. |
 |
Democratic | January 3, 1997 – January 3, 2013 |
[Data unknown/missing.] |
 |
Republican | January 3, 2013 – January 3, 2015 |
Redistricted from the 4th district. |
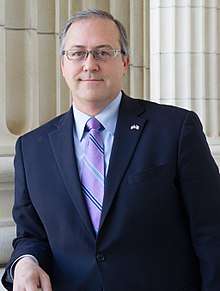 |
Republican | January 3, 2015 – Present |
[Data unknown/missing.] |
Recent election results
| Year[4]
|
Party Affiliation | Winner | Number of Votes | Party Affiliation | Loser | Number of Votes | Percentage of Votes |
|---|---|---|---|---|---|---|---|
| 1920 | Republican | Burton E. Sweet | 67,859 | Farmer-Labor | Roy Jacobs | 1,974 | 97% - 3% |
| 1922 | Republican | Thomas J. B. Robinson | 34,518 | Democrat | Fred P. Hageman | 24,304 | 58% - 41% |
| 1924 | Republican | Thomas J. B. Robinson | 54,921 | Democrat | Willis N. Birdsall | 25,215 | 69% - 31% |
| 1926 | Republican | Thomas J. B. Robinson | 32,180 | Democrat | Ellis E. Wilson | 13,696 | 70% - 30% |
| 1928 | Republican | Thomas J. B. Robinson | 60,025 | Democrat | Leo. F. Tierney | 38,469 | 61% - 39% |
| 1930 | Republican | Thomas J. B. Robinson | 27,098 | Democrat | W. L. Beecher | 15,908 | 63% - 37% |
| 1932 | Democrat | Albert C. Willford | 48,939 | Republican | Thomas J. B. Robinson | 47,776 | 51% - 49% |
| 1934 | Republican | John W. Gwynne | 42,063 | Democrat | Albert C. Willford | 35,159 | 51% - 43% |
| 1936 | Republican | John W. Gwynne | 53,928 | Democrat | Albert C. Willford | 47,391 | 52% - 46% |
| 1938 | Republican | John W. Gwynne | 45,541 | Democrat | W. F. Hayes | 30,158 | 60% - 40% |
| 1940 | Republican | John W. Gwynne | 65,425 | Democrat | Ernest J. Seemann | 43,709 | 60% - 40% |
| 1942 | Republican | John W. Gwynne | 54,124 | Democrat | William D. Kearney | 35,065 | 61% - 39% |
| 1944 | Republican | John W. Gwynne | 74,901 | Democrat | William D. Kearney | 56,985 | 58% - 42% |
| 1946 | Republican | John W. Gwynne | 48,346 | Democrat | Dan J. P. Ryan | 29,661 | 62% - 38% |
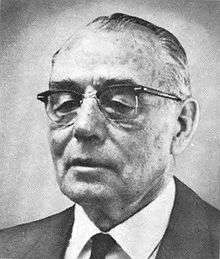
| 1948 | Republican | H. R. Gross | 78,838 | Democrat | Dan J. P. Ryan | 56,002 | 58% - 41% |
| 1950 | Republican | H. R. Gross | 73,490 | Democrat | James O. Babcock | 40,786 | 64% - 36% |
| 1952 | Republican | H. R. Gross | 109,992 | Democrat | George R. Laub | 56,871 | 66% - 34% |
| 1954 | Republican | H. R. Gross | 68,307 | Democrat | George R. Laub | 41,622 | 62% - 38% |
| 1956 | Republican | H. R. Gross | 97,590 | Democrat | Michael Micich | 69,076 | 59% - 41% |
| 1958 | Republican | H. R. Gross | 61,920 | Democrat | Michael Micich | 53,467 | 54% - 46% |
| 1960 | Republican | H. R. Gross | 99,046 | Democrat | Edward J. Gallagher, Jr. | 76,837 | 56% - 44% |
| 1962 | Republican | H. R. Gross | 66,337 | Democrat | Neel F. Hill | 50,580 | 57% - 43% |
| 1964 | Republican | H. R. Gross | 83,455 | Democrat | Stephen M. Peterson | 83,036 | 50.1% - 49.9% |
| 1966 | Republican | H. R. Gross | 79,343 | Democrat | L. A. Pat Touchae | 48,530 | 62% - 38% |
| 1968 | Republican | H. R. Gross | 101,839 | Democrat | John E. Van Eschen | 57,164 | 64% - 36% |
| 1970 | Republican | H. R. Gross | 66,087 | Democrat | Lyle D. Taylor | 45,958 | 59% - 41% |
| 1972 | Republican | H. R. Gross | 109,113 | Democrat | Lyle D. Taylor | 86,848 | 56% - 44% |
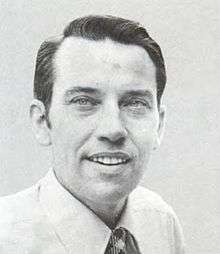
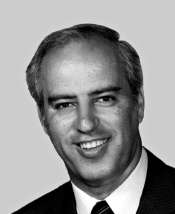
| 1974 | Republican | Charles E. Grassley | 77,468 | Democrat | Stephen J. Rapp | 74,859 | 51% - 49% |
| 1976 | Republican | Charles E. Grassley | 117,957 | Democrat | Stephen J. Rapp | 90,981 | 56% - 44% |
| 1978 | Republican | Charles E. Grassley | 103,659 | Democrat | John Knudson | 34,880 | 75% - 25% |
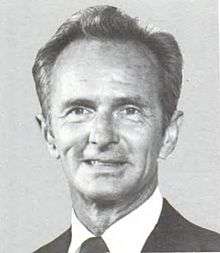
| 1980 | Republican | Cooper Evans | 107,869 | Democrat | Lynn G. Cutler | 101,735 | 51% - 48% |
| 1982 | Republican | Cooper Evans | 104,072 | Democrat | Lynn G. Cutler | 83,581 | 55% - 45% |
| 1984 | Republican | Cooper Evans | 133,737 | Democrat | Joe Johnston | 86,574 | 61% - 39% |
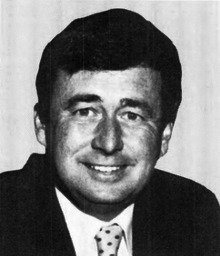
| 1986 | Democrat | David R. Nagle | 83,504 | Republican | John McIntee | 69,386 | 55% - 45% |
| 1988 | Democrat | David R. Nagle | 129,204 | Republican | Donald B. Redfern | 74,682 | 63% - 37% |
| 1990 | Democrat | David R. Nagle | 100,947 | N/A | No Opponent | 833 | 99% - 1% |
| 1992 | Republican | Jim Ross Lightfoot | 125,931 | Democrat | Elaine Baxter | 121,063 | 49% - 47% |
| 1994 | Republican | Jim Ross Lightfoot | 111,862 | Democrat | Elaine Baxter | 79,310 | 58% - 41% |
| 1996 | Democrat | Leonard L. Boswell | 115,914 | Republican | Mike Mahaffey | 111,895 | 49% - 48% |
| 1998 | Democrat | Leonard L. Boswell | 107,947 | Republican | Larry McKibben | 78,063 | 57% - 41% |
| 2000 | Democrat | Leonard L. Boswell | 156,327 | Republican | Jay Marcus | 83,810 | 63% - 34% |
| 2002 | Democrat | Leonard L. Boswell | 115,367 | Republican | Stan Thompson | 97,285 | 53% - 45% |
| 2004 | Democrat | Leonard L. Boswell | 168,007 | Republican | Stan Thompson | 136,099 | 55% - 45% |
| 2006 | Democrat | Leonard L. Boswell | 114,689 | Republican | Jeff Lamberti | 103,182 | 52% - 47% |
| 2008 | Democrat | Leonard L. Boswell | 175,423 | Republican | Kim Schmett | 131,524 | 56% - 42% |
| 2010 | Democrat | Leonard L. Boswell | 122,147 | Republican | Brad Zaun | 111,925 | 50% - 46% |
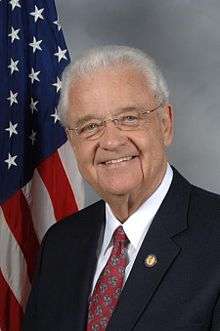
| 2012 | Republican | Tom Latham | 202,000 | Democrat | Leonard L. Boswell | 168,632 | 51% - 42% |
| 2014 | Republican | David Young | 148,814 | Democrat | Staci Appel | 119,109 | 52% - 42% |
| 2016 | Republican | David Young | 208,598 | Democrat | Jim Mowrer | 155,002 | 53% - 40% |
Recent election results
2002
| Party | Candidate | Votes | % | |
|---|---|---|---|---|
| Democratic | Leonard Boswell* | 115,367 | 53.41 | |
| Republican | Stan Thompson | 97,285 | 45.04 | |
| Libertarian | Jeffrey J. Smith | 2,689 | 1.25 | |
| Socialist Workers | Edwin B. Fruit | 569 | 0.26 | |
| No party | Others | 75 | 0.04% | |
| Total votes | 215,985 | 100.00 | ||
| Turnout | ||||
| Democratic hold | ||||
2004
| Party | Candidate | Votes | % | |
|---|---|---|---|---|
| Democratic | Leonard Boswell* | 168,007 | 55.21 | |
| Republican | Stan Thompson | 136,009 | 44.72 | |
| No party | Others | 213 | 0.07% | |
| Total votes | 304,229 | 100.00 | ||
| Turnout | ||||
| Democratic hold | ||||
2006
| Party | Candidate | Votes | % | |
|---|---|---|---|---|
| Democratic | Leonard Boswell* | 115,769 | 51.85 | |
| Republican | Jeff Lamberti | 103,722 | 46.45 | |
| Socialist Workers | Helen Meyers | 3,591 | 1.61 | |
| No party | Others | 205 | 0.09% | |
| Total votes | 223,287 | 100.00 | ||
| Turnout | ||||
| Democratic hold | ||||
2008
| Party | Candidate | Votes | % | |
|---|---|---|---|---|
| Democratic | Leonard Boswell* | 176,904 | 56.31 | |
| Republican | Kim Schmett | 132,136 | 42.06 | |
| Socialist Workers | Frank Forrestal | 4,599 | 1.46 | |
| No party | Others | 521 | 0.17% | |
| Total votes | 314,160 | 100.00 | ||
| Turnout | ||||
| Democratic hold | ||||
2010
| Party | Candidate | Votes | % | |
|---|---|---|---|---|
| Democratic | Leonard Boswell* | 122,147 | 50.73 | |
| Republican | Brad Zaun | 111,925 | 46.49 | |
| Socialist Workers | Rebecca Williamson | 6,258 | 2.60 | |
| No party | Others | 426 | 0.18% | |
| Total votes | 240,756 | 100.00 | ||
| Turnout | ||||
| Democratic hold | ||||
2012
| Party | Candidate | Votes | % | |||
|---|---|---|---|---|---|---|
| Republican | Tom Latham* | 202,000 | 50.56 | |||
| Democratic | Leonard Boswell* | 168,632 | 42.20 | |||
| Independent | Scott G. Batcher | 9,352 | 2.34 | |||
| Socialist Workers | David Rosenfeld | 6,286 | 1.57 | |||
| No party | Others | 572 | 0.14% | |||
| Total votes | 399,561 | 100.00 | ||||
| Turnout | ||||||
| Republican gain from Democratic | ||||||
2014
| Party | Candidate | Votes | % | |
|---|---|---|---|---|
| Republican | David Young | 148,814 | 52.8 | |
| Democratic | Staci Appel | 119,109 | 42.2 | |
| Libertarian | Edward Wright | 9,054 | 3.2 | |
| No party preference | Bryan Jack Holder | 4,360 | 1.5 | |
| Write-ins | 729 | 0.3 | ||
| Total votes | 282,066 | 100 | ||
| Republican hold | ||||
2016

| Party | Candidate | Votes | % | |
|---|---|---|---|---|
| Republican | David Young* | 208,598 | 53.45 | |
| Democratic | Jim Mowrer | 155,002 | 39.71 | |
| Libertarian | Bryan Jack Holder | 15,372 | 3.94 | |
| Nominated by Petition | Claudia Addy | 6,348 | 1.63 | |
| Nominated by Petition | Joe Grandanette | 4,518 | 1.16 | |
| Write-ins | 449 | 0.12 | ||
| Total votes | 390,287 | 100.00 | ||
| Republican hold | ||||
Living former members of the House from the district
As of August 2018, there are four living former members of the House from the district.
| Representative | Term of office | Date of birth (and current age) |
|---|---|---|
| Chuck Grassley | 1975–1981 | September 17, 1933 |
| David R. Nagle | 1987-1993 | April 15, 1943 |
| Jim Ross Lightfoot | 1993–1997 | September 27, 1938 |
| Tom Latham | 2013–2015 | July 14, 1948 |
Historical district boundaries
See also
References
- 1 2 Washington Post page on the 3rd District of Iowa Archived 2008-10-06 at the Wayback Machine.
- ↑ "Partisan Voting Index – Districts of the 115th Congress" (PDF). The Cook Political Report. April 7, 2017. Retrieved April 7, 2017.
- ↑ "2001 Iowa Redistricting Plan,". 2001.
- ↑ "Election Statistics,". 2005. Archived from the original on 2007-07-25.
- Martis, Kenneth C. (1989). The Historical Atlas of Political Parties in the United States Congress. New York: Macmillan Publishing Company.
- Martis, Kenneth C. (1982). The Historical Atlas of United States Congressional Districts. New York: Macmillan Publishing Company.
- Congressional Biographical Directory of the United States 1774–present
| U.S. House of Representatives | ||
|---|---|---|
| Preceded by Maine's 1st congressional district |
Home district of the Speaker of the House December 4, 1899 – March 4, 1903 |
Succeeded by Illinois's 18th congressional district |
Coordinates: 41°12′34″N 94°38′25″W / 41.20944°N 94.64028°W