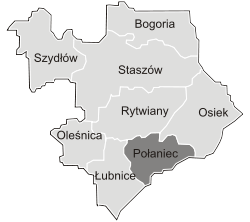
Gmina Połaniec[2][3] is an urban-rural gmina (administrative district) in Staszów County, Świętokrzyskie Voivodeship, in south-central Poland. Its seat is the town of Połaniec, which lies approximately 17 kilometres (11 mi) south-east of Staszów and 69 km (43 mi) south-east of the regional capital Kielce.
The gmina covers an area of 75.01 square kilometres (29.0 sq mi), and as of 2010 its total population is  11,848 (out of which the population of Połaniec amounts to 8,227, and the population of the rural part of the gmina is
  3,621).
Demography
According to the 2011 Poland census, there were 11,848 people residing in Połaniec Commune, of whom 49.8% were male and 50.2% were female (out of which the population in rural areas amounts to 3,621, of whom 50.4% were male and 49.6% were female). In the commune, the population was spread out with 19.1% under the age of 18, 40.6% from 18 to 44, 29% from 45 to 64, and 11.2% who were 65 years of age or older (out of which the population in rural areas amounts to 20.4% under the age of 18, 40.1% from 18 to 44, 22.5% from 45 to 64, and 17.0% who were 65 years of age or older).[1]
Table 1. Population level of commune in 2010 – by age group[1]
| SPECIFICATION |
Measure
unit |
POPULATION
(by age group in 2010) |
|---|
| TOTAL | 0–4 | 5–9 | 10–14 | 15–19 | 20–24 | 25–29 | 30–34 | 35–39 | 40–44 | 45–49 | 50–54 | 55–59 | 60–64 | 65–69 | 70–74 | 75–79 | 80–84 | 85 + |
| I. | TOTAL |
person | 11,848 | 621 | 557 | 640 | 798 | 1,123 | 1,168 | 831 | 691 | 654 | 936 | 1,233 | 952 | 598 | 257 | 268 | 221 | 179 | 121 |
| — | of which in |
% | 100 | 5.2 | 4.7 | 5.4 | 6.7 | 9.5 | 9.9 | 7 | 5.8 | 5.5 | 7.9 | 10.4 | 8 | 5 | 2.2 | 2.3 | 1.9 | 1.5 | 1 |
| 1. | BY SEX |
| A. | Males |
person | 5,903 | 324 | 279 | 335 | 393 | 563 | 626 | 430 | 357 | 307 | 425 | 636 | 500 | 314 | 124 | 112 | 80 | 73 | 25 |
| — | of which in |
% | 49.8 | 2.7 | 2.4 | 2.8 | 3.3 | 4.8 | 5.3 | 3.6 | 3 | 2.6 | 3.6 | 5.4 | 4.2 | 2.7 | 1 | 0.9 | 0.7 | 0.6 | 0.2 |
| B. | Females |
person | 5,945 | 297 | 278 | 305 | 405 | 560 | 542 | 401 | 334 | 347 | 511 | 597 | 452 | 284 | 133 | 156 | 141 | 106 | 96 |
| — | of which in |
% | 50.2 | 2.5 | 2.3 | 2.6 | 3.4 | 4.7 | 4.6 | 3.4 | 2.8 | 2.9 | 4.3 | 5 | 3.8 | 2.4 | 1.1 | 1.3 | 1.2 | 0.9 | 0.8 |
Table 2. Population level in rural areas in 2010 – by age group[1]
| SPECIFICATION |
Measure
unit |
POPULATION
(by age group in 2010) |
|---|
| TOTAL | 0–4 | 5–9 | 10–14 | 15–19 | 20–24 | 25–29 | 30–34 | 35–39 | 40–44 | 45–49 | 50–54 | 55–59 | 60–64 | 65–69 | 70–74 | 75–79 | 80–84 | 85 + |
| I. | TOTAL |
person | 3,621 | 187 | 202 | 198 | 261 | 303 | 326 | 257 | 226 | 229 | 241 | 269 | 217 | 179 | 116 | 148 | 97 | 106 | 59 |
| — | of which in |
% | 100 | 5.2 | 5.6 | 5.5 | 7.2 | 8.4 | 9 | 7.1 | 6.2 | 6.3 | 6.7 | 7.4 | 6 | 4.9 | 3.2 | 4.1 | 2.7 | 2.9 | 1.6 |
| 1. | BY SEX |
| A. | Males |
person | 1,825 | 104 | 113 | 103 | 136 | 159 | 162 | 141 | 113 | 111 | 121 | 157 | 122 | 88 | 50 | 58 | 34 | 38 | 15 |
| — | of which in |
% | 50.4 | 2.9 | 3.1 | 2.8 | 3.8 | 4.4 | 4.5 | 3.9 | 3.1 | 3.1 | 3.3 | 4.3 | 3.4 | 2.4 | 1.4 | 1.6 | 0.9 | 1 | 0.4 |
| B. | Females |
person | 1,796 | 83 | 89 | 95 | 125 | 144 | 164 | 116 | 113 | 118 | 120 | 112 | 95 | 91 | 66 | 90 | 63 | 68 | 44 |
| — | of which in |
% | 49.6 | 2.3 | 2.5 | 2.6 | 3.5 | 4 | 4.5 | 3.2 | 3.1 | 3.3 | 3.3 | 3.1 | 2.6 | 2.5 | 1.8 | 2.5 | 1.7 | 1.9 | 1.2 |
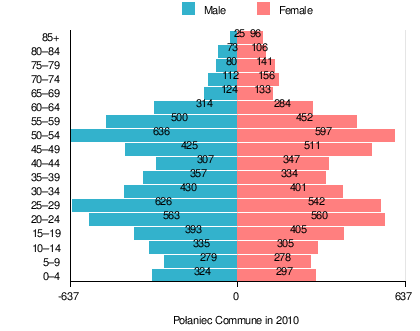
Figure 1. Population pyramid of commune in 2010 – by age group and sex[1]
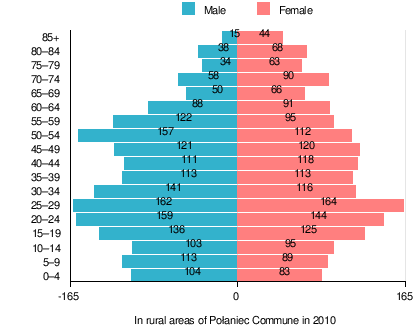
Figure 2. Population pyramid in rural areas in 2010 – by age group and sex[1]
Table 3. Population level of commune in 2010 – by sex[1]
| SPECIFICATION |
Measure
unit |
POPULATION
(by sex in 2010) |
|---|
| TOTAL | Males | Females |
| I. | TOTAL |
person | 11,848 | 5,903 | 5,945 |
| — | of which in |
% | 100 | 49.8 | 50.2 |
| 1. | BY AGE GROUP |
| A. | At pre-working age |
person | 2,268 | 1,155 | 1,113 |
| — | of which in |
% | 19.1 | 9.7 | 9.4 |
| B. | At working age. grand total |
person | 8,250 | 4,334 | 3,916 |
| — | of which in |
% | 69.6 | 36.6 | 33 |
| a. | at mobile working age |
person | 4,815 | 2,459 | 2,356 |
| — | of which in | % | 40.6 | 20.8 | 19.8 |
| b. | at non-mobile working age |
person | 3,435 | 1,875 | 1,560 |
| — | of which in | % | 29 | 15.8 | 13.2 |
| C. | At post-working age |
person | 1,330 | 414 | 916 |
| — | of which in |
% | 11.2 | 3.5 | 7.7 |
Table 4. Population level in rural areas in 2010 – by sex[1]
| SPECIFICATION |
Measure
unit |
POPULATION
(by sex in 2010) |
|---|
| TOTAL | Males | Females |
| I. | TOTAL |
person | 3,621 | 1,825 | 1,796 |
| — | of which in |
% | 100 | 50.4 | 49.6 |
| 1. | BY AGE GROUP |
| A. | At pre-working age |
person | 738 | 396 | 342 |
| — | of which in |
% | 20.4 | 10.9 | 9.4 |
| B. | At working age. grand total |
person | 2,266 | 1,234 | 1,032 |
| — | of which in |
% | 62.6 | 34.1 | 28.5 |
| a. | at mobile working age |
person | 1,451 | 746 | 705 |
| — | of which in | % | 40.1 | 20.6 | 19.5 |
| b. | at non-mobile working age |
person | 815 | 488 | 327 |
| — | of which in | % | 22.5 | 13.5 | 9 |
| C. | At post-working age |
person | 617 | 195 | 422 |
| — | of which in |
% | 17 | 5.4 | 11.7 |
Villages
Apart from the town of Połaniec, Gmina Połaniec contains the villages and settlements of Brzozowa, Kamieniec, Kraśnik, Łęg, Luszyca, Maśnik, Okrągła, Rudniki, Ruszcza, Ruszcza-Kępa, Rybitwy, Tursko Małe, Tursko Małe-Kolonia, Winnica, Wymysłów, Zawada, Zdzieci Nowe, Zdzieci Stare and Zrębin.
References
- 1 2 3 4 5 6 7 8 9 "Local Data Bank (Bank Danych Lokalnych) – Layout by NTS nomenclature (Układ wg klasyfikacji NTS)". demografia.stat.gov.pl: GUS. 10 March 2011.
- ↑ "Połaniec – miasto, gmina, powiat staszowski, województwo świętokrzyskie" [Połaniec – urban area, commune, Staszów County, Świętokrzyskie Province, Poland]. Topographical map prepared in 1:10,000 scale. Aerial and satellite orthophotomap (in Polish). Head Office of Geodesy and Cartography, Poland, Warsaw. 2011. geoportal.gov.pl. Archived from the original on 21 December 2012. Retrieved 27 April 2011.
- ↑ "Połaniec – obszar wiejski, gmina, powiat staszowski, województwo świętokrzyskie" [Połaniec – rural area, commune, Staszów County, Świętokrzyskie Province, Poland]. Topographical map prepared in 1:10,000 scale. Aerial and satellite orthophotomap (in Polish). Head Office of Geodesy and Cartography, Poland, Warsaw. 2011. geoportal.gov.pl. Retrieved 27 April 2011.
External links
|
|---|
| Town and seat | | |
|---|
| Parts of town |
- Barszczówka
- Daszyn
- Kolonia Połaniec
- Podskale
- Rychterówka
- Żapniów
|
|---|
| Villages | |
|---|
| Part of village | |
|---|
| Colonies | |
|---|
| Farmstead | |
|---|
| Smaller locality | |
|---|
|
|---|
| Seat | | |
|---|
| Urban-rural gminas | |
|---|
| Rural gminas | |
|---|