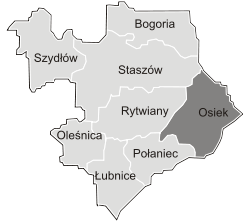
Gmina Osiek[2][3] is an urban-rural gmina (administrative district) in Staszów County, Świętokrzyskie Voivodeship, in south-central Poland. Its seat is the town of Osiek, which lies approximately 21 kilometres (13 mi) east of Staszów and 71 km (44 mi) south-east of the regional capital Kielce.
The gmina covers an area of 129.30 square kilometres (49.9 sq mi), and as of 2010 its total population is  7,904 (out of which the population of Osiek amounts to
  2,001, and the population of the rural part of the gmina is 5,903).
Demography
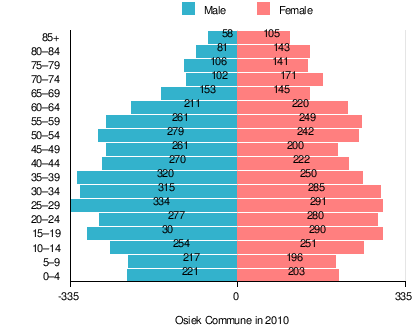
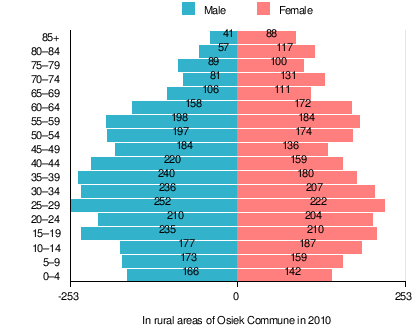
According to the 2011 Poland census, there were 7,904 people residing in Osiek Commune, of whom 50.9% were male and 49.1% were female (out of which the population in rural areas amounts to 5,903, of whom 51.2% were male and 48.8% were female). In the commune, the population was spread out with 21.2% under the age of 18, 39.3% from 18 to 44, 21.5% from 45 to 64, and 18% who were 65 years of age or older (out of which the population in rural areas amounts to 21.1% under the age of 18, 39.5% from 18 to 44, 20.9% from 45 to 64, and 18.5% who were 65 years of age or older).[1]
Table 1. Population level of commune in 2010 – by age group[1]
| SPECIFICATION |
Measure
unit |
POPULATION
(by age group in 2010) |
|---|
| TOTAL | 0–4 | 5–9 | 10–14 | 15–19 | 20–24 | 25–29 | 30–34 | 35–39 | 40–44 | 45–49 | 50–54 | 55–59 | 60–64 | 65–69 | 70–74 | 75–79 | 80–84 | 85 + |
| I. | TOTAL |
person | 7,904 | 424 | 413 | 505 | 590 | 557 | 625 | 600 | 570 | 492 | 461 | 521 | 510 | 431 | 298 | 273 | 247 | 224 | 163 |
| — | of which in |
% | 100 | 5.4 | 5.2 | 6.4 | 7.5 | 7 | 7.9 | 7.6 | 7.2 | 6.2 | 5.8 | 6.7 | 6.5 | 5.5 | 3.7 | 3.5 | 3.1 | 2.8 | 2 |
| 1. | BY SEX |
| A. | Males |
person | 4,020 | 221 | 217 | 254 | 300 | 277 | 334 | 315 | 320 | 270 | 261 | 279 | 261 | 211 | 153 | 102 | 106 | 81 | 58 |
| — | of which in |
% | 50.9 | 2.9 | 2.8 | 3.2 | 3.8 | 3.5 | 4.2 | 4 | 4 | 3.4 | 3.3 | 3.6 | 3.3 | 2.7 | 1.9 | 1.3 | 1.3 | 1 | 0.7 |
| B. | Females |
person | 3,884 | 203 | 196 | 251 | 290 | 280 | 291 | 285 | 250 | 222 | 200 | 242 | 249 | 220 | 145 | 171 | 141 | 143 | 105 |
| — | of which in |
% | 49.1 | 2.5 | 2.4 | 3.2 | 3.7 | 3.5 | 3.7 | 3.6 | 3.2 | 2.8 | 2.5 | 3.1 | 3.2 | 2.8 | 1.8 | 2.2 | 1.8 | 1.8 | 1.3 |
Table 2. Population level in rural areas in 2010 – by age group[1]
| SPECIFICATION |
Measure
unit |
POPULATION
(by age group in 2010) |
|---|
| TOTAL | 0–4 | 5–9 | 10–14 | 15–19 | 20–24 | 25–29 | 30–34 | 35–39 | 40–44 | 45–49 | 50–54 | 55–59 | 60–64 | 65–69 | 70–74 | 75–79 | 80–84 | 85 + |
| I. | TOTAL |
person | 5,903 | 308 | 332 | 364 | 445 | 414 | 474 | 443 | 420 | 379 | 320 | 371 | 382 | 330 | 217 | 212 | 189 | 174 | 129 |
| — | of which in |
% | 100 | 5.2 | 5.6 | 6.2 | 7.5 | 7 | 8 | 7.5 | 7.1 | 6.4 | 5.4 | 6.3 | 6.5 | 5.6 | 3.7 | 3.6 | 3.2 | 2.9 | 2.2 |
| 1. | BY SEX |
| A. | Males |
person | 3,020 | 166 | 173 | 177 | 235 | 210 | 252 | 236 | 240 | 220 | 184 | 197 | 198 | 158 | 106 | 81 | 89 | 57 | 41 |
| — | of which in |
% | 51.2 | 2.8 | 2.9 | 3 | 4 | 3.6 | 4.3 | 4 | 4.1 | 3.7 | 3.1 | 3.3 | 3.4 | 2.7 | 1.8 | 1.4 | 1.5 | 1 | 0.7 |
| B. | Females |
person | 2,883 | 142 | 159 | 187 | 210 | 204 | 222 | 207 | 180 | 159 | 136 | 174 | 184 | 172 | 111 | 131 | 100 | 117 | 88 |
| — | of which in |
% | 48.8 | 2.4 | 2.7 | 3.2 | 3.6 | 3.5 | 3.8 | 3.5 | 3 | 2.7 | 2.3 | 2.9 | 3.1 | 2.9 | 1.9 | 2.2 | 1.7 | 2 | 1.5 |
Figure 1. Population pyramid of commune in 2010 – by age group and sex[1]
Figure 2. Population pyramid in rural areas in 2010 – by age group and sex[1]
Table 3. Population level of commune in 2010 – by sex[1]
| SPECIFICATION |
Measure
unit |
POPULATION
(by sex in 2010) |
|---|
| TOTAL | Males | Females |
| I. | TOTAL |
person | 7,904 | 4,020 | 3,884 |
| — | of which in |
% | 100 | 50.9 | 49.1 |
| 1. | BY AGE GROUP |
| A. | At pre-working age |
person | 1,672 | 865 | 807 |
| — | of which in |
% | 21.2 | 11 | 10.2 |
| B. | At working age, grand total |
person | 4,807 | 2,655 | 2,152 |
| — | of which in |
% | 60.8 | 33.6 | 27.2 |
| a. | at mobile working age |
person | 3,104 | 1,643 | 1,461 |
| — | of which in | % | 39.3 | 20.8 | 18.5 |
| b. | at non-mobile working age |
person | 1,703 | 1,012 | 691 |
| — | of which in | % | 21.5 | 12.8 | 8.7 |
| C. | At post-working age |
person | 1,425 | 500 | 925 |
| — | of which in |
% | 18 | 6.3 | 11.7 |
Table 4. Population level in rural areas in 2010 – by sex[1]
| SPECIFICATION |
Measure
unit |
POPULATION
(by sex in 2010) |
|---|
| TOTAL | Males | Females |
| I. | TOTAL |
person | 5,903 | 3,020 | 2,883 |
| — | of which in |
% | 100 | 51.2 | 48.8 |
| 1. | BY AGE GROUP |
| A. | At pre-working age |
person | 1,247 | 650 | 597 |
| — | of which in |
% | 21.1 | 11 | 10.1 |
| B. | At working age. grand total |
person | 3,563 | 1,996 | 1,567 |
| — | of which in |
% | 60.4 | 33.8 | 26.5 |
| a. | at mobile working age |
person | 2,332 | 1,259 | 1,073 |
| — | of which in | % | 39.5 | 21.3 | 18.2 |
| b. | at non-mobile working age |
person | 1,231 | 737 | 494 |
| — | of which in | % | 20.9 | 12.5 | 8.4 |
| C. | At post-working age |
person | 1,093 | 374 | 719 |
| — | of which in |
% | 18.5 | 6.3 | 12.2 |
Villages
Apart from the town of Osiek, Gmina Osiek contains the villages and settlements of Bukowa, Długołęka, Kąty, Łęg, Lipnik, Matiaszów, Mikołajów, Mucharzew, Nakol, Niekrasów, Niekurza, Ossala, Ossala-Lesisko, Pliskowola, Strużki, Suchowola, Sworoń, Szwagrów, Trzcianka, Trzcianka-Kolonia and Tursko Wielkie.
References
- 1 2 3 4 5 6 7 8 9 "Local Data Bank (Bank Danych Lokalnych) – Layout by NTS nomenclature (Układ wg klasyfikacji NTS)". demografia.stat.gov.pl: GUS. 10 March 2011.
- ↑ "Osiek – miasto, gmina, powiat staszowski, województwo świętokrzyskie" [Osiek – urban area, commune, Staszów County, Świętokrzyskie Province, Poland]. Topographical map prepared in 1:10,000 scale. Aerial and satellite orthophotomap (in Polish). Head Office of Geodesy and Cartography, Poland, Warsaw. 2011. geoportal.gov.pl. Archived from the original on 21 December 2012. Retrieved 27 April 2011.
- ↑ "Osiek – obszar wiejski, gmina, powiat staszowski, województwo świętokrzyskie" [Osiek – rural area, commune, Staszów County, Świętokrzyskie Province, Poland]. Topographical map prepared in 1:10,000 scale. Aerial and satellite orthophotomap (in Polish). Head Office of Geodesy and Cartography, Poland, Warsaw. 2011. geoportal.gov.pl. Archived from the original on 21 December 2012. Retrieved 27 April 2011.
External links
|
|---|
| Town and seat | | |
|---|
| Parts of town |
- Gaj
- Gaj Osiecki
- Grabowiec
- Grobla
- Osieczko
- Osieczko-Kolonia
- Parysówka
|
|---|
| Villages | |
|---|
| Parts of village |
- Gajówka
- Nowe Tursko
- Otoka Gągolińska
- Tursko Wielkie-Karczmisko
- Tursko Wielkie-Kolonia
- Tursko Wielkie-Koziarówka
- Tursko Wielkie-Zagumnie
|
|---|
| Colony | |
|---|
| Hamlet | |
|---|
| Smaller locality | |
|---|
|
|---|
| Seat | | |
|---|
| Urban-rural gminas | |
|---|
| Rural gminas | |
|---|