Fuel economy in aircraft

Fuel economy in aircraft is a measure of how much fuel an aircraft, or a fleet of aircraft of mixed types, needs to operate in relation to a service provided (i.e. number of passengers or ton of freight) and the distance between points of travel. It can be expressed in several ways, for example by the litres of fuel consumed per passenger per kilometer.
Flight efficiency theory
A powered aircraft counters its weight through aerodynamic lift and counters its aerodynamic drag with thrust. The aircraft's maximum range is determined by the level of efficiency with which thrust can be applied to overcome the aerodynamic drag.
Aerodynamics
A subfield of fluid dynamics, aerodynamics studies the physics of a body moving through the air. As lift and drag are functions of air speed, their relationships are major determinants of an aircraft's design efficiency.
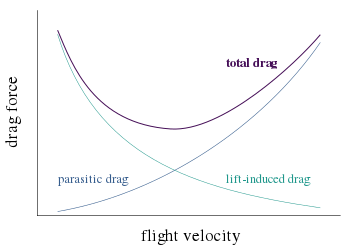
Aircraft efficiency is augmented by maximizing lift-to-drag ratio, which is attained by minimizing parasitic drag and lift-generated induced drag, the two components of aerodynamic drag. As parasitic drag increases and induced drag decreases with speed, there is an optimum speed where the sum of both is minimal; this is the best glide ratio. For powered aircraft, the optimum glide ratio has to be balanced with thrust efficiency.
Parasitic drag is constituted by form drag and skin-friction drag, and grows with the square of the speed in the drag equation. The form drag is minimized by having the smallest frontal area and by streamlining the aircraft for a low drag coefficient, while skin friction is proportional to the body's surface area and can be reduced by maximizing laminar flow.
Induced drag can be reduced by decreasing the size of the airframe, fuel and payload weight, and by increasing the wing aspect ratio or by using wingtip devices at the cost of increased structure weight.
Design speed
By increasing efficiency, a lower cruise-speed augments the range and reduces the environmental impact of aviation; however, a higher cruise-speed allows more revenue passenger miles flown per day.
Jet engine efficiency increases with velocity because the speed difference between the flight and the exhaust is lower. However, above the drag divergence Mach number, the aerodynamic drag on the airframe overwhelms this effect because supersonic shockwaves begin to form, greatly increasing drag and needing supercritical airfoil designs for transonic flight.
For supersonic flight, drag increases at Mach 1.0 but decreases again after the transition. With a specifically designed aircraft, such as the (in development) Aerion AS2, the Mach 1.1 range at 3,700 nmi is 70% of the maximum range of 5,300 nmi at Mach 0.95, but increases to 4,750 nmi at Mach 1.4 for 90% before falling again.[1]
Wingtip devices
Wingtip devices increase the effective wing-aspect ratio, lowering lift-induced drag caused by wingtip vortices and improving the lift-to-drag ratio without increasing the wingspan. (Wingspan is limited by the available width in the ICAO Aerodrome Reference Code.) Airbus installed wingtip fences on its planes since the A310-300 in 1985, and Sharklet blended-winglets for the A320 were launched during the November 2009 Dubai air show. Their installation adds 200 kilograms (440 lb) but offers a 3.5% fuel burn reduction on flights over 2,800 km (1,500 nmi).[2]
Weight
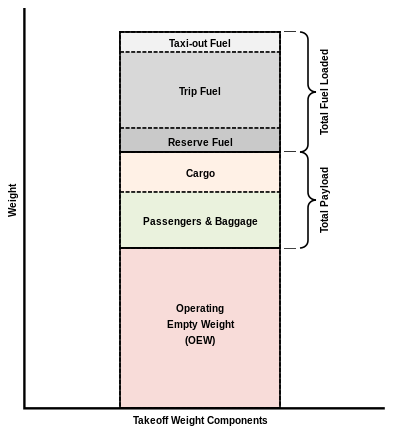
As the weight indirectly generates lift-induced drag, its minimization leads to better aircraft efficiency. For a given payload, a lighter airframe generates a lower drag. Minimizing weight can be achieved through the airframe's configuration, materials science and construction methods. To obtain a longer range, a larger fuel fraction of the maximum takeoff weight is needed, adversely affecting efficiency.
The deadweight of the airframe and fuel is non-payload that must be lifted to altitude and kept aloft, contributing to fuel consumption. A reduction in airframe weight enables the use of smaller, lighter engines. The weight savings in both allow for a lighter fuel load for a given range and payload. A rule-of-thumb is that a reduction in fuel consumption of about 0.75% results from each 1% reduction in weight.[3]
The 84-ton maximum payload of a modern Airbus A380 represents 14.6% of its 575-ton maximum take-off weight. There remains considerable room for future improvements in weight reduction. The weight of an aircraft can be reduced by using light-weight materials such as titanium, carbon fiber and other composite plastics. Expensive materials may be used if the reduction of mass justifies the price of materials through improved fuel efficiency over the aircraft's lifetime. Any improvements in fuel efficiency reduce the amount of fuel an aircraft must carry, which reduces the take-off weight of the aircraft and provides further gains in fuel efficiency. For example, the Airbus A380 design includes multiple light-weight materials. The Boeing 787 Dreamliner was the first major commercial airplane to have a composite fuselage, composite wings, and use composites in most other airframe components.[4]
Flight distance
For long-haul flights, the airplane needs to carry additional fuel, leading to higher fuel consumption. Above a certain distance it becomes more fuel-efficient to make a halfway stop to refuel despite the energy losses in descent and climb. For example, a Boeing 777-300 reaches the tipping point at 3,000 nautical miles (5,600 km). It is more fuel-efficient to make a non-stop flight below this distance and to make a stop when covering a longer total distance.[5]

Very long non-stop passenger flights suffer from the weight penalty of the extra fuel required, which means limiting the number of available seats to compensate. For such flights, the critical fiscal factor is the quantity of fuel burnt per seat-nautical mile.[6] For these reasons the world's longest commercial flights were cancelled c. 2013. An example is Singapore Airlines' former New York to Singapore flight, which could carry only 100 passengers (all business class) on the 10,300-mile (16,600 km) flight. According to an industry analyst, "It [was] pretty much a fuel tanker in the air."[7]
In the late 2000s/early 2010s, rising fuel prices coupled with the Great Recession caused the cancellation of many ultra-long haul, non-stop flights. This included the services provided by Singapore Airlines from Singapore to both Newark and Los Angeles that was ended in late 2013.[8][9] But as fuel prices have since decreased and more fuel efficient aircraft have come into service, many ultra-long haul routes have been reinstated or newly scheduled[10] (see Longest flights).
Propulsive efficiency
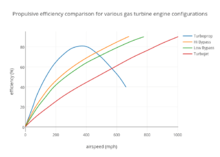
To get thrust, an aircraft engine is either a shaft engine – piston engine or turboprop, with its efficiency measured by its brake-specific fuel consumption – coupled with a propeller having its own propulsive efficiency; or a jet engine with its efficiency measured by its thrust-specific fuel consumption.
Turboprops have an optimum speed below 460 miles per hour (740 km/h).[11] This is less than jets used by major airlines today, but there is reduced drag at the lower speed.
Jet fuel cost and emissions reduction have renewed interest in the propfan concept for jetliners with an emphasis on engine/airframe efficiency that might come into service beyond the Boeing 787 and Airbus A350XWB. For instance, Airbus has patented aircraft designs with twin rear-mounted counter-rotating propfans.[12] Propfans are a more fuel-efficient technology than jet engines or turboprops. NASA has conducted an Advanced Turboprop Project (ATP), where they researched a variable-pitch propfan that produced less noise and achieved high speeds.
Operations
.jpg)
Speed
At constant propulsive efficiency, the maximum range speed is when the ratio between velocity and drag is minimal,[13] while maximum endurance is attained at the best lift-to-drag ratio.
Altitude
Air density decreases with altitude, thus lowering drag, assuming the aircraft maintains a constant equivalent airspeed. This means an aircraft may be more efficient at higher altitude. With increasing altitude, air pressure and temperature both decrease, causing the maximum power or thrust of aircraft engines to reduce. In a piston engine, this trend towards decline in maximum power can be mitigated by installation of a turbocharger. Decreasing air temperature with altitude increases thermal efficiency.
Airlines
.jpg)
Fuel economy in air transport comes from aircraft fuel efficiency combined with airline efficiency: seating configuration, passenger load factor and air cargo. For instance, over the transatlantic route, the most-active intercontinental market, the average fuel consumption in 2017 was 34 pax-km per L (2.94 L/100 km [80 mpg‑US] per passenger). The most fuel-efficient airline was Norwegian Air Shuttle with 44 pax-km/L (2.27 L/100 km [104 mpg‑US] per passenger), thanks to its fuel-efficient Boeing 787-8, a high 85% passenger load factor and a high density of 1.36 seat/m2 due to a low 9% premium seating. On the other side, the least efficient was British Airways at 27 pax-km/L (3.7 L/100 km [64 mpg‑US] per passenger), using fuel-inefficient Boeing 747-400s with a low density of 0.75 seat/m2 due to a high 25% premium seating, in spite of a high 82% load factor.[14]
In 2016, over the transpacific routes, the average fuel consumption was 31 pax-km per L (3.23 L/100 km [73 mpg‑US] per passenger). The most fuel-efficient were Hainan Airlines and ANA with 36 pax-km/L (2.78 L/100 km [85 mpg‑US] per passenger) while Qantas was the least efficient at 22 pax-km/L (4.55 L/100 km [51.7 mpg‑US] per passenger). Key drivers for efficiency were the air freight share for 48%, seating density for 24%, aircraft fuel burn for 16% and passenger load factor for 12%.[15]
MSCI ranked Ryanair as the lowest-emissions-intensity airline in its ACWI index with 75 g CO2-e/revenue passenger kilometre in 2014 – below Easyjet at 82 g, the average at 123 g and Lufthansa at 132 g – by using high-density 189-seat Boeing 737-800s. In 2015 Ryanair emitted 8.64 Bn t of CO2 for 545,034 sectors flown: 15.85 t per 776 mi (674 nmi; 1,249 km) average sector (or 5.04 t of fuel: 4.04 kg/km) representing 95 kg per 90.6 million passengers (30.4 kg of fuel: 3.04 L/100 km or 76 g CO2/km).[16]
The Aeroflot Group fuel consumption is 22.9g/ASK, or 2.86 L/100 km (82 mpg‑US) per seat, 3.51 L/100 km (67.0 mpg‑US) per passenger at its 81.5% load factor.[17] In 2016, Cathay Pacific and Cathay Dragon consumed 4,571,000 tonnes of fuel to transport 123,478 million revenue passenger kilometers, or 37 g/RPK, 25% better than in 1998: 4.63 L/100 km (50.8 mpg‑US).[18] From 2010 to 2012, the most fuel-efficient US domestic airline was Alaska Airlines, due partly to its regional affiliate Horizon Air flying turboprops – it would otherwise be second to Spirit Airlines.[19]
Procedures
.jpg)
Airbus presented the following measures to save fuel, in its example of an A330 flying 2,500 nautical miles (4,600 km) on a route like Bangkok–Tokyo: direct routing saves 190 kg (420 lb) fuel by flying 40 km (25 mi) less; 600 kg (1,300 lb) more fuel is consumed if flying 600 m (2,000 ft) below optimum altitude without vertical flight profile optimization; cruising 0.01 mach above optimum consumes 800 kg (1,800 lb) more fuel; 1,000 kg (2,200 lb) more fuel on board consumes 150 kg (330 lb) more fuel while 100 litres (22 imp gal; 26 US gal) of unused potable water consumes 15 kg (33 lb) more fuel.[20]
Operational procedures can save 35 kg (77 lb) fuel for every 10-minute reduction in use of the Auxiliary power unit (APU), 15 kg (33 lb) with a reduced flap approach and 30 kg (66 lb) with reduced thrust reversal on landing.[20] Maintenance can also save fuel: 100 kg (220 lb) more fuel is consumed without an engine wash schedule; 50 kg (110 lb) with a 5 mm (0.20 in) slat rigging gap, 40 kg (88 lb) with a 10 mm (0.39 in) spoiler rigging gap, and 15 kg (33 lb) with a damaged door seal.[20]
History
Past
Modern jet aircraft have twice the fuel efficiency of the earliest jet airliners.[21] Late 1950s piston airliners like the Lockheed L-1049 Super Constellation and DC-7 were 1% to 28% more energy-intensive than 1990s jet airliners which cruise 40 to 80% faster.[22] The early jet airliners were designed at a time when air crew labor costs were higher relative to fuel costs. Despite the high fuel consumption, because fuel was inexpensive in that era the higher speed resulted in favorable economical returns since crew costs and amortization of capital investment in the aircraft could be spread over more seat-miles flown per day.[23] Productivity including speed went from around 150 ASK/MJ*km/h for the 1930s DC-3 to 550 for the L-1049 in the 1950s, and from 200 for the DH-106 Comet 3 to 900 for the 1990s B737-800.[24]
Today's turboprop airliners have better fuel-efficiency than current jet airliners, in part because of their lower cruising speed and propellers that are more efficient than those of the 1950s-era piston-powered airlines.[19]
.jpg)
Jet aircraft efficiency is improving: between 1960 and 2000 there was a 55% overall fuel-efficiency gain (as compared to the Boeing 707).[22] Most of the improvements in efficiency were gained in the first decade when jet craft first came into widespread commercial use. Between 1971 and 1998 the fleet-average annual improvement per available seat-kilometre was estimated at 2.4%. Nonetheless, from the 1960s to the present, total fleet emissions of the greenhouse gas CO2 have outpaced efficiency gains, due to growth in the air-travel market.[26]
Concorde, a supersonic transport, managed about 17 passenger-miles to the Imperial gallon, which is 16.7 L/100 km per passenger; similar to a business jet, but much worse than a subsonic turbofan aircraft. Airbus states a fuel rate consumption of their A380 at less than 3 L/100 km per passenger (78 passenger-miles per US gallon);[27] however this is for an unspecified number and configuration of seats. The maximum configuration is 850 economy passengers, but with a typical 525-seat multi-class configuration the fuel consumption is "comparable to that of a B747-400ER and even about 15% worse than a B777-300ER on a passenger-mile basis."[28]
Example values
The aviation fuel density used is 6.7 lb/USgal or 0.8 kg/l.
Commuter flights
For flights of 300 nmi (560 km):
| Model | First flight | Seats | Fuel burn | Fuel per seat |
|---|---|---|---|---|
| ATR 42-500 | 1995 | 48 | 1.26 kg/km (4.5 lb/mi) | 3.15 L/100 km (75 mpg‑US)[29] |
| ATR 72-500 | 1997 | 70 | 1.42 kg/km (5.0 lb/mi) | 2.53 L/100 km (93 mpg‑US)[29] |
| Beechcraft 1900D (226 nm) | 1982 | 19 | 1.00 kg/km (3.56 lb/mi) | 6.57 L/100 km (35.8 mpg‑US)[30] |
| Bombardier Dash 8 Q400 | 1998 | 78 | 2.16 kg/km (7.7 lb/mi) | 3.46 L/100 km (68.0 mpg‑US)[31] |
| Dornier 228 | 1981 | 19 | 0.94 kg/km (3.3 lb/mi) | 6.22 L/100 km (37.8 mpg‑US)[32] |
| Dornier 328 | 1991 | 32 | 1.22 kg/km (4.3 lb/mi) | 4.76 L/100 km (49.4 mpg‑US)[33] |
| Embraer Brasilia | 1983 | 30 | 0.92 kg/km (3.3 lb/mi) | 3.82 L/100 km (61.6 mpg‑US)[34] |
| Pilatus PC-12 (500 nm) | 1991 | 9 | 0.41 kg/km (1.5 lb/mi) | 5.66 L/100 km (41.6 mpg‑US)[35] |
| Saab 340 | 1983 | 32 | 1.1 kg/km (3.9 lb/mi) | 4.29 L/100 km (54.8 mpg‑US)[36]
|
| Saab 2000 | 1992 | 50 | 1.75 kg/km (6.2 lb/mi) | 4.39 L/100 km (53.6 mpg‑US)[37] |
| Xian MA700 | 2019 | 78 | 1.69 kg/km (6.0 lb/mi) | 2.71 L/100 km (87 mpg‑US)[38] |
Regional flights
For flights of 500–660 nmi (930–1,220 km)
| Model | First flight | Seats | Sector | Fuel burn | Fuel efficiency per seat |
|---|---|---|---|---|---|
| Airbus A319neo | 2015 | 144 | 600 nmi (1,100 km) | 3.37 kg/km (11.94 lb/mi) | 2.92 L/100 km (80.6 mpg‑US)[39] |
| Airbus A319neo | 2015 | 124 | 660 nmi (1,220 km) | 2.82 kg/km (10 lb/mi) | 2.82 L/100 km (83.5 mpg‑US)[40] |
| Airbus A320neo | 2015 | 154 | 660 nmi (1,220 km) | 2.79 kg/km (9.9 lb/mi) | 2.25 L/100 km (104.7 mpg‑US)[40] |
| Airbus A321neo | 2015 | 192 | 660 nmi (1,220 km) | 3.30 kg/km (11.7 lb/mi) | 2.19 L/100 km (107.4 mpg‑US)[40] |
| Boeing 737-300 | 1984 | 126 | 507 nmi (939 km) | 3.49 kg/km (12.4 lb/mi) | 3.46 L/100 km (68 mpg‑US)[41] |
| Boeing 737-600 | 1998 | 110 | 500 nmi (930 km) | 3.16 kg/km (11.2 lb/mi) | 3.59 L/100 km (65.5 mpg‑US)[42] |
| Boeing 737-700 | 1997 | 126 | 500 nmi (930 km) | 3.21 kg/km (11.4 lb/mi) | 3.19 L/100 km (74 mpg‑US)[42] |
| Boeing 737 MAX 7 | 2017 | 128 | 660 nmi (1,220 km) | 2.85 kg/km (10.1 lb/mi) | 2.77 L/100 km (84.8 mpg‑US)[40] |
| Boeing 737 MAX 7 | 2017 | 144 | 600 nmi (1,100 km) | 3.39 kg/km (12.01 lb/mi) | 2.93 L/100 km (80.2 mpg‑US)[39] |
| Boeing 737-800 | 1997 | 162 | 500 nmi (930 km) | 3.59 kg/km (12.7 lb/mi) | 2.77 L/100 km (85 mpg‑US)[42] |
| Boeing 737 MAX 8 | 2017 | 166 | 660 nmi (1,220 km) | 3.04 kg/km (10.8 lb/mi) | 2.28 L/100 km (103.2 mpg‑US)[40] |
| Boeing 737-900ER | 2006 | 180 | 500 nmi (930 km) | 3.83 kg/km (13.6 lb/mi) | 2.66 L/100 km (88 mpg‑US)[42] |
| Boeing 737 MAX 9 | 2017 | 180 | 660 nmi (1,220 km) | 3.30 kg/km (11.7 lb/mi) | 2.3 L/100 km (103 mpg‑US)[40] |
| Boeing 757-200 | 1982 | 200 | 500 nmi (930 km) | 4.68 kg/km (16.61 lb/mi) | 2.91 L/100 km (80.7 mpg‑US)[43] |
| Boeing 757-300 | 1998 | 243 | 500 nmi (930 km) | 5.19 kg/km (18.41 lb/mi) | 2.66 L/100 km (88.4 mpg‑US)[43] |
| Bombardier CRJ1000 | 2009 | 100 | 500 nmi (930 km) | 2.66 kg/km (9.4 lb/mi) | 3.33 L/100 km (71 mpg‑US) [44] |
| Airbus A220 100 | 2013 | 115 | 600 nmi (1,100 km) | 2.8 kg/km (10.1 lb/mi) | 3.07 L/100 km (76.7 mpg‑US)[39] |
| Airbus A220 300 | 2015 | 140 | 600 nmi (1,100 km) | 3.10 kg/km (11.01 lb/mi) | 2.75 L/100 km (85.6 mpg‑US)[39] |
| Airbus A220-100 | 2013 | 125 | 500 nmi (930 km) | 2.57 kg/km (9.1 lb/mi) | 2.57 L/100 km (92 mpg‑US)[45] |
| Airbus A220-300 | 2015 | 160 | 500 nmi (930 km) | 2.85 kg/km (10.11 lb/mi) | 2.23 L/100 km (105 mpg‑US)[46] |
| Bombardier Dash 8 Q400 | 1998 | 82 | 600 nmi (1,100 km) | 1.83 kg/km (6.5 lb/mi) | 2.79 L/100 km (84 mpg‑US)[47] |
| Dornier 328 | 1991 | 31 | 600 nmi (1,100 km) | 1.08 kg/km (3.8 lb/mi) | 4.35 L/100 km (54.1 mpg‑US)[48] |
| Embraer E-Jet E2-175 | 2020 | 88 | 600 nmi (1,100 km) | 2.44 kg/km (8.64 lb/mi) | 3.44 L/100 km (68.3 mpg‑US)[39] |
| Embraer E-Jet E2-190 | 2018 | 106 | 600 nmi (1,100 km) | 2.83 kg/km (10.04 lb/mi) | 3.32 L/100 km (70.8 mpg‑US)[39] |
| Embraer E-Jet E2-195 | 2019 | 132 | 600 nmi (1,100 km) | 3.07 kg/km (10.91 lb/mi) | 2.9 L/100 km (81 mpg‑US)[39] |
| Embraer E-Jet-190 | 2002 | 98 | 500 nmi (930 km) | 2.98 kg/km (10.6 lb/mi) | 3.81 L/100 km (61.7 mpg‑US)[49] |
| Saab 340 | 1983 | 31 | 500 nmi (930 km) | 0.95 kg/km (3.4 lb/mi) | 3.83 L/100 km (61.4 mpg‑US)[36] |
| Saab 2000 | 1992 | 50 | 500 nmi (930 km) | 1.54 kg/km (5.5 lb/mi) | 3.85 L/100 km (61.1 mpg‑US)[37] |
| Sukhoi SSJ100 | 2008 | 98 | 500 nmi (930 km) | 2.81 kg/km (10.0 lb/mi) | 3.59 L/100 km (65.5 mpg‑US)[49] |
| Xian MA700 | 2019 | 78 | 650 nmi (1,200 km) | 1.56 kg/km (5.5 lb/mi) | 2.5 L/100 km (94 mpg‑US)[38] |
Short-haul flights
For flights of 1,000 nmi (1,900 km):
| Model | First flight | Seats | Fuel Burn | Fuel efficiency per seat |
|---|---|---|---|---|
| Airbus A319 | 1995 | 124 | 2.93 kg/km (10.4 lb/mi) | 2.95 L/100 km (80 mpg‑US)[50] |
| Airbus A319Neo | 2015 | 136 | 2.4 kg/km (8.6 lb/mi) | 1.93 L/100 km (122 mpg‑US)[25] |
| Airbus A320 | 1987 | 150 | 3.13 kg/km (11.1 lb/mi) | 2.61 L/100 km (90 mpg‑US)[50] |
| Airbus A321-200 | 1996 | 180 | 3.61 kg/km (12.8 lb/mi) | 2.5 L/100 km (94 mpg‑US)[50] |
| Airbus A330-200 | 1997 | 293 | 5.6 kg/km (19.8 lb/mi) | 2.37 L/100 km (99 mpg‑US)[50] |
| Boeing 737-600 | 1998 | 110 | 2.77 kg/km (9.8 lb/mi) | 3.15 L/100 km (75 mpg‑US)[42] |
| Boeing 737-700 | 1997 | 126 | 2.82 kg/km (10.0 lb/mi) | 2.79 L/100 km (84 mpg‑US)[42] |
| Boeing 737-700 | 1997 | 128 | 2.8 kg/km (9.9 lb/mi) | 2.71 L/100 km (87 mpg‑US)[50] |
| Boeing 737 MAX-7 | 2017 | 140 | 2.51 kg/km (8.91 lb/mi) | 1.94 L/100 km (121 mpg‑US)[25] |
| Boeing 737-800 | 1997 | 162 | 3.17 kg/km (11.2 lb/mi) | 2.44 L/100 km (96 mpg‑US)[42] |
| Boeing 737-800 | 1997 | 160 | 3.45 kg/km (12.23 lb/mi) | 2.68 L/100 km (88 mpg‑US)[50] |
| Boeing 737-800W | 1997 | 162 | 3.18 kg/km (11.3 lb/mi) | 2.45 L/100 km (96 mpg‑US)[51] |
| Boeing 737 MAX-8 | 2017 | 162 | 2.71 kg/km (9.6 lb/mi) | 2.04 L/100 km (115 mpg‑US)[51] |
| Boeing 737-900ER | 2006 | 180 | 3.42 kg/km (12.1 lb/mi) | 2.38 L/100 km (99 mpg‑US)[42] |
| Boeing 737-900ERW | 2006 | 180 | 3.42 kg/km (12.1 lb/mi) | 2.37 L/100 km (99 mpg‑US)[51] |
| Boeing 737 MAX-9 | 2017 | 180 | 2.91 kg/km (10.3 lb/mi) | 2.02 L/100 km (116 mpg‑US)[51] |
| Boeing 757-200 | 1982 | 190 | 4.60 kg/km (16.33 lb/mi) | 3.02 L/100 km (78 mpg‑US)[50] |
| Boeing 757-200 | 1982 | 200 | 4.16 kg/km (14.76 lb/mi) | 2.59 L/100 km (90.8 mpg‑US)[43] |
| Boeing 757-300 | 1998 | 243 | 4.68 kg/km (16.62 lb/mi) | 2.4 L/100 km (98 mpg‑US)[43] |
| Airbus A220-100 | 2013 | 125 | 2.28 kg/km (8.1 lb/mi) | 2.28 L/100 km (103 mpg‑US)[45] |
| Airbus A220-300 | 2015 | 160 | 2.56 kg/km (9.08 lb/mi) | 2.00 L/100 km (118 mpg‑US)[46] |
| Airbus A220-300 | 2015 | 135 | 2.30 kg/km (8.17 lb/mi) | 1.85 L/100 km (127 mpg‑US)[25] |
| Quest Kodiak | 2004 | 9 | 0.71 kg/km (2.52 lb/mi) | 6.28 L/100 km (37.5 mpg‑US)[52] |
Medium-haul flights
For flights of 1,750–3,400 nmi (3,240–6,300 km). The larger end of this range includes transatlantic flights (e.g. New York JFK – London-Heathrow is 3,000 nmi).[53]
| Model | First flight | Seats | Sector | Fuel burn | Fuel per seat |
|---|---|---|---|---|---|
| Airbus A320 | 1987 | 150 | 2,151 nmi (3,984 km) | 2.91 kg/km (10.3 lb/mi) | 2.43 L/100 km (97 mpg‑US)[54] |
| Airbus A321NeoLR | 2016 | 154 | 3,400 nmi (6,300 km) | 2.99 kg/km (10.6 lb/mi) | 2.43 L/100 km (97 mpg‑US)[55] |
| Airbus A330-200 | 1997 | 241 | 3,000 nmi (5,600 km) | 6 kg/km (21 lb/mi) | 3.11 L/100 km (76 mpg‑US)[56] |
| Airbus A330-300 | 1992 | 262 | 3,000 nmi (5,600 km) | 6.25 kg/km (22.2 lb/mi) | 2.98 L/100 km (79 mpg‑US)[56] |
| Airbus A330neo-900 | 2016 | 310 | 3,350 nmi (6,200 km) | 6 kg/km (21 lb/mi) | 2.42 L/100 km (97 mpg‑US)[57] |
| Airbus A340-300 | 1992 | 262 | 3,000 nmi (5,600 km) | 6.81 kg/km (24.2 lb/mi) | 3.25 L/100 km (72 mpg‑US)[56] |
| Boeing 737 MAX-8 | 2017 | 168 | 3,400 nmi (6,300 km) | 2.86 kg/km (10.1 lb/mi) | 2.13 L/100 km (110 mpg‑US)[58] |
| Boeing 737 MAX-9 | 2017 | 144 | 3,400 nmi (6,300 km) | 2.91 kg/km (10.3 lb/mi) | 2.53 L/100 km (93 mpg‑US)[55] |
| Boeing 747-400 | 1988 | 416 | 2,151 nmi (3,984 km) | 10.77 kg/km (38.2 lb/mi) | 3.24 L/100 km (73 mpg‑US)[54] |
| Boeing 747-8 | 2011 | 467 | 3,000 nmi (5,600 km) | 9.9 kg/km (35 lb/mi) | 2.65 L/100 km (89 mpg‑US)[59] |
| Boeing 757-200W | 1981 | 158 | 3,400 nmi (6,300 km) | 3.79 kg/km (13.4 lb/mi) | 3 L/100 km (78 mpg‑US)[55] |
| Boeing 767-200ER | 1984 | 181 | 3,000 nmi (5,600 km) | 4.83 kg/km (17.1 lb/mi) | 3.34 L/100 km (70 mpg‑US)[60] |
| Boeing 767-200ER | 1984 | 193 | 3,400 nmi (6,300 km) | 5.01 kg/km (17.8 lb/mi) | 3.25 L/100 km (72 mpg‑US)[55] |
| Boeing 767-200ER | 1984 | 224 | 3,000 nmi (5,600 km) | 4.93 kg/km (17.5 lb/mi) | 2.75 L/100 km (86 mpg‑US)[60] |
| Boeing 767-300ER | 1988 | 218 | 2,151 nmi (3,984 km) | 5.38 kg/km (19.1 lb/mi) | 3.09 L/100 km (76 mpg‑US)[54] |
| Boeing 767-300ER | 1988 | 218 | 3,000 nmi (5,600 km) | 5.39 kg/km (19.1 lb/mi) | 3.09 L/100 km (76 mpg‑US)[60] |
| Boeing 767-300ER | 1988 | 269 | 3,000 nmi (5,600 km) | 5.51 kg/km (19.5 lb/mi) | 2.56 L/100 km (92 mpg‑US)[60] |
| Boeing 767-400ER | 1999 | 245 | 3,000 nmi (5,600 km) | 5.78 kg/km (20.5 lb/mi) | 2.95 L/100 km (80 mpg‑US)[60] |
| Boeing 767-400ER | 1999 | 304 | 3,000 nmi (5,600 km) | 5.93 kg/km (21.0 lb/mi) | 2.44 L/100 km (96 mpg‑US)[60] |
| Boeing 767-400ER | 1999 | 304 | 3,265 nmi (6,047 km) | 5.92 kg/km (21 lb/mi) | 2.43 L/100 km (96.9 mpg‑US)[41] |
| Boeing 777-200 | 1994 | 305 | 3,000 nmi (5,600 km) | 6.83 kg/km (24.2 lb/mi) | 2.8 L/100 km (84 mpg‑US)[61] |
| Boeing 777-200ER | 1996 | 301 | 3,000 nmi (5,600 km) | 6.96 kg/km (24.7 lb/mi) | 2.89 L/100 km (81 mpg‑US)[56] |
| Boeing 777-300 | 1997 | 368 | 3,000 nmi (5,600 km) | 7.88 kg/km (28.0 lb/mi) | 2.68 L/100 km (88 mpg‑US)[61] |
| Boeing 787-8 | 2009 | 291 | 3,400 nmi (6,300 km) | 5.26 kg/km (18.7 lb/mi) | 2.26 L/100 km (104 mpg‑US)[58] |
| Boeing 787-8 | 2009 | 238 | 3,400 nmi (6,300 km) | 5.11 kg/km (18.1 lb/mi) | 2.68 L/100 km (88 mpg‑US)[55] |
| Boeing 787-9 | 2013 | 304 | 3,350 nmi (6,200 km) | 5.77 kg/km (20.5 lb/mi) | 2.37 L/100 km (99 mpg‑US)[57] |
| Irkut MC-21 | 2017 | 163 | 1,750 nmi (3,240 km) | 3.04 kg/km (10.8 lb/mi) | 2.33 L/100 km (101 mpg‑US)[62] |
Long-haul flights
For flights of 4,650–7,200 nmi (8,610–13,330 km). This includes transpacific flights (e.g. Hong Kong international – San Francisco International is 6,000 nmi).[63]
| Model | First flight | Seats | Sector | Fuel burn | Fuel per seat |
|---|---|---|---|---|---|
| Airbus A330-200 | 1997 | 241 | 6,000 nmi (11,000 km) | 6.4 kg/km (23 lb/mi) | 3.32 L/100 km (71 mpg‑US)[56] |
| Airbus A330neo-800 | 2017 | 248 | 4,650 nmi (8,610 km) | 5.45 kg/km (19.3 lb/mi) | 2.75 L/100 km (86 mpg‑US)[64] |
| Airbus A330neo-900 | 2017 | 300 | 4,650 nmi (8,610 km) | 5.94 kg/km (21.1 lb/mi) | 2.48 L/100 km (95 mpg‑US)[64] |
| Airbus A340-300 | 1992 | 262 | 6,000 nmi (11,000 km) | 7.32 kg/km (26.0 lb/mi) | 3.49 L/100 km (67.4 mpg‑US)[56] |
| Airbus A350-900 | 2013 | 315 | 4,972 nmi (9,208 km) | 6.03 kg/km (21.4 lb/mi) | 2.39 L/100 km (98 mpg‑US)[57] |
| Airbus A350-900 | 2013 | 315 | 6,542 nmi (12,116 km) | 7.07 kg/km (25.1 lb/mi) | 2.81 L/100 km (84 mpg‑US)[65] |
| Airbus A380 | 2005 | 525 | 7,200 nmi (13,300 km) | 13.78 kg/km (48.9 lb/mi) | 3.27 L/100 km (72 mpg‑US)[66] |
| Airbus A380 | 2005 | 544 | 6,000 nmi (11,000 km) | 13.78 kg/km (48.9 lb/mi) | 3.16 L/100 km (74 mpg‑US)[67] |
| Boeing 747-400 | 1988 | 416 | 6,000 nmi (11,000 km) | 11.11 kg/km (39.4 lb/mi) | 3.34 L/100 km (70 mpg‑US)[68] |
| Boeing 747-8 | 2011 | 467 | 6,000 nmi (11,000 km) | 10.54 kg/km (37.4 lb/mi) | 2.82 L/100 km (83 mpg‑US)[59] |
| Boeing 747-8 | 2011 | 405 | 7,200 nmi (13,300 km) | 10.9 kg/km (39 lb/mi) | 3.35 L/100 km (70 mpg‑US)[66] |
| Boeing 777-200ER | 1996 | 301 | 6,000 nmi (11,000 km) | 7.42 kg/km (26.3 lb/mi) | 3.08 L/100 km (76 mpg‑US)[56] |
| Boeing 777-200ER | 1996 | 301 | 6,000 nmi (11,000 km) | 7.44 kg/km (26.4 lb/mi) | 3.09 L/100 km (76 mpg‑US)[61] |
| Boeing 777-200LR | 2005 | 291 | 4,972 nmi (9,208 km) | 7.57 kg/km (26.9 lb/mi) | 3.25 L/100 km (72 mpg‑US)[57] |
| Boeing 777-300ER | 2003 | 365 | 6,000 nmi (11,000 km) | 8.49 kg/km (30.1 lb/mi) | 2.91 L/100 km (81 mpg‑US)[61] |
| Boeing 777-300ER | 2003 | 344 | 7,200 nmi (13,300 km) | 8.58 kg/km (30.4 lb/mi) | 3.11 L/100 km (76 mpg‑US)[66] |
| Boeing 777-9X | 2020 | 395 | 7,200 nmi (13,300 km) | 9.04 kg/km (32.1 lb/mi) | 2.85 L/100 km (83 mpg‑US)[66] |
| Boeing 787-8 | 2011 | 243 | 4,650 nmi (8,610 km) | 5.38 kg/km (19.1 lb/mi) | 2.77 L/100 km (85 mpg‑US)[64] |
| Boeing 787-9 | 2013 | 294 | 4,650 nmi (8,610 km) | 5.85 kg/km (20.8 lb/mi) | 2.49 L/100 km (94 mpg‑US)[64] |
| Boeing 787-9 | 2013 | 304 | 4,972 nmi (9,208 km) | 5.63 kg/km (20.0 lb/mi) | 2.31 L/100 km (102 mpg‑US)[57] |
| Boeing 787-9 | 2013 | 291 | 6,542 nmi (12,116 km) | 7.18 kg/km (25.5 lb/mi) | 3.08 L/100 km (76 mpg‑US)[65] |
For comparison, a Volvo bus 9700 averages 0.41 L/100 km (570 mpg‑US) per seat for 63 seats.[69] In highway travel an average auto has the potential for 1.61 L/100 km (146 mpg‑US)[70] per seat (assuming 4 seats) and for a 5-seat 2014 Toyota Prius, 0.98 L/100 km (240 mpg‑US).[71] While this shows the capabilities of the vehicles, the load factors (percentage of seats occupied) may differ between personal use (commonly just the driver in the car) and societal averages for long-distance auto use, and among those of particular airlines.
General aviation
For private aircraft in general aviation, the current official record (FAI "Efficiency Aircraft") is 37 km/kg fuel or 3.7 L/100 km in a Monnett Sonerai.[72]
Future
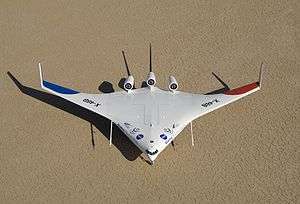

NASA and Boeing flight-tested a 500 lb (230 kg) blended wing body (BWB) X-48B demonstrator from August 2012 to April 2013. This design provides greater fuel efficiency, since the whole craft produces lift, not just the wings.[73] The BWB concept offers advantages in structural, aerodynamic and operating efficiencies over today's more-conventional fuselage-and-wing designs. These features translate into greater range, fuel economy, reliability and life-cycle savings, as well as lower manufacturing costs.[74][75] NASA has created a cruise efficient STOL (CESTOL) concept.
Fraunhofer Institute for Manufacturing Engineering and Applied Materials Research (IFAM) have researched a sharkskin-imitating paint that would reduce drag through a riblet effect.[76] Aviation is a major potential application for new technologies such as aluminium metal foam and nanotechnology.
The International Air Transport Association (IATA) technology roadmap envisions improvements in aircraft configuration and aerodynamics. It projects the following reductions in fuel consumption:[77]
- 10–15% from advanced and geared turbofans in 2016
- 15–20% from open rotor/unducted fans in 2019
- 5–10% by natural laminar flow and 10–15% by hybrid laminar flow in 2022
- 15–20% from Counter-rotating propellers in 2023
- 25–30% from second-generation core concepts in 2026
- 10–25% from Hybrid Wing Body in 2026
- 5–10% from airframe morphing in 2027
- 10–15% from truss or strut-braced wing design in 2028
- 10–20% by flying without landing gear in 2032
Today's tube-and-wing configuration could remain in use until the 2030s due to drag reductions from active flutter suppression for slender flexible-wings and natural and hybrid laminar flow. Large, ultra high bypass engines will need upswept gull wings or overwing nacelles as Pratt & Whitney continue to develop its geared turbofan to save a projected 10–15% of fuel costs by the mid-2020s. NASA indicates this configuration could gain up to 45% with advanced aerodynamics, structures and geared turbofans, but longer term suggests savings of up to 50% by 2025 and 60% by 2030 with new ultra-efficient configurations and propulsion architectures: hybrid wing body, truss-braced wing, lifting body designs, embedded engines, and boundary-layer ingestion. By 2030 hybrid-electric architectures may be ready for 100 seaters and distributed propulsion with tighter integration of airframe may enable further efficiency and emissions improvements.[78]
Research projects such as Boeing's ecoDemonstrator program have sought to identify ways of improving the fuel economy of commercial aircraft operations. The U.S. government has encouraged such research through grant programs, including the FAA's Continuous Lower Energy, Emissions and Noise (CLEEN) program, and NASA's Environmentally Responsible Aviation (ERA) Project.
Multiple concepts are projected to reduce fuel consumption:[79]
- the Airbus/Rolls-Royce E-Thrust is an hybrid electric with a gas turbine engine and electric ducted fans with energy storage allowing peak power for takeoff and climb while for the descent the engine is shut down and the fans recover energy to recharge the batteries;
- Empirical Systems Aerospace (ESAero) is developing the 150-seat ECO-150 concept for turboelectric distributed propulsion with two turboshaft engines mounted on the wing and driving generators powering ducted fans embedded in the inboard wing sections, effectively increasing the bypass ratio and propulsive efficiency for 20–30% fuel savings over the Boeing 737 NG, while providing some powered lift;
- NASA's single-aisle turbo-electric aircraft with an aft boundary layer propulsor (STARC-ABL) is a conventional tube-and-wing 737-sized airliner with an aft-mounted electric fan ingesting the fuselage boundary layer hybrid-electric propulsion, with 5.4 MW of power distributed to three electric motors: the design will be evaluated by Aurora Flight Sciences;[80]
- The Boeing blended wing body (BWB) with a wide fuselage mated to high-aspect-ratio wings is more aerodynamically efficient because the entire aircraft contributes to the lift and it has less surface area, producing less drag and offering weight savings due to lower wing loading, while noise is shielded by locating the engines on the aft upper surface;
- Developed with the U.S. Air Force Research Laboratory and refined with NASA, the Lockheed Martin Hybrid Wing Body (HWB) combines a blended forward fuselage and wing with a conventional aft fuselage and T-tail for compatibility with existing infrastructure and airdrop; the engines in overwing nacelles on struts over the trailing edge enable higher-bypass-ratio engines with 5% less drag, provide acoustic shielding and increases lift without a thrust or drag penalty at low speed;
- Airbus-backed German Bauhaus-Luftfahrt designed the Propulsive Fuselage concept, reducing drag with a fan in the tail ingesting air flowing over the fuselage via an annular (ring-shaped) inlet and re-energizes the wake, driven with a gearbox or as a turbo-electric configuration;
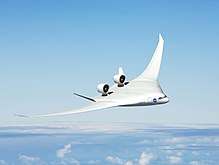
- Conceived by the Massachusetts Institute of Technology for NASA, Aurora Flight Sciences developed the "double-bubble" D8, a 180-seat aircraft with a wide lifting fuselage, twin-aisle cabin to replace A320 and B737 narrowbodies, and boundary-layer ingestion with engines in the tail driving distortion-tolerant fans for a 49% fuel-burn reduction over the B737NG;
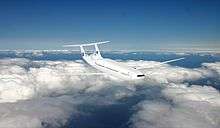
- The Boeing truss-braced wing (TBW) concept was developed for the NASA-funded Subsonic Ultra Green Aircraft Research program with an aspect ratio of 19.5 compared to 11 for the Boeing 787: the strut relieves some bending moment and a braced wing can be lighter than a cantilevered wing or longer for the same weight, having better lift-to-drag ratio by lowering the induced drag and thinner, facilitating natural laminar flow and reducing wave drag at transonic speeds;
- Dzyne Technologies reduces the thickness of the blended wing body for a 110–130-seat super-regional, a configuration usually too thick for a narrowbody replacement and better suited for large aircraft, by placing the landing gear outward and storing baggage in the wing roots, enabling 20% fuel savings;
- the French research agency ONERA designed two concepts for a 180-seat airliner Versitalie Aircraft (NOVA) including turbofans with higher bypass ratios and fan diameter: a gull wing with increased dihedral inboard to accommodate larger geared turbofans under without lengthening the gear and the other with engines embedded in the tail to ingest the low-energy fuselage boundary layer flow and re-energize the wake to reduce drag;[81]
- with Cranfield University, Rolls-Royce developed the Distributed Open Rotor (DORA) with high-aspect-ratio wing and V-tail to minimize drag, and turbogenerators on the wing driving electric propellers along the inboard leading edge with open rotor high-propulsive efficiency and increasing the effective bypass ratio.
Climate change
The growth of air travel outpaces its fuel-economy improvements and corresponding CO2 emissions, compromising climate sustainability. Although low-cost carriers' higher seat-density increases fuel economy and lowers greenhouse gas emissions per-passenger-kilometer, the lower airfares cause a rebound effect of more flights and larger overall emissions. The tourism industry could shift emphasis to emissions eco-efficiency in CO2 per unit of revenue or profit instead of fuel economy, favoring shorter trips and ground transportation over flying long journeys to reduce greenhouse gas emissions.[82]
See also
References
- ↑ "Performance > Speed". Aerion.
- ↑ Max Kingsley-Jones (15 November 2009). "Dubai 09: A320s sharklets to deliver 3.5% lower fuel burn from 2012". Flight International.
- ↑ Barney L. Capehart (2007). Encyclopedia of Energy Engineering and Technology. 1. CRC Press. ISBN 978-0-8493-3653-9.
- ↑ Marsh, George (8 April 2014). "Composites flying high (Part 1)". Materials Today. Retrieved 23 May 2015.
- ↑ Antonio Filippone (2012). Advanced Aircraft Flight Performance. Cambridge University Press. p. 454. ISBN 9781139789660.
- ↑ Park Y., O'Kelly M.E. (2014). Fuel burn rates of commercial passenger aircraft: variations by seat configuration and stage distance. Jrnl. Transp. Geog., 41:pp.137-147.
- ↑ Why the Longest Nonstop Flights Are Ending, Bloomberg Bus., 31 October 2013.
- ↑ Andrew Doyle (24 October 2012). "SIA to drop nonstop USA flights as Airbus buys back A340s". flightglobal.com.
- ↑ Mike Tierney (25 November 2013). "Last Call for the Long Haul From Singapore to Newark". The New York Times. Retrieved 1 April 2016.
- ↑ Tanya Powley; Peggy Bollinger (6 November 2015). "A new era of 'ultra-long-haul' aviation". Financial Times. Retrieved 22 December 2016.
- ↑ Spakovszky, Zoltan (2009). "Unified Propulsion Lecture 1". Unified Engineering Lecture Notes. MIT.
- ↑ US application 2009020643, Airbus & Christophe Cros, "Aircraft having reduced environmental impact", published 22 January 2009
- ↑ James Albright (27 February 2016). "Getting the Most Miles from Your Jet-A". Business & Commercial Aviation. Aviation Week.
- ↑ Brandon Graver and Daniel Rutherford (12 September 2018). "Transatlantic airline fuel efficiency ranking, 2017" (PDF). ICCT.
- ↑ Brandon Graver and Daniel Rutherford (Jan 2018). "Transpacific airline fuel efficiency ranking, 2016" (PDF). ICCT.
- ↑ "Annual Report" (PDF). Ryanair. July 2016. p. 29.
- ↑ Bjorn Fehrm (26 April 2017). "Aeroflot, the route to a modern airline. Part 3". Leeham Co.
- ↑ "Sustainable Development Report 2016" (PDF). Cathay Pacific. p. 5.
- 1 2 Irene Kwan (3 June 2014). "Back to the Future: Return of the Turboprop?". The International Council on Clean Transport.
- 1 2 3 Simon Weselby (October 2012). "Fuel Burn vs. Maintenance Costs" (PDF). IATA maintenance cost conference. Airbus.
- ↑ "Efficiency Trends for New Commercial Jet Aircraft, 1960 to 2008" (PDF). The International Council on Clean Transportation. November 2009.
- 1 2 Peeters, P. M.; Middel, J.; Hoolhorst, A. (November 2005). "Fuel efficiency of commercial aircraft" (PDF). Netherlands National Aerospace Laboratory. An overview of historical and future trends.
- ↑ Brian M. Yutko and R. John Hansman (May 2011). "Approaches to Representing Aircraft Fuel Efficiency. Performance for the Purpose of a Commercial Aircraft" (PDF). MIT International Center for Air Transportation.
- ↑ Richard Avellán (2011). On the Design of Energy Efficient Aero Engines (PDF) (Thesis). Chalmers University of Technology.
- 1 2 3 4 "CS300 first flight Wednesday, direct challenge to 737-7 and A319neo". Leeham News. 25 February 2015.
- ↑ Peeters, Kutzner & Cohen (2016). Are technology myths stalling aviation climate policy?. At 4-5.
- ↑ "The A380: The future of flying". Airbus. Archived from the original on 14 December 2007. Retrieved 22 March 2008.
- ↑ Inflight Luxury: Who Really Pays?, Irene Kwan, ICCT. 30 May 2014.
- 1 2 "Fuel saving" (PDF). ATR. January 2011.
- ↑ "Beechcraft 1900D: Fuel, Emissions & Cost Savings Operational Analysis" (PDF). Specific Range Solutions Ltd. 21 February 2012.
- ↑ Mark Brouwer, Siddharth Srinivasan. "Proud to fly a Turboprop: Q400 vs ATR72". The Flying Engineer.
- ↑ "Dornier 228 Advanced Commuter Brochure". RUAG.
- ↑ "Dornier 328-100 (TP)" (PDF). 328 Support Services GmbH. 2013.
- ↑ "120 Brasilia Sales Brochure". Embraer. p. 8.
- ↑ "PC-12 NG Just The Facts" (PDF). Pilatus. 20 October 2015.
- 1 2 "Saab 340A data sheet" (PDF). Saab Aircraft Leasing. 2009.
- 1 2 "Saab 2000 data sheet" (PDF). Saab Aircraft Leasing. 2009.
- 1 2 "MA700". AVIC.
- 1 2 3 4 5 6 7 "Embraer continues and refines its strategy at the low-end of 100-149 seat sector". Leeham News. 13 January 2014.
- 1 2 3 4 5 6 "ANALYSIS: A320neo vs. 737 MAX: Airbus is Leading (Slightly) – Part II". Airways News. 5 February 2016.
- 1 2 Scott McCartney (12 August 2010). "A Prius With Wings vs. a Guzzler in the Clouds". Wall Street Journal.
- 1 2 3 4 5 6 7 8 "737 performance summary" (PDF). Boeing. 2007. Archived from the original (PDF) on 25 July 2014.
- 1 2 3 4 "757 performance summary" (PDF). Boeing. 2007.
- ↑ "Bombardier CRJ1000 Fuel Consumption". Sun Airlines. 20 August 2013.
- 1 2 "CS100 environmental product declaration" (PDF). Bombardier. 27 September 2016.
- 1 2 "CS300 environmental product declaration" (PDF). Bombardier. 27 September 2017.
- ↑ "Q400 Fuel efficiency manual" (PDF). Bombardier. 2014.
- ↑ "Dornier 328-100 (TP)" (PDF). 328 Support Services GmbH. 2013.
- 1 2 "Sukhoi SSJ100, Embraer ERJ190, Airbus A319 Operational and Economic Comparison". Sukhoi. March 2013.
- 1 2 3 4 5 6 7 "Analysing the options for 757 replacement" (PDF). Aircraft Commerce. August 2005.
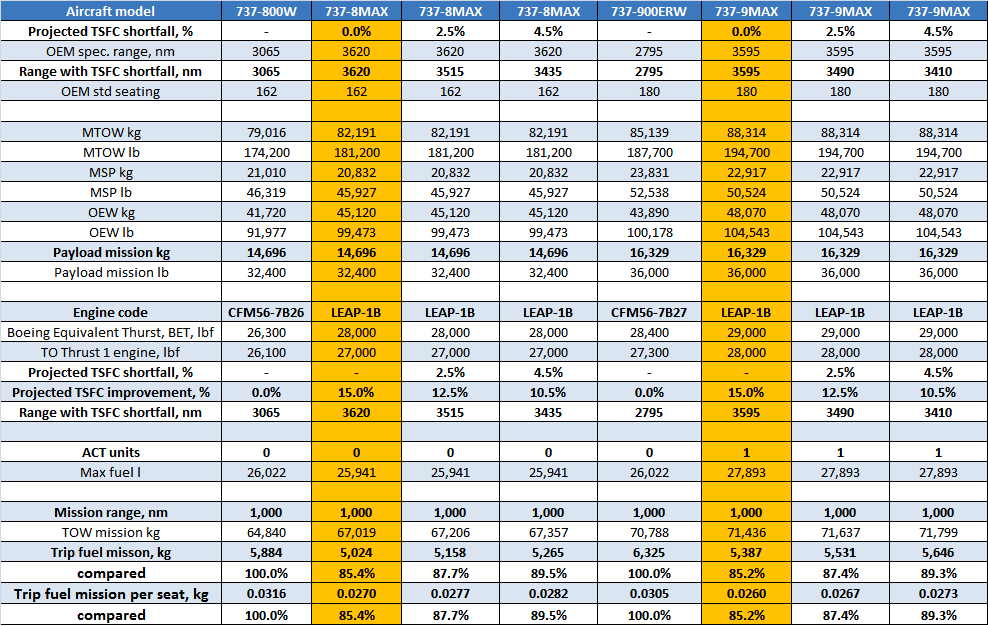
- 1 2 3 4 "Boeing 737 MAX: performance with reported engine SFC shortfall". Leeham News. 15 April 2015.
- ↑ "Kodiak Brochure" (PDF). Quest Aircraft. April 2014.
- ↑ "Distance from JFK to LHR". great circle mapper.
- 1 2 3 Anja Kollmuss & Jessica Lane (May 2008). "Carbon Offset Calculators for Air Travel" (PDF). Stockholm Environment Institute.
- 1 2 3 4 5 Bjorn Fehrm (25 February 2015). "Redefining the 757 replacement: Requirement for the 225/5000 Sector". Leeham News.
- 1 2 3 4 5 6 7 "Boeing: 777 way much better than A330". Aspire aviation. 8 December 2010.
- 1 2 3 4 5 Vinay Bhaskara (25 November 2014). "UPDATED ANALYSIS: Delta Order for A350; A330neo Hinged on Pricing, Availability". Airways News.
- 1 2 "737 MAX 8 could be enabler for some LCC Long Haul". Leeham News. 8 December 2014.
- 1 2 "747-8 performance summary" (PDF). Boeing. 2010. Archived from the original (PDF) on 24 July 2014.
- 1 2 3 4 5 6 "767 performance summary" (PDF). Boeing. 2006. Archived from the original (PDF) on 15 April 2015.
- 1 2 3 4 "777 performance summary" (PDF). Boeing. 2009. Archived from the original (PDF) on 4 January 2014.
- ↑ David Kaminski-Morrow (4 June 2018). "Aeroflot outlines performance expectations for MC-21s". Flight Global.
- ↑ "Distance from HKG to SFO". great circle mapper.
- 1 2 3 4 "ANALYSIS: The Boeing 787-8 and Airbus A330-800neo are Far From Dead". Airways News. 17 March 2016.
- 1 2 "Airbus A350: is the Xtra making the difference ?". Aspire Aviation. 8 June 2015.
- 1 2 3 4 "Updating the A380: the prospect of a neo version and what's involved". leeham news. 3 February 2014.
- ↑ "What Might an Engine Improvement and Sharklets Provide?". Air Insight. 4 July 2016.
- ↑ "747 performance summary" (PDF). Boeing. 2010. Archived from the original (PDF) on 25 July 2014.
- ↑ Edward Jobson (12 September 2013). "Coach fuel consumption". volvo buses.
- ↑ DEFRA (2008). 2008 Guidelines to Defra's GHG Conversion Factors: Methodology Paper for Transport Emission Factors Archived 5 January 2012 at the Wayback Machine.
- ↑ "2014 Toyota Prius fuel economy". United States Environmental Protection Agency.
- ↑ "FAI Record ID #15066 - Aeroplane Efficiency, C-1b (Landplanes: take off weight 500 to 1000 kg) " Fédération Aéronautique Internationale Record date 8 June 2008. Accessed: 4 October 2015.
- ↑ Hank Green (8 October 2007). "Fuel Efficient Plane Prototype Hits Skies". Ecogeek. Archived from the original on 14 July 2014. Retrieved 6 July 2014.
- ↑ Tom Koehler (27 October 2006). "Boeing to Begin Ground Testing of X-48B Blended Wing Body Concept" (Press release). Boeing. Retrieved 10 April 2012.
- ↑ Philip Lorenz III (3 July 2007). "AEDC testing brings unique blended wing aircraft closer to flight". Arnold Air Force Base. Archived from the original on 14 July 2014. Retrieved 10 April 2012.
- ↑ Mahony, Melissa (25 May 2010). "A sharkskin coating for ships, planes and blades". SmartPlanet. Retrieved 29 September 2012.
- ↑ "Technology Roadmap" (PDF). IATA. 2013.
- ↑ Graham Warwick (6 May 2016). "Problems Aerospace Still Has To Solve". Aviation Week & Space Technology.
- ↑ Graham Warwick (27 January 2017). "When Will These Civil Aircraft Concepts Fly?". Aviation Week & Space Technology.
- ↑ Stephen Trimble (24 October 2017). "Aurora Flight Sciences to evaluate NASA electric airliner design". Flightglobal.
- ↑ Ludovic Wiart; et al. (July 2015). Development of NOVA Aircraft Configurations for Large Engine Integration Studies (PDF). AIAA Aviation 2015, Dallas, TX. ONERA. doi:10.2514/6.2015-2254.
- ↑ Paul Peeters (15 November 2017). Tourism's impact on climate change and its mitigation challenges: How can tourism become ‘climatically sustainable'? (PhD). TU Delft. p. 187.
External links
- "Technology Roadmap Annex" (PDF). IATA. 2009.
- Scott W. Ashcraft, Andres S. Padron, Kyle A. Pascioni, and Gary W. Stout Jr., Dennis L. Huff (October 2011). "Review of Propulsion Technologies for N+3 Subsonic Vehicle Concepts" (PDF). Glenn Research Center, Cleveland, Ohio. NASA.
- Elyse Moody (1 March 2012). "Focus On Fuel Savings". Overhaul & Maintenance. Aviation Week.
- Yongha Park, Morton E. O'Kelly (December 2014). "Fuel burn rates of commercial passenger aircraft: Variations by seat configuration and stage distance Article". The Ohio State University. Journal of Transport Geography. 41. pp. 137–147. doi:10.1016/j.jtrangeo.2014.08.017.
- Irene Kwan and Daniel Rutherford (November 2015). "Transatlantic airline fuel efficiency ranking, 2014" (PDF). International Council on Clean Transportation.
- James Albright (27 February 2016). "Getting the Most Miles from Your Jet-A". Business & Commercial Aviation. Aviation Week.