Electoral district of Playford
| Playford South Australia—House of Assembly | |||||||||||||||
|---|---|---|---|---|---|---|---|---|---|---|---|---|---|---|---|
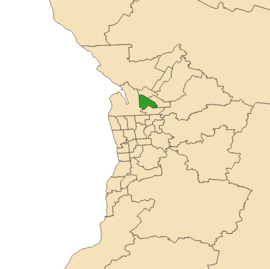 Electoral district of Playford (green) in the Greater Adelaide area | |||||||||||||||
| State | South Australia | ||||||||||||||
| Created | 1970 | ||||||||||||||
| MP | Michael Brown | ||||||||||||||
| Party | Australian Labor Party (SA) | ||||||||||||||
| Namesake | Thomas Playford IV | ||||||||||||||
| Electors | 26,374 (2018) | ||||||||||||||
| Area | 24.61 km2 (9.5 sq mi) | ||||||||||||||
| Demographic | Metropolitan | ||||||||||||||
| Coordinates | 34°49′6″S 138°38′12″E / 34.81833°S 138.63667°ECoordinates: 34°49′6″S 138°38′12″E / 34.81833°S 138.63667°E | ||||||||||||||
| |||||||||||||||
| Footnotes | |||||||||||||||
| Electoral District map[1] | |||||||||||||||
Playford is a single-member electoral district for the South Australian House of Assembly. Named after the long serving South Australian premier Tom Playford, it is a 22.7 km² suburban electorate in Adelaide's north, taking in the suburbs of Green Fields, Mawson Lakes, Para Hills, Para Hills West, Parafield and Parafield Gardens.
Playford was created as a safe Labor seat and was first contested at the 1970 election, where it was won by Labor candidate Terry McRae. At the 1989 election, McRae resigned from politics, with the seat won by Labor candidate John Quirke. Though typically a safe Labor seat, the seat technically became marginal, reduced to just a 2.7 percent two-party margin at the 1993 election landslide. At the 1997 election, Quirke resigned to enter the Australian Senate, with the seat won by Labor candidate Jack Snelling.
Members for Playford
| Member | Party | Term | |
|---|---|---|---|
| Terry McRae | Labor | 1970–1989 | |
| John Quirke | Labor | 1989–1997 | |
| Jack Snelling | Labor | 1997–2018 | |
| Michael Brown | Labor | 2018–present | |
Election results
| Party | Candidate | Votes | % | ± | |
|---|---|---|---|---|---|
| Labor | Michael Brown | 10,551 | 47.2 | −4.9 | |
| Liberal | Hemant Dave | 4,679 | 20.9 | −10.4 | |
| SA-BEST | Helen Szuty | 4,455 | 19.9 | +19.9 | |
| Greens | Brock Le Cerf | 1,346 | 6.0 | −1.1 | |
| Conservatives | Shane Sheoran | 1,325 | 5.9 | −3.5 | |
| Total formal votes | 22,356 | 95.0 | −1.0 | ||
| Informal votes | 1,175 | 5.0 | +1.0 | ||
| Turnout | 23,531 | 89.2 | +2.8 | ||
| Two-party-preferred result | |||||
| Labor | Michael Brown | 14,827 | 66.3 | +4.6 | |
| Liberal | Hemant Dave | 7,529 | 33.7 | −4.6 | |
| Labor hold | Swing | +4.6 | |||
Notes
- ↑ Electoral District of Playford (Map). Electoral Commission of South Australia. 2018. Retrieved 1 April 2018.
- ↑ State Election Results - District Results for Playford, ECSA.