Electoral district of Taylor
| Taylor South Australia—House of Assembly | |||||||||||||||
|---|---|---|---|---|---|---|---|---|---|---|---|---|---|---|---|
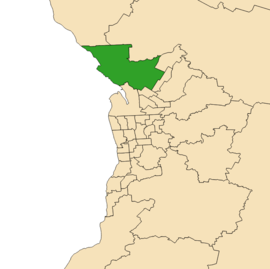 Electoral district of Taylor (green) in the Greater Adelaide area | |||||||||||||||
| State | South Australia | ||||||||||||||
| Created | 1993 | ||||||||||||||
| MP | Jon Gee | ||||||||||||||
| Party | Australian Labor Party (SA) | ||||||||||||||
| Namesake | Doris Irene Taylor | ||||||||||||||
| Electors | 27,494 (2018) | ||||||||||||||
| Area | 318.71 km2 (123.1 sq mi) | ||||||||||||||
| Demographic | Metropolitan | ||||||||||||||
| Coordinates | 34°41′4″S 138°33′16″E / 34.68444°S 138.55444°ECoordinates: 34°41′4″S 138°33′16″E / 34.68444°S 138.55444°E | ||||||||||||||
| |||||||||||||||
| Footnotes | |||||||||||||||
| Electoral District map[1] | |||||||||||||||
Taylor is a single-member electoral district for the South Australian House of Assembly. This district is named after Doris Irene Taylor MBE, a leading force in the founding of Meals on Wheels, and Labor activist. Taylor is a 318.7 km² semi-urban electorate in Adelaide's far northern suburbs and fringe farmland. A large portion of the district lives in its southern edges, corresponding to the northern fringes of Adelaide. It includes the suburbs, towns and localities of Andrews Farm, Angle Vale, Buckland Park, Burton, Davoren Park, Direk, Edinburgh, Edinburgh North, Elizabeth North, Macdonald Park, Middle Beach, Penfield, Penfield Gardens, Port Gawler, Smithfield, Smithfield Plains, Two Wells, Virginia, and Waterloo Corner.
Taylor was created for the 1993 state election between the northern metropolitan seats of Ramsay and Goyder, and was won by the defeated Labor Premier Lynn Arnold. He resigned in 1994, triggering a Taylor by-election which saw Trish White retain the seat for Labor. It is regarded as a safe Labor seat.
Members for Taylor
| Member | Party | Term | |
|---|---|---|---|
| Lynn Arnold | Labor | 1993–1994 | |
| Trish White | Labor | 1994–2010 | |
| Leesa Vlahos | Labor | 2010–2018 | |
| Jon Gee | Labor | 2018–present | |
Election results
| Party | Candidate | Votes | % | ± | |
|---|---|---|---|---|---|
| Labor | Jon Gee | 9,786 | 43.6 | −4.3 | |
| SA-BEST | Sonja Taylor | 5,644 | 25.1 | +25.1 | |
| Liberal | Sarika Sharma | 4,308 | 19.2 | −13.0 | |
| Greens | Kate Randell | 1,491 | 6.6 | −0.5 | |
| Conservatives | Danny Bradley | 1,239 | 5.5 | −6.4 | |
| Total formal votes | 22,468 | 94.3 | −1.4 | ||
| Informal votes | 1,358 | 5.7 | +1.4 | ||
| Turnout | 23,826 | 86.7 | +4.6 | ||
| Two-party-preferred result | |||||
| Labor | Jon Gee | 13,660 | 60.8 | +2.3 | |
| Liberal | Sarika Sharma | 8,808 | 39.2 | −2.3 | |
| Two-candidate-preferred result | |||||
| Labor | Jon Gee | 12,516 | 55.7 | −2.8 | |
| SA-BEST | Sonja Taylor | 9,952 | 44.3 | +44.3 | |
| Labor hold | Swing | N/A | |||
Notes
- ↑ Electoral District of Taylor (Map). Electoral Commission of South Australia. 2018. Retrieved 1 April 2018.
- ↑ State Election Results – District Results for Taylor, ECSA.