East Palestine, Ohio
| East Palestine, Ohio | |
|---|---|
| Village | |
| Village of East Palestine | |
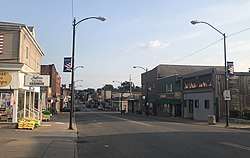 Businesses along Market Street in Downtown | |
| Motto(s): "Where You Want To Be" | |
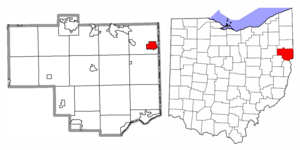 Location of East Palestine in Columbiana County and the State of Ohio | |
| Coordinates: 40°50′7″N 80°32′31″W / 40.83528°N 80.54194°WCoordinates: 40°50′7″N 80°32′31″W / 40.83528°N 80.54194°W | |
| Country | United States |
| State | Ohio |
| County | Columbiana |
| Government | |
| • Type | Council-Manager |
| • Mayor | Alan Cohen |
| • Village Manager | Peter Monteleone |
| Area[1] | |
| • Total | 3.15 sq mi (8.16 km2) |
| • Land | 3.15 sq mi (8.16 km2) |
| • Water | 0 sq mi (0 km2) |
| Elevation[2] | 1,001 ft (305 m) |
| Population (2010) | |
| • Total | 4,721 |
| • Estimate (2017[3]) | 4,487 |
| • Density | 1,498.7/sq mi (578.7/km2) |
| Time zone | UTC-5 (Eastern (EST)) |
| • Summer (DST) | UTC-4 (EDT) |
| ZIP code | 44413 |
| Area code(s) | 330, 234 |
| FIPS code | 39-23940[4] |
| GNIS feature ID | 1064586[2] |
| School District | East Palestine City |
| Website | http://www.eastpalestine-oh.gov/ |
East Palestine (/ˌpæləˈstiːn/ PAL-ə-STEEN) is a village in eastern Columbiana County, Ohio, United States. The population was 4,721 at the 2010 census. Located on the Ohio-Pennsylvania border, East Palestine is 20 miles south of Youngstown and 50 miles northwest of downtown Pittsburgh. East Palestine is located in the Salem, OH Micropolitan Statistical Area, as well as the southern regions of the greater Mahoning Valley.
East Palestine is located along the Norfolk Southern Railway, and has a freight train station.[5]
History

The town was founded in 1828 and incorporated as a city in 1875.[6] Formerly, the community was known as Mechanicsburg, but the name was changed to East Palestine as part of the religious nomenclature in the area.[7] (Palestine was already a community in Ohio). Mechanicsburg is today a name given to a village in Champaign County, near Dayton. Nearby clay pits supported a pottery industry, including the W. S. George Pottery Company that was formed in 1909 from the East Palestine Pottery Company, and operated in the town until 1960.
Geography
East Palestine is located along the eastern boundary of Columbiana County, almost touching Darlington Township, Pennsylvania. The village is entirely surrounded by Unity Township.
The following highways pass through East Palestine:
According to the United States Census Bureau, East Palestine has a total area of 3.15 square miles (8.16 km2), all land.[1][8]
Demographics
| Historical population | |||
|---|---|---|---|
| Census | Pop. | %± | |
| 1880 | 1,047 | — | |
| 1890 | 1,816 | 73.4% | |
| 1900 | 2,493 | 37.3% | |
| 1910 | 3,537 | 41.9% | |
| 1920 | 5,750 | 62.6% | |
| 1930 | 5,215 | −9.3% | |
| 1940 | 5,123 | −1.8% | |
| 1950 | 5,195 | 1.4% | |
| 1960 | 5,232 | 0.7% | |
| 1970 | 5,604 | 7.1% | |
| 1980 | 5,306 | −5.3% | |
| 1990 | 5,168 | −2.6% | |
| 2000 | 4,917 | −4.9% | |
| 2010 | 4,721 | −4.0% | |
| Est. 2017 | 4,487 | [9] | −5.0% |
| U.S. Decennial Census[10] | |||
2010 census
As of the census[11] of 2010, there were 4,721 people, 1,898 households, and 1,282 families residing in the city. The population density was 1,498.7 inhabitants per square mile (578.7/km2). There were 2,125 housing units at an average density of 674.6 per square mile (260.5/km2). The racial makeup of the city was 98.2% White, 0.2% African American, 0.1% Native American, 0.3% Asian, 0.4% from other races, and 0.7% from two or more races. Hispanic or Latino of any race were 0.9% of the population.
There were 1,898 households of which 29.7% had children under the age of 18 living with them, 49.4% were married couples living together, 13.3% had a female householder with no husband present, 4.8% had a male householder with no wife present, and 32.5% were non-families. 27.3% of all households were made up of individuals and 11.3% had someone living alone who was 65 years of age or older. The average household size was 2.46 and the average family size was 2.95.
The median age in the city was 40.7 years. 23.1% of residents were under the age of 18; 7.6% were between the ages of 18 and 24; 24.3% were from 25 to 44; 28.5% were from 45 to 64; and 16.5% were 65 years of age or older. The gender makeup of the city was 49.0% male and 51.0% female.
2000 census
As of the census[4] of 2000, there were 4,917 people, 1,975 households, and 1,384 families residing in the city. The population density was 1,772.1 people per square mile (685.4/km²). There were 2,108 housing units at an average density of 759.7 per square mile (293.8/km²). The racial makeup of the city was 98.47% White, 0.37% African American, 0.06% Native American, 0.14% Asian, 0.26% from other races, and 0.69% from two or more races. Hispanic or Latino of any race were 0.71% of the population.
There were 1,975 households out of which 30.9% had children under the age of 18 living with them, 54.6% were married couples living together, 11.6% had a female householder with no husband present, and 29.9% were non-families. 25.6% of all households were made up of individuals and 14.1% had someone living alone who was 65 years of age or older. The average household size was 2.49 and the average family size was 2.98.
In the city the population was spread out with 24.9% under the age of 18, 7.5% from 18 to 24, 28.4% from 25 to 44, 22.6% from 45 to 64, and 16.7% who were 65 years of age or older. The median age was 38 years. For every 100 females there were 93.2 males. For every 100 females age 18 and over, there were 87.5 males.
The median income for a household in the city was $35,738, and the median income for a family was $40,057. Males had a median income of $30,550 versus $17,237 for females. The per capita income for the city was $16,243. About 5.5% of families and 10.0% of the population were below the poverty line, including 22.0% of those under age 18 and 2.2% of those age 65 or over.
Education
Children in East Palestine are served by the East Palestine City School District. The district formerly operated multiple schools throughout the city; however, a new middle school and a renovated elementary campus were erected surrounding the existing high school in 1997. The current schools in the district are:
- East Palestine Elementary School – 195 W Grant Street, grades K-4
- East Palestine Middle School – 320 W Grant Street, grades 5-8
- East Palestine High School – 360 W Grant Street, grades 9-12
Notable residents
- Linda Bolon – Member of the Ohio House of Representatives from the 1st district
- Sarah Burgess – singer-songwriter and American Idol contenstant
- Charles Burleigh Galbreath – writer, historian, educator, and librarian
- R. S. Hamilton – 33rd Speaker of the Oregon House of Representatives
- Wynn Hawkins – Major League Baseball pitcher for the Cleveland Indians
- Martha Hill – noted teacher and advocate of modern dance
- Fred Hoaglin – 2-time Super Bowl champion coach with the New York Giants
- Roger M. Kyes – United States Deputy Secretary of Defense
- Jerry McGee – PGA Tour professional golfer
- J. T. Miller – National Hockey League left winger for the Tampa Bay Lightning
- Jesse R. Pitts – sociologist
- Volney Rogers – founder of Mill Creek Park
- R. J. Thomas – president of the United Automobile Workers
References
- 1 2 "US Gazetteer files 2010". United States Census Bureau. Archived from the original on 2011-02-20. Retrieved 2013-01-06.
- 1 2 "US Board on Geographic Names". United States Geological Survey. 2007-10-25. Retrieved 2008-01-31.
- ↑ "Population and Housing Unit Estimates". Retrieved June 9, 2017.
- 1 2 "American FactFinder". United States Census Bureau. Archived from the original on 2013-09-11. Retrieved 2008-01-31.
- ↑ "Columbiana County Railroad Stations". Ohio Railroad Stations, Past & Present. Retrieved 2018-08-30.
- ↑ McCord, William B. (1905). History of Columbiana County, Ohio and Representative Citizens. Biographical Publishing Company. pp. 330–331.
- ↑ Overman, William Daniel (1958). Ohio Town Names. Akron, OH: Atlantic Press. p. 41.
- ↑ "US Gazetteer files: 2010, 2000, and 1990". United States Census Bureau. 2011-02-12. Retrieved 2011-04-23.
- ↑ "Population and Housing Unit Estimates". Retrieved May 26, 2018.
- ↑ "Census of Population and Housing". Census.gov. Archived from the original on May 12, 2015. Retrieved June 4, 2015.
- ↑ "American FactFinder". United States Census Bureau. Retrieved 2013-01-06.
External links
Municipalities and communities of Columbiana County, Ohio, United States | ||
|---|---|---|
| Cities |  | |
| Villages | ||
| Townships | ||
| CDPs | ||
| Unincorporated communities |
| |
| Ghost town | ||
| Footnotes | ‡This populated place also has portions in an adjacent county or counties | |