Cardiff (UK Parliament constituency)
| Cardiff | |
|---|---|
|
Former Borough constituency for the House of Commons | |
| 1542–1918 | |
| Number of members | one |
| Replaced by | Cardiff Central, Cardiff East and Cardiff South |
Cardiff was a parliamentary constituency centred on the town of Cardiff in South Wales which returned one Member of Parliament to the House of Commons from 1542 until it was abolished for the 1918 general election.
Members of Parliament
MPs 1542–1645
| Parliament | Member |
|---|---|
| 1542 | John Bassett |
| 1545 | Unknown |
| 1547 | John Cock, sat for Calne, repl. by Sir Philip Hoby |
| 1553 (Mar) | ?David Evans |
| 1553 (Oct) | David Evans |
| 1554 (Apr) | David Evans |
| 1554 (Nov) | William Colchester |
| 1555 | William Herbert |
| 1558 | Lleisan Pryce |
| 1559 | David Evans |
| 1562/3 | Henry Lewes |
| 1571 | Henry Morgan |
| 1572 | David Roberts |
| 1584 | Nicholas Herbert |
| 1586 | George Lewis |
| 1588 | Gabriel Lewys |
| 1593 | David Roberts |
| 1597 | Nicholas Hawkins |
| 1601 | William Lewis |
| 1604 | Matthew Davies |
| 1614 | Matthew Davies |
| 1621 | William Herbert |
| 1624 | William Price |
| 1625 | William Price |
| 1626 | William Price |
| 1628 | Lewis Morgan |
| 1629–1640 | No Parliaments summoned |
| 1640 | William Herbert killed at Battle of Edgehill 1642 |
| 1642–1645 | Not represented |
MPs 1645–1832
MPs 1832–1918
Election results
Elections in the 1850s
| Party | Candidate | Votes | % | ± | |
|---|---|---|---|---|---|
| Radical | Walter Coffin | 490 | 51.4 | N/A | |
| Conservative | John Iltyd Nicholl | 464 | 48.6 | N/A | |
| Majority | 26 | 2.7 | N/A | ||
| Turnout | 954 | 98.6 | N/A | ||
| Registered electors | 2,072 | ||||
| Radical gain from Conservative | Swing | N/A | |||
| Party | Candidate | Votes | % | ± | |
|---|---|---|---|---|---|
| Whig | James Crichton-Stuart | Unopposed | |||
| Registered electors | 1,640 | ||||
| Whig gain from Radical | |||||
| Party | Candidate | Votes | % | ± | |
|---|---|---|---|---|---|
| Liberal | James Crichton-Stuart | Unopposed | |||
| Registered electors | 1,793 | ||||
| Liberal hold | |||||
Elections in the 1860s
| Party | Candidate | Votes | % | ± | |
|---|---|---|---|---|---|
| Liberal | James Crichton-Stuart | Unopposed | |||
| Registered electors | 2,072 | ||||
| Liberal hold | |||||
| Party | Candidate | Votes | % | ± | |
|---|---|---|---|---|---|
| Liberal | James Crichton-Stuart | 2,501 | 54.9 | N/A | |
| Conservative | Hardinge Giffard | 2,055 | 45.1 | N/A | |
| Majority | 446 | 9.8 | N/A | ||
| Turnout | 4,556 | 84.6 | N/A | ||
| Registered electors | 5,388 | ||||
| Liberal hold | Swing | N/A | |||
Elections in the 1870s
| Party | Candidate | Votes | % | ± | |
|---|---|---|---|---|---|
| Liberal | James Crichton-Stuart | 2,780 | 50.1 | −4.8 | |
| Conservative | Hardinge Giffard | 2,771 | 49.9 | +4.8 | |
| Majority | 9 | 0.2 | −9.6 | ||
| Turnout | 5,551 | 83.4 | −1.2 | ||
| Registered electors | 6,656 | ||||
| Liberal hold | Swing | −4.8 | |||
Elections in the 1880s
| Party | Candidate | Votes | % | ± | |
|---|---|---|---|---|---|
| Liberal | Edward Reed | 3,831 | 53.1 | +3.0 | |
| Conservative | Arthur Guest | 3,383 | 46.9 | −3.0 | |
| Majority | 448 | 6.2 | +6.0 | ||
| Turnout | 7,214 | 86.4 | +3.0 | ||
| Registered electors | 8,350 | ||||
| Liberal hold | Swing | +3.0 | |||
| Party | Candidate | Votes | % | ± | |
|---|---|---|---|---|---|
| Liberal | Edward Reed | 5,569 | 50.6 | −2.5 | |
| Conservative | Henry Harben | 5,429 | 49.4 | +2.5 | |
| Majority | 140 | 1.2 | −5.0 | ||
| Turnout | 10,998 | 87.3 | +0.9 | ||
| Registered electors | 12,605 | ||||
| Liberal hold | Swing | −2.5 | |||
Reed was appointed a Lord Commissioner of the Treasury, requiring a by-election.
| Party | Candidate | Votes | % | ± | |
|---|---|---|---|---|---|
| Liberal | Edward Reed | 5,708 | 54.1 | +3.5 | |
| Conservative | John Dillwyn-Llewelyn | 4,845 | 45.9 | -3.5 | |
| Majority | 863 | 8.2 | +7.0 | ||
| Turnout | 10,553 | 83.7 | -3.6 | ||
| Registered electors | 12,605 | ||||
| Liberal hold | Swing | +3.5 | |||

Brand
| Party | Candidate | Votes | % | ± | |
|---|---|---|---|---|---|
| Liberal | Edward Reed | 5,307 | 51.7 | +1.1 | |
| Liberal Unionist | Henry Brand | 4,965 | 48.3 | −1.1 | |
| Majority | 342 | 3.4 | +2.2 | ||
| Turnout | 10,272 | 81.5 | −5.8 | ||
| Registered electors | 12,605 | ||||
| Liberal hold | Swing | +1.1 | |||
Elections in the 1890s
| Party | Candidate | Votes | % | ± | |
|---|---|---|---|---|---|
| Liberal | Edward Reed | 7,226 | 52.5 | +0.8 | |
| Liberal Unionist | John Gunn | 6,540 | 47.5 | -0.8 | |
| Majority | 686 | 5.0 | +1.6 | ||
| Turnout | 13,766 | 81.5 | 0.0 | ||
| Registered electors | 16,886 | ||||
| Liberal hold | Swing | +0.8 | |||
| Party | Candidate | Votes | % | ± | |
|---|---|---|---|---|---|
| Conservative | James Mackenzie Maclean | 8,386 | 52.6 | +5.1 | |
| Liberal | Edward Reed | 7,562 | 47.4 | -5.1 | |
| Majority | 824 | 5.2 | N/A | ||
| Turnout | 15,948 | 82.4 | +0.9 | ||
| Registered electors | 19,358 | ||||
| Conservative gain from Liberal | Swing | +5.1 | |||
Elections in the 1900s
| Party | Candidate | Votes | % | ± | |
|---|---|---|---|---|---|
| Liberal | Edward Reed | 9,342 | 52.2 | +4.8 | |
| Conservative | Joseph Lawrence | 8,541 | 47.8 | −4.8 | |
| Majority | 801 | 4.4 | N/A | ||
| Turnout | 17,883 | 80.0 | -2.4 | ||
| Registered electors | 22,361 | ||||
| Liberal gain from Conservative | Swing | +4.8 | |||
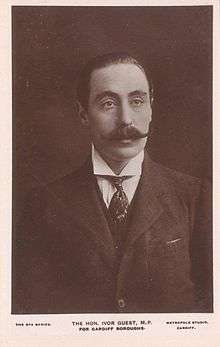
Guest
| Party | Candidate | Votes | % | ± | |
|---|---|---|---|---|---|
| Liberal | Ivor Guest | 12,434 | 56.9 | +4.7 | |
| Conservative | James Fortescue-Flannery | 9,429 | 43.1 | −4.7 | |
| Majority | 3,005 | 13.8 | +9.4 | ||
| Turnout | 21,863 | 80.8 | +0.8 | ||
| Registered electors | 27,057 | ||||
| Liberal hold | Swing | +4.7 | |||
Elections in the 1910s

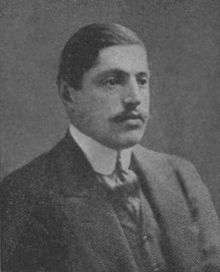
Thomas
| Party | Candidate | Votes | % | ± | |
|---|---|---|---|---|---|
| Liberal | David Alfred Thomas | 13,207 | 53.1 | -3.8 | |
| Conservative | Ninian Crichton-Stuart | 11,652 | 46.9 | +3.8 | |
| Majority | 1,555 | 6.2 | -7.6 | ||
| Turnout | 86.5 | +5.7 | |||
| Liberal hold | Swing | -3.8 | |||
Crichton-Stuart
| Party | Candidate | Votes | % | ± | |
|---|---|---|---|---|---|
| Conservative | Ninian Crichton-Stuart | 12,181 | 50.6 | +3.7 | |
| Liberal | Clarendon Hyde | 11,882 | 49.4 | -3.7 | |
| Majority | 299 | 1.2 | 7.4 | ||
| Turnout | 83.8 | ||||
| Conservative gain from Liberal | Swing | +3.7 | |||
| Party | Candidate | Votes | % | ± | |
|---|---|---|---|---|---|
| Unionist | James Cory | Unopposed | |||
| Unionist hold | |||||
References
- ↑ "The General Election". Morning Post. 7 July 1852. pp. 2–4. Retrieved 21 August 2018 – via British Newspaper Archive. (Subscription required (help)).
- ↑ "Cardiff". Exeter and Plymouth Gazette. 10 July 1852. p. 4. Retrieved 21 August 2018 – via British Newspaper Archive. (Subscription required (help)).
- ↑ "Cardiff Boroughs". Monmouthshire Beacon. 10 July 1852. p. 4. Retrieved 21 August 2018 – via British Newspaper Archive. (Subscription required (help)).
- ↑ "Windsor and Eton Express". 28 March 1857. p. 4. Retrieved 21 August 2018 – via British Newspaper Archive. (Subscription required (help)).
- 1 2 3 4 5 6 7 Craig, F. W. S., ed. (1977). British Parliamentary Election Results 1832-1885 (e-book)
|format=requires|url=(help) (1st ed.). London: Macmillan Press. ISBN 978-1-349-02349-3. - 1 2 3 4 5 6 7 8 9 10 British Parliamentary Election Results 1885-1918, FWS Craig
- ↑ Debrett's House of Commons & Judicial Bench, 1886
- ↑ Debrett's House of Commons & Judicial Bench, 1896
Bibliography
- Morgan, Kenneth O. (1960). "Democratic Politics in Glamorgan, 1884–1914". Morgannwg. 4: 5–27.
This article is issued from
Wikipedia.
The text is licensed under Creative Commons - Attribution - Sharealike.
Additional terms may apply for the media files.