City of Cardiff Council election, 2008
|
| ||||||||||||||||||||||||||||||||||||||||
| ||||||||||||||||||||||||||||||||||||||||
All 75 seats to City of Cardiff Council 38 seats needed for a majority | ||||||||||||||||||||||||||||||||||||||||
|---|---|---|---|---|---|---|---|---|---|---|---|---|---|---|---|---|---|---|---|---|---|---|---|---|---|---|---|---|---|---|---|---|---|---|---|---|---|---|---|---|
| ||||||||||||||||||||||||||||||||||||||||
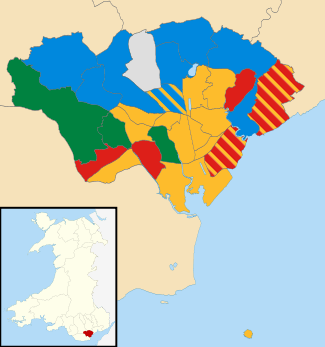 Map showing the results of the 2008 City of Cardiff Council Elections. | ||||||||||||||||||||||||||||||||||||||||
| ||||||||||||||||||||||||||||||||||||||||
The Cardiff Council election in 2008 was held on 1 May, along with other local elections in the UK.[1] All 75 seats of Cardiff Council were contested, with it remaining in no overall control. It was preceded by the 2004 election and followed by the 2012 election
Election result
Candidates from nine parties as well as independents stood for election. Of these Liberal Democrat, Conservative, Labour, Plaid Cymru and independent councillors were elected.[2]
| Party | Seats | Gains | Losses | Net gain/loss | Seats % | Votes % | Votes | +/− | |
|---|---|---|---|---|---|---|---|---|---|
| Liberal Democrat | 35 | 5 | 3 | +2 | 46.7 | 26.17% | 66,940 | ||
| Conservative | 17 | 7 | 3 | +4 | 22.7 | 27.46% | 70,238 | ||
| Labour | 13 | 1 | -14 | -13 | 17.3 | 26.97% | 68,973 | ||
| Plaid Cymru | 7 | 4 | 0 | +4 | 9.3 | 12.56% | 32,120 | ||
| Independent | 3 | 3 | 0 | +3 | 4.0 | 4.56% | 11,685 | ||
| Green | 0 | 0 | 0 | 0 | 0 | 1.47% | 3,784 | ||
| Socialist Alliance | 0 | 0 | 0 | 0 | 0 | 0.24% | 632 | ||
| UKIP | 0 | 0 | 0 | 0 | 0 | 0.15% | 398 | ||
| Communist | 0 | 0 | 0 | 0 | 0 | 0.00% | 310 | ||
| Left Alliance | 0 | 0 | 0 | 0 | 0 | 0.00% | 91 | ||
- A The changes in party councillors in this table differs from that list by the BBC because it is based purely on changes from the previous election, not taking into account mid-term party defections or by-elections
Outcome
After this election the council remained in no overall control with the Liberal Democrats remaining the largest party on the council, after a net gain of seats. All parties gained seats, other than Labour who halved their seat share from the previous election. Three independents were elected for the first time since 1999, although two of these were former Conservative councillors that defected during the previous term.[3]
The Liberal Democrats formed a coalition with the Plaid Cymru group to lead the council; Liberal Democrat Rodney Berman became council leader, with Neil McEvoy of Plaid Cymru and Judith Woodman of the Liberal Democrats becoming deputy leaders.[4] The Conservative party emerged as the official opposition on the council, after they became the second largest party.
Ward results
The ward results listed below[2] are based on the changes from the 2004 elections,[5] not taking into any mid-term by-elections or party defections.
Adamstown (two seats)
| Party | Candidate | Votes | % | ± | |
|---|---|---|---|---|---|
| Liberal Democrat | Nigel Howells | 925 | |||
| Liberal Democrat | John Dixon | 891 | |||
| Labour | Sarah Merry | 431 | |||
| Labour | Peter Payne | 383 | |||
| Conservative | Julie Jenkins | 160 | |||
| Conservative | Mary Newman | 151 | |||
| Socialist Alternative | David Bartlett | 98 | |||
| Plaid Cymru | Fran Rawlings | 66 | |||
| The Left Party | Joe Redmond | 55 | |||
| Turnout | 1660 | 27.2 | -3.6 | ||
| Liberal Democrat hold | Swing | ||||
| Liberal Democrat hold | Swing | ||||
Butetown (one seat)
| Party | Candidate | Votes | % | ± | |
|---|---|---|---|---|---|
| Liberal Democrat | Delme Greening | 708 | 40.8 | ||
| Labour | Vaughan Gething* | 594 | 34.2 | ||
| Conservative | Maria Hill | 294 | 16.9 | ||
| Independent | Ben Foday | 103 | 5.9 | ||
| The Left Party | Karen Tyre | 36 | 2.1 | ||
| Majority | 114 | 6.6 | |||
| Turnout | 1750 | 28.9 | -2.6 | ||
| Liberal Democrat gain from Labour | Swing | ||||
Caerau (two seats)
| Party | Candidate | Votes | % | ± | |
|---|---|---|---|---|---|
| Liberal Democrat | Jacqui Gasson* | 1176 | |||
| Liberal Democrat | Roger Burley* | 1091 | |||
| Labour | Harry Ernest | 750 | |||
| Labour | Maliika Kaaba | 584 | |||
| Conservative | Alec Burns | 285 | |||
| Conservative | Clive Williams | 255 | |||
| Plaid Cymru | John Garland | 213 | |||
| Plaid Cymru | Tomos Evans | 178 | |||
| Turnout | 2327 | 31.6 | +3.6 | ||
| Liberal Democrat hold | Swing | ||||
| Liberal Democrat hold | Swing | ||||
Canton (three seats)
| Party | Candidate | Votes | % | ± | |
|---|---|---|---|---|---|
| Labour | Ramesh Patel* | 1814 | |||
| Labour | Richard Cook* | 1580 | |||
| Labour | Cerys Furlong | 1497 | |||
| Plaid Cymru | Elin Tudur | 1257 | |||
| Plaid Cymru | Colin Nosworthy | 1170 | |||
| Plaid Cymru | Numan Ahmed | 1113 | |||
| Conservative | Pamela Richards | 858 | |||
| Conservative | Harold Burns | 820 | |||
| Conservative | Andrew Sweet | 813 | |||
| Green | Jake Griffiths | 515 | |||
| Green | Carys Williams | 411 | |||
| Green | Jane Richards | 396 | |||
| Liberal Democrat | Andrew Owen | 361 | |||
| Liberal Democrat | Keith Clements | 331 | |||
| Liberal Democrat | Alastair Sloan | 224 | |||
| Socialist Alternative | Lianne Francis | 158 | |||
| Turnout | 4660 | 44.2 | +2.4 | ||
| Labour hold | Swing | ||||
| Labour hold | Swing | ||||
| Labour hold | Swing | ||||
Cathays (four seats)
| Party | Candidate | Votes | % | ± | |
|---|---|---|---|---|---|
| Liberal Democrat | Jonathan Aylwin | 1114 | |||
| Liberal Democrat | Simon Pickard | 1051 | |||
| Liberal Democrat | Elizabeth Clark | 1033 | |||
| Liberal Democrat | Simon Wakefield | 958 | |||
| Labour | Daniel Gordon | 453 | |||
| Labour | Stephen Farrington | 431 | |||
| Labour | Michaela Neild | 426 | |||
| Labour | Reg Surridge | 416 | |||
| Plaid Cymru | Owen John Thomas | 397 | |||
| Plaid Cymru | Mari Sion | 360 | |||
| Plaid Cymru | Tony Couch | 335 | |||
| Green | Emma Bridger | 335 | |||
| Conservative | Alan Berriman | 327 | |||
| Conservative | Richard Nelmes | 319 | |||
| Plaid Cymru | Cristopher Heighway | 313 | |||
| Conservative | Janine Jones-Prichard | 308 | |||
| Conservative | Stephen Johns | 293 | |||
| Green | John Cowie | 286 | |||
| Turnout | 2437 | 16.4 | -5.4 | ||
| Liberal Democrat hold | Swing | ||||
| Liberal Democrat hold | Swing | ||||
| Liberal Democrat hold | Swing | ||||
| Liberal Democrat hold | Swing | ||||
Creigiau & St. Fagans (one seat)
| Party | Candidate | Votes | % | ± | |
|---|---|---|---|---|---|
| Plaid Cymru | Delme Bowen* | 1187 | 62.1 | ||
| Conservative | Angela Jones-Evans | 441 | 23.1 | ||
| Labour | Jonathan Evans | 188 | 9.8 | ||
| Liberal Democrat | Sarah Fyson | 94 | 4.9 | ||
| Majority | 746 | ||||
| Turnout | 1913 | 49.2 | +3.5 | ||
| Plaid Cymru hold | Swing | ||||
Cyncoed (three seats)
| Party | Candidate | Votes | % | ± | |
|---|---|---|---|---|---|
| Liberal Democrat | Kate Lloyd | 2294 | |||
| Liberal Democrat | Margaret Jones | 2166 | |||
| Liberal Democrat | David Rees | 2152 | |||
| Conservative | Lee Gonzalez | 1439 | |||
| Conservative | Peter Meyer | 1383 | |||
| Conservative | Vicci Stocqueler | 1320 | |||
| Labour | Diane Owen | 518 | |||
| Labour | Wendy Heaven | 475 | |||
| Labour | David Taylor | 415 | |||
| Plaid Cymru | Alun Ogwen | 275 | |||
| Turnout | 4300 | 49.7 | +0.3 | ||
| Liberal Democrat hold | Swing | ||||
| Liberal Democrat hold | Swing | ||||
| Liberal Democrat hold | Swing | ||||
Ely (three seats)
| Party | Candidate | Votes | % | ± | |
|---|---|---|---|---|---|
| Labour | Brian Finn | 1273 | |||
| Labour | Irene Goddard* | 1257 | |||
| Labour | Russell Goodway* | 1048 | |||
| Plaid Cymru | Paul Kemble | 687 | |||
| Plaid Cymru | Malcolm Marshall | 657 | |||
| Conservative | Gerard Charmley | 525 | |||
| Conservative | Margret Evans | 520 | |||
| Conservative | Rob Thomas | 491 | |||
| Plaid Cymru | Rukshana Islam | 470 | |||
| Liberal Democrat | Joanne Foster | 248 | |||
| Liberal Democrat | Sian Cliff | 241 | |||
| Liberal Democrat | Clare Lutwyche | 208 | |||
| Turnout | 2719 | 28.7 | +0.2 | ||
| Labour hold | Swing | ||||
| Labour hold | Swing | ||||
| Labour hold | Swing | ||||
Fairwater (three seats)
| Party | Candidate | Votes | % | ± | |
|---|---|---|---|---|---|
| Plaid Cymru | Neil McEvoy | 1875 | |||
| Plaid Cymru | Lisa Ford | 1802 | |||
| Plaid Cymru | Keith Parry | 1560 | |||
| Labour | John Norman | 949 | |||
| Labour | Michael Michael | 944 | |||
| Labour | Derek Rees | 871 | |||
| Conservative | Richard John | 837 | |||
| Conservative | Oliver Owen | 780 | |||
| Conservative | Richard Minshull | 750 | |||
| Liberal Democrat | Hilary Borrow | 197 | |||
| Liberal Democrat | Peter Borrow | 182 | |||
| Liberal Democrat | Gareth Price | 175 | |||
| Turnout | 3824 | 40.8 | +5.1 | ||
| Plaid Cymru gain from Labour | Swing | ||||
| Plaid Cymru gain from Labour | Swing | ||||
| Plaid Cymru gain from Labour | Swing | ||||
Gabalfa (two seats)
| Party | Candidate | Votes | % | ± | |
|---|---|---|---|---|---|
| Liberal Democrat | Ed Bridges | 999 | |||
| Liberal Democrat | Cathy Pearcy | 891 | |||
| Labour | Dilwar Ali | 371 | |||
| Labour | Joe Monks | 313 | |||
| Conservative | Matthew Lane | 217 | |||
| Conservative | Vivienne Ward | 211 | |||
| Plaid Cymru | Brian Coman | 175 | |||
| Green | Rosa Thomas | 129 | |||
| Plaid Cymru | Anthony Evans | 111 | |||
| Turnout | 1758 | 25.7 | -2.2 | ||
| Liberal Democrat hold | Swing | ||||
| Liberal Democrat hold | Swing | ||||
Grangetown (three seats)
| Party | Candidate | Votes | % | ± | |
|---|---|---|---|---|---|
| Liberal Democrat | Francesca Montemaggi* | 1357 | |||
| Liberal Democrat | Asghar Ali* | 1319 | |||
| Liberal Democrat | David Morgan | 1317 | |||
| Labour | Lynda Thorne | 1138 | |||
| Labour | Stephen Brooks | 1131 | |||
| Labour | David Collins | 1104 | |||
| Plaid Cymru | Farida Alsam | 1099 | |||
| Plaid Cymru | Patrick Daley | 1009 | |||
| Plaid Cymru | Ioan Bellin | 920 | |||
| Conservative | Benjamin Green | 546 | |||
| Conservative | Mark Jones | 533 | |||
| Conservative | Michael Wallbank | 482 | |||
| Communist | Rick Newnham | 111 | |||
| Turnout | 4266 | 36.8 | -0.2 | ||
| Liberal Democrat hold | Swing | ||||
| Liberal Democrat hold | Swing | ||||
| Liberal Democrat hold | Swing | ||||
Heath (three seats)
| Party | Candidate | Votes | % | ± | |
|---|---|---|---|---|---|
| Conservative | Ron Page | 2205 | |||
| Conservative | Lyn Hudson | 2135 | |||
| Liberal Democrat | Fenella Bowden | 1877 | |||
| Conservative | Christopher Williams | 1819 | |||
| Liberal Democrat | Michelle Michaells | 1642 | |||
| Liberal Democrat | Gwllym Owen | 1545 | |||
| Labour | Rob Henley | 896 | |||
| Labour | Fatimah Begum | 656 | |||
| Labour | Iftakhar Khan | 575 | |||
| Plaid Cymru | Nans Couch | 468 | |||
| Green | Andrew Connell | 435 | |||
| Turnout | 4995 | 51.9 | -0.5 | ||
| Conservative gain from Liberal Democrat | Swing | ||||
| Conservative gain from Liberal Democrat | Swing | ||||
| Liberal Democrat hold | Swing | ||||
Lisvane (one seat)
| Party | Candidate | Votes | % | ± | |
|---|---|---|---|---|---|
| Conservative | David Walker | 1260 | 79.9 | ||
| Labour | Paul Jeffries | 189 | 12.0 | ||
| Liberal Democrat | Robert Collins | 128 | 8.1 | ||
| Majority | 1071 | 67.9 | |||
| Turnout | 1583 | 56.0 | +1.6 | ||
| Conservative hold | Swing | ||||
Llandaff (two seats)
| Party | Candidate | Votes | % | ± | |
|---|---|---|---|---|---|
| Liberal Democrat | Kirsty Davies | 1273 | |||
| Liberal Democrat | Gareth Aubrey | 1173 | |||
| Conservative | Craig Williams | 1109 | |||
| Conservative | Clare Bath | 1104 | |||
| Labour | John Sheppard | 1019 | |||
| Labour | Gill Green | 825 | |||
| Plaid Cymru | Gillian M Green | 454 | |||
| Turnout | 3600 | 50.4 | +3.3 | ||
| Liberal Democrat gain from Labour | Swing | ||||
| Liberal Democrat gain from Labour | Swing | ||||
Llandaff North (two seats)
| Party | Candidate | Votes | % | ± | |
|---|---|---|---|---|---|
| Liberal Democrat | Ann Rowland-Jones | 976 | |||
| Liberal Democrat | Jacqui Hooper | 908 | |||
| Labour | Terry Gilder | 771 | |||
| Labour | Karen Screen | 757 | |||
| Conservative | Julie Driscoll | 453 | |||
| Conservative | James Ward | 390 | |||
| Plaid Cymru | John Rowlands | 195 | |||
| Plaid Cymru | Ieuan Wyn | 163 | |||
| Turnout | 2382 | 42.2 | +5.0 | ||
| Liberal Democrat gain from Labour | Swing | ||||
| Liberal Democrat hold | Swing | ||||
Llanishen (four seats)
| Party | Candidate | Votes | % | ± | |
|---|---|---|---|---|---|
| Conservative | Jonathan Burns | 2928 | |||
| Conservative | Craig Piper | 2828 | |||
| Conservative | Richard Foley | 2734 | |||
| Conservative | Robert Smith | 2623 | |||
| Labour | Garry Hunt | 1769 | |||
| Labour | John Imperato | 1496 | |||
| Labour | Marie John | 1491 | |||
| Labour | Caroline Derbyshire | 1478 | |||
| Liberal Democrat | John Frankham-Barnes | 664 | |||
| Liberal Democrat | Sarah Bridges | 605 | |||
| Plaid Cymru | Lona Roberts | 592 | |||
| Plaid Cymru | David Davies | 588 | |||
| Liberal Democrat | Laura Pearcy | 544 | |||
| Liberal Democrat | Ian Porter | 449 | |||
| Plaid Cymru | Gwennol Haf | 377 | |||
| Plaid Cymru | Steven Thomas | 329 | |||
| Turnout | 5635 | 46.2 | +1.3 | ||
| Conservative hold | Swing | ||||
| Conservative hold | Swing | ||||
| Conservative hold | Swing | ||||
| Conservative hold | Swing | ||||
Llanrumney (three seats)
| Party | Candidate | Votes | % | ± | |
|---|---|---|---|---|---|
| Labour | Jackie Parry | 1126 | |||
| Labour | Heather Joyce | 1105 | |||
| Labour | Derrick Morgan | 1090 | |||
| Plaid Cymru | Colin Lewis | 752 | |||
| Conservative | Philip James | 650 | |||
| Conservative | Gerrard Harris | 633 | |||
| Plaid Cymru | Terence O'Neill | 621 | |||
| Plaid Cymru | Dai Reeves | 531 | |||
| Conservative | Allyson Thomas | 456 | |||
| Liberal Democrat | Peter Randerson | 135 | |||
| Liberal Democrat | Hugh Minor | 134 | |||
| Liberal Democrat | Ian Walton | 116 | |||
| Turnout | 2632 | 33.0 | +1.1 | ||
| Labour hold | Swing | ||||
| Labour hold | Swing | ||||
| Labour hold | Swing | ||||
Pentwyn (four seats)
| Party | Candidate | Votes | % | ± | |
|---|---|---|---|---|---|
| Liberal Democrat | Judith Woodman | 1851 | |||
| Liberal Democrat | Paul Chaundy | 1808 | |||
| Liberal Democrat | Joseph Carter | 1786 | |||
| Liberal Democrat | Keith Hyde | 1778 | |||
| Labour | Mark Davies | 893 | |||
| Labour | Peter Bradbury | 892 | |||
| Labour | Anthony Hunt | 860 | |||
| Conservative | Nigel Morgan | 576 | |||
| Conservative | Huw John | 560 | |||
| Conservative | Philip Marsden | 530 | |||
| Conservative | Gareth Jones-Prichard | 504 | |||
| Socialist Alternative | Steve Williams | 376 | |||
| Turnout | 3534 | 34.5 | -2.1 | ||
| Liberal Democrat hold | Swing | ||||
| Liberal Democrat hold | Swing | ||||
| Liberal Democrat hold | Swing | ||||
| Liberal Democrat hold | Swing | ||||
Pentyrch (one seat)
| Party | Candidate | Votes | % | ± | |
|---|---|---|---|---|---|
| Conservative | Simon Roberts | 478 | 34.4 | ||
| Labour | Christine Priday | 429 | 30.8 | ||
| Plaid Cymru | Jane Reece | 275 | 19.8 | ||
| Liberal Democrat | Russell Hargrave | 110 | 7.9 | ||
| Independent | Michael Jones | 99 | 7.1 | ||
| Majority | 49 | 3.6 | |||
| Turnout | 1392 | 50.8 | +1.1 | ||
| Conservative gain from Labour | Swing | ||||
Penylan (three seats)
| Party | Candidate | Votes | % | ± | |
|---|---|---|---|---|---|
| Liberal Democrat | Tricia Burfoot | 2294 | |||
| Liberal Democrat | Freda Salway | 2200 | |||
| Liberal Democrat | Bill Kelloway | 2145 | |||
| Conservative | Susan Williams | 766 | |||
| Conservative | Liz Morgan | 742 | |||
| Conservative | Michael Parsons | 686 | |||
| Labour | Judith Anderson | 680 | |||
| Labour | Ralph Rees | 670 | |||
| Labour | Peter Wong | 566 | |||
| Independent | Tony Verderame | 535 | |||
| Plaid Cymru | Meic Peterson | 351 | |||
| Plaid Cymru | Helen Bradley | 332 | |||
| Plaid Cymru | Ruth Underdown | 314 | |||
| Turnout | 4336 | 44.8 | +0.6 | ||
| Liberal Democrat hold | Swing | ||||
| Liberal Democrat hold | Swing | ||||
| Liberal Democrat hold | Swing | ||||
Plasnewydd (four seats)
| Party | Candidate | Votes | % | ± | |
|---|---|---|---|---|---|
| Liberal Democrat | Elgan Morgan* | 1524 | |||
| Liberal Democrat | Rodney Berman* | 1479 | |||
| Liberal Democrat | Mark Stephens* | 1457 | |||
| Liberal Democrat | Richard Jerrett* | 1411 | |||
| Labour | Susan Lent | 1207 | |||
| Labour | Mary McGarry | 1040 | |||
| Labour | Mohammad Javed | 1035 | |||
| Labour | Paul Mitchell | 887 | |||
| Green | Sam Coates | 545 | |||
| Green | Anthony Matthews | 518 | |||
| Plaid Cymru | Ashraf Ali | 448 | |||
| Plaid Cymru | Gordon Bateman | 428 | |||
| Conservative | Enid Harries | 398 | |||
| Conservative | Kathleen Fisher | 361 | |||
| Conservative | Maureen Blackmore | 348 | |||
| Conservative | Dom Stocqueler | 283 | |||
| Turnout | 3626 | 27.2 | -3.5 | ||
| Liberal Democrat hold | Swing | ||||
| Liberal Democrat hold | Swing | ||||
| Liberal Democrat hold | Swing | ||||
| Liberal Democrat hold | Swing | ||||
Pontprennau and Old St. Mellons (two seats)
| Party | Candidate | Votes | % | ± | |
|---|---|---|---|---|---|
| Conservative | Dianne Rees | 1362 | |||
| Conservative | Jane Rogers | 1274 | |||
| Labour | Georgina Phillips | 1092 | |||
| Labour | Lisa Stevens | 938 | |||
| Liberal Democrat | Ronald Michaells | 237 | |||
| Liberal Democrat | Charles Woodman | 233 | |||
| Turnout | 2710 | 40.3 | +1.4 | ||
| Conservative hold | Swing | ||||
| Conservative gain from Labour | Swing | ||||
Radyr (one seat)
| Party | Candidate | Votes | % | ± | |
|---|---|---|---|---|---|
| Conservative | Roderick McKerlich | 1344 | 60.2 | ||
| Labour | James Knight | 440 | 19.7 | ||
| Liberal Democrat | Catherine Sloan | 234 | 10.5 | ||
| Plaid Cymru | Ian Hughes | 215 | 9.6 | ||
| Majority | 904 | 40.5 | |||
| Turnout | 2241 | 51.5 | -1.5 | ||
| Conservative gain from Labour | Swing | ||||
Rhiwbina (three seats)
| Party | Candidate | Votes | % | ± | |
|---|---|---|---|---|---|
| Independent | Jayne Cowan* | 3,724 | |||
| Independent | Adrian Robson | 3,452 | |||
| Independent | Brian Jones | 2,828 | |||
| Conservative | Gareth Neale* | 1,747 | |||
| Conservative | Debi Ashton | 1,461 | |||
| Conservative | Chris Taylor | 1,389 | |||
| Labour | John Wake | 600 | |||
| Plaid Cymru | Alun Guy | 272 | |||
| Plaid Cymru | Ann Brain | 264 | |||
| Plaid Cymru | Falmai Griffiths | 248 | |||
| Green | Anne Greagsby | 214 | |||
| Liberal Democrat | Patricia Azzopardi | 200 | |||
| Liberal Democrat | Rachel Thomas | 165 | |||
| Liberal Democrat | Edward Mason | 128 | |||
| Turnout | 5,719 | 62.4 | +7.9 | ||
| Independent gain from Conservative | Swing | ||||
| Independent gain from Conservative | Swing | ||||
| Independent gain from Conservative | Swing | ||||
Riverside (three seats)
| Party | Candidate | Votes | % | ± | |
|---|---|---|---|---|---|
| Plaid Cymru | Sarul Islam | 1064 | |||
| Plaid Cymru | Gwenllian Lansdown | 1064 | |||
| Plaid Cymru | Jas Singh | 991 | |||
| Labour | Mark Drakeford | 786 | |||
| Labour | Ali Ahmed | 743 | |||
| Labour | Susan Evans | 707 | |||
| Conservative | Russell Cotty | 295 | |||
| Liberal Democrat | Molly Hughes | 280 | |||
| Liberal Democrat | Phil Bale | 250 | |||
| Liberal Democrat | Michael Hyde | 235 | |||
| Conservative | Shazia Awan | 209 | |||
| Conservative | Shana Awan | 206 | |||
| Turnout | 3659 | 39.9 | -0.6 | ||
| Plaid Cymru hold | Swing | ||||
| Plaid Cymru hold | Swing | ||||
| Plaid Cymru gain from Labour | Swing | ||||
Rumney (two seats)
| Party | Candidate | Votes | % | ± | |
|---|---|---|---|---|---|
| Conservative | John Ireland | 1073 | |||
| Conservative | Duncan MacDonald | 1038 | |||
| Labour | Robert Derbyshire* | 908 | |||
| Labour | Geoff Parry | 870 | |||
| Liberal Democrat | Anabella Rees | 200 | |||
| Liberal Democrat | Emma Woodman | 189 | |||
| Turnout | 2248 | 34.5 | +0.4 | ||
| Conservative gain from Labour | Swing | ||||
| Conservative gain from Labour | Swing | ||||
Splott (three seats)
| Party | Candidate | Votes | % | ± | |
|---|---|---|---|---|---|
| Liberal Democrat | Gavin Cox* | 1490 | |||
| Labour | Clarissa Holland* | 1485 | |||
| Labour | Martin Holland | 1350 | |||
| Labour | Matthew Greenough | 1215 | |||
| Liberal Democrat | Alex Evans* | 1211 | |||
| Liberal Democrat | Nadeem Majid | 1149 | |||
| Conservative | Martyn Miller | 373 | |||
| Conservative | Paul Pavia | 329 | |||
| Conservative | Yasser Mahmood | 292 | |||
| Plaid Cymru | Kibria Shah | 275 | |||
| Plaid Cymru | Nerys Morgan | 231 | |||
| Plaid Cymru | Daniel Mason | 212 | |||
| Communist | Robert Griffiths | 127 | |||
| Turnout | 3480 | 38.5 | +1.1 | ||
| Liberal Democrat hold | Swing | ||||
| Labour gain from Liberal Democrat | Swing | ||||
| Labour hold | Swing | ||||
Trowbridge (three seats)
| Party | Candidate | Votes | % | ± | |
|---|---|---|---|---|---|
| Labour | Ralph Cook* | 1,253 | |||
| Liberal Democrat | Geraldine Grant | 1,142 | |||
| Labour | Monica Walsh* | 1,124 | |||
| Liberal Democrat | Jeremy Townsend | 1,107 | |||
| Liberal Democrat | Elizabeth Woodman | 1,072 | |||
| Labour | Gretta Hunt | 916 | |||
| Independent | Clifford Furnish | 531 | |||
| Conservative | Barbara Jeffreys | 506 | |||
| Conservative | Jean Summerhayes | 482 | |||
| Conservative | Kim Summerhayes | 447 | |||
| Independent | Simon Swanton | 413 | |||
| Turnout | 3,211 | 30.5 | +5.4 | ||
| Labour hold | Swing | ||||
| Liberal Democrat gain from Labour | Swing | ||||
| Labour hold | Swing | ||||
Whitchurch and Tongwynlais (four seats)
| Party | Candidate | Votes | % | ± | |
|---|---|---|---|---|---|
| Conservative | Timothy Davies* | 2948 | |||
| Conservative | Linda Morgan* | 2904 | |||
| Conservative | Brian Griffiths* | 2857 | |||
| Conservative | Michael Jones-Pritchard | 2790 | |||
| Labour | Sophie Howe* | 2658 | |||
| Labour | Peter Howe | 2147 | |||
| Labour | Bev Hampson | 2023 | |||
| Labour | Lucy Merredy | 1962 | |||
| Plaid Cymru | Glenys Evans | 771 | |||
| Plaid Cymru | Wyn Jones | 748 | |||
| Plaid Cymru | Ceri Morgan | 715 | |||
| Plaid Cymru | Dewi Owen | 669 | |||
| Liberal Democrat | Siobhan McGurk | 505 | |||
| Liberal Democrat | Nia Jones | 471 | |||
| Liberal Democrat | Joyce Lentern | 398 | |||
| UKIP | Joe Callan | 398 | |||
| Liberal Democrat | Martin Wolstencroft | 329 | |||
| Turnout | 6703 | 53.1 | +2.7 | ||
| Conservative hold | Swing | ||||
| Conservative hold | Swing | ||||
| Conservative hold | Swing | ||||
| Conservative gain from Labour | Swing | ||||
References
- ↑ "Cardiff Council Election Results 1995-2012" (PDF). The Elections Cente, Plymouth University. Retrieved 23 June 2016.
- 1 2 "County Council Election Results 2008" (pdf). Cardiff council. Retrieved 3 August 2011.
- ↑ "Cardiff Council minutes, 20 July 2006" (pdf). Cardiff Council. pp. 166–167. Retrieved 12 August 2011.
- ↑ "Cardiff and Conwy coalition deals". BBC News. 16 May 2008. Retrieved 12 August 2011.
- ↑ "County Council Election Results 2004" (pdf). Cardiff Council. Retrieved 10 August 2011.
External links
| City of Cardiff Council | |
|---|---|
| Vale of Glamorgan Council | |
| South Glamorgan County Council |
|