California's 26th congressional district
| California's 26th congressional district | |
|---|---|
.tif.png) California's 26th congressional district - since January 3, 2013. | |
| Current Representative | Julia Brownley (D–Westlake Village) |
| Ethnicity | |
| Cook PVI | D+7[2] |
California 26th congressional district is a congressional district in the U.S. state of California currently represented by Democrat Julia Brownley.
The district is centered on the southern Central Coast and inland, and includes most of Ventura County in Southern California. Cities in the district include Camarillo, Oxnard, Ventura, Santa Paula, Thousand Oaks, Westlake Village, Moorpark, and parts of Simi Valley.
- History
From 2003 to 2013, the district spanned the foothills of the San Gabriel Valley from La Cañada Flintridge to Rancho Cucamonga. The district lines were drawn in 2000 as part of a statewide re-districting plan. David Dreier, a Republican, represented the district during this period.
Voting
| Election results from statewide races | |||
|---|---|---|---|
| Year | Office | Results | |
| 2016 | President | Clinton 57.9 - 36.0% | |
| 2012 | President | Obama 54.0 - 43.7% | |
| 2010 | Governor | Whitman 50.4 - 43.8% | |
| Senator | Fiorina 52.7 - 41.9% | ||
| 2008 | President[3] | Obama 51.0 - 47.0% | |
| 2006 | Governor[4] | Schwarzenegger 65.1 - 30.5% | |
| Senator[5] | Feinstein 48.0 - 47.4% | ||
| 2004 | President[6] | Bush 55.1 - 43.7% | |
| Senator[7] | Boxer 48.2 - 47.3% | ||
| 2003 | Recall[8][9] | Yes 67.9 - 32.1% | |
| Schwarzenegger 61.1 - 20.3% | |||
| 2002 | Governor[10] | Simon 54.3 - 37.6% | |
| 2000 | President[11] | Gore 70.3 - 25.4% | |
| Senator[12] | Feinstein 69.9 - 21.7% | ||
| 1998 | Governor | ||
| Senator | |||
| 1996 | President | ||
| 1994 | Governor | ||
| Senator | |||
| 1992 | President | Clinton 56.8 - 24.3% | |
| Senator | Boxer 55.4 - 35.6% | ||
| Senator | Feinstein 61.5 - 30.1% | ||
List of representatives
| Portrait | Representative | Party | Term | Notes | Counties | |
|---|---|---|---|---|---|---|
| District created | January 3, 1953 | |||||
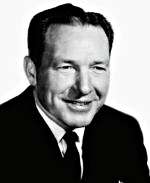 |
Sam Yorty October 1, 1909 – June 5, 1998 (aged 88) |
Democratic | January 3, 1953 – January 3, 1955 |
Redistricted from the 14th district Retired to run for the US Senate 37th Mayor of Los Angeles (1961-1973) |
Los Angeles | |
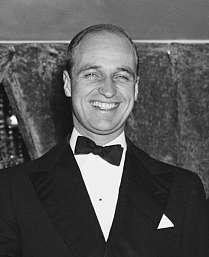 |
James Roosevelt December 23, 1907 – August 13, 1991 (aged 83) |
Democratic | January 3, 1955 – September 30, 1965 |
Resigned to become US delegate to UNESCO | ||
| Vacant | September 30, 1965 – December 15, 1965 |
|||||
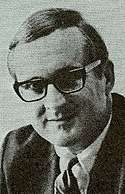 |
Thomas M. Rees March 26, 1925 - December 9, 2003 (aged 78) |
Democratic | December 15, 1965 – January 3, 1975 |
Redistricted to the 23rd district | ||
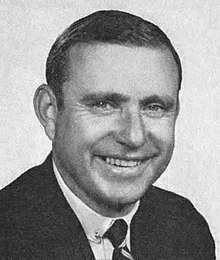 |
John H. Rousselot November 1, 1927 – May 11, 2003 (aged 75) |
Republican | January 3, 1975 – January 3, 1983 |
Redistricted from the 24th district Redistricted to the 30th district and lost | ||
 |
Howard Berman April 15, 1941 |
Democratic | January 3, 1983 – January 3, 1993 |
Los Angeles (central San Fernando Valley) | ||
| January 3, 1993 – January 3, 2003 |
Redistricted to the 28th district | Los Angeles (San Fernando) | ||||
 |
David Dreier July 5, 1952 |
Republican | January 3, 2003 – January 3, 2013 |
Redistricted from the 28th district Retired |
Los Angeles (eastern suburbs), San Bernardino (western suburbs) | |
 |
Julia Brownley August 28, 1952 |
Democratic | January 3, 2013 – Incumbent |
So. Central Coast incl. Oxnard and Thousand Oaks | ||
Election results
|
1952 • 1954 • 1956 • 1958 • 1960 • 1962 • 1964 • 1965 (Special) • 1966 • 1968 • 1970 • 1972 • 1974 • 1976 • 1978 • 1980 • 1982 • 1984 • 1986 • 1988 • 1990 • 1992 • 1994 • 1996 • 1998 • 2000 • 2002 • 2004 • 2006 • 2008 • 2010 • 2012 • 2014 • 2016 |
1952
| Party | Candidate | Votes | % | |
|---|---|---|---|---|
| Democratic | Sam Yorty (incumbent) | 157,973 | 88 | |
| Progressive | Horace V. Alexander | 21,465 | 12 | |
| Total votes | 179,438 | 100.0 | ||
| Turnout | ||||
| Democratic hold | ||||
1954
| Party | Candidate | Votes | % | |
|---|---|---|---|---|
| Democratic | James Roosevelt | 94,261 | 60.1 | |
| Republican | Theodore R. "Ted" Owings | 62,585 | 39.9 | |
| Total votes | 156,856 | 100.0 | ||
| Turnout | ||||
| Democratic hold | ||||
1956
| Party | Candidate | Votes | % | |
|---|---|---|---|---|
| Democratic | James Roosevelt (incumbent) | 133,036 | 68.8 | |
| Republican | Edward H. Gibbons | 60,230 | 31.2 | |
| Total votes | 193,266 | 100.0 | ||
| Turnout | ||||
| Democratic hold | ||||
1958
| Party | Candidate | Votes | % | |
|---|---|---|---|---|
| Democratic | James Roosevelt (incumbent) | 125,495 | 72.2 | |
| Republican | Crispus Wright | 48,248 | 27.8 | |
| Total votes | 173,743 | 100.0 | ||
| Turnout | ||||
| Democratic hold | ||||
1960
| Party | Candidate | Votes | % | |
|---|---|---|---|---|
| Democratic | James Roosevelt (incumbent) | 150,318 | 73.4 | |
| Republican | William E. McIntyre | 54,540 | 26.6 | |
| Total votes | 204,818 | 100.0 | ||
| Turnout | ||||
| Democratic hold | ||||
1962
| Party | Candidate | Votes | % | |
|---|---|---|---|---|
| Democratic | James Roosevelt (incumbent) | 112,162 | 68.3 | |
| Republican | Daniel Beltz | 52,063 | 31.7 | |
| Total votes | 164,225 | 100.0 | ||
| Turnout | ||||
| Democratic hold | ||||
1964
| Party | Candidate | Votes | % | |
|---|---|---|---|---|
| Democratic | James Roosevelt (incumbent) | 136,025 | 70.3 | |
| Republican | Gil Seton | 57,209 | 29.7 | |
| Total votes | 193,234 | 100.0 | ||
| Turnout | ||||
| Democratic hold | ||||
1965 (Special)
| Party | Candidate | Votes | % | |
|---|---|---|---|---|
| Democratic | Thomas M. Rees | 59.4 | ||
| Republican | Edward M. Marshall | 40.6 | ||
| Total votes | {{{votes}}} | 100.0 | ||
| Turnout | ||||
| Democratic hold | ||||
1966
| Party | Candidate | Votes | % | |
|---|---|---|---|---|
| Democratic | Thomas M. Rees (incumbent) | 103,289 | 62.3 | |
| Republican | Irving Teichner | 62,441 | 37.7 | |
| Total votes | 165,730 | 100.0 | ||
| Turnout | ||||
| Democratic hold | ||||
1968
| Party | Candidate | Votes | % | |
|---|---|---|---|---|
| Democratic | Thomas M. Rees (incumbent) | 132,447 | 65.5 | |
| Republican | Irving Teichner | 63,393 | 31.3 | |
| Peace and Freedom | Jack Weinberg | 6,394 | 3.2 | |
| Total votes | 202,234 | 100.0 | ||
| Turnout | ||||
| Democratic hold | ||||
1970
| Party | Candidate | Votes | % | |
|---|---|---|---|---|
| Democratic | Thomas M. Rees (incumbent) | 130,499 | 71.3 | |
| Republican | Nathaniel Jay Friedman | 47,260 | 25.8 | |
| Peace and Freedom | Lewis B. McCammon | 3,677 | 2.0 | |
| American Independent | Howard E. Hallinan | 1,639 | 0.9 | |
| Total votes | 183,075 | 100.0 | ||
| Turnout | ||||
| Democratic hold | ||||
1972
| Party | Candidate | Votes | % | |
|---|---|---|---|---|
| Democratic | Thomas M. Rees (incumbent) | 160,932 | 68.6 | |
| Republican | Philip Robert Rutta | 65,473 | 27.9 | |
| Peace and Freedom | Mike Timko | 8,094 | 3.5 | |
| Total votes | 234,499 | 100.0 | ||
| Turnout | ||||
| Democratic hold | ||||
1974
| Party | Candidate | Votes | % | |
|---|---|---|---|---|
| Republican | John H. Rousselot (inc.) | 80,782 | 58.9 | |
| Democratic | Paul A. Conforti | 56,487 | 41.1 | |
| Total votes | 137,269 | 100.0 | ||
| Turnout | ||||
| Republican hold | ||||
1976
| Party | Candidate | Votes | % | |
|---|---|---|---|---|
| Republican | John H. Rousselot (inc.) | 112,619 | 65.6 | |
| Democratic | Latta Bruce | 59,093 | 34.4 | |
| Total votes | 171,712 | 100.0 | ||
| Turnout | ||||
| Republican hold | ||||
1978
| Party | Candidate | Votes | % | |
|---|---|---|---|---|
| Republican | John H. Rousselot (inc.) | 113,059 | 100.0 | |
| Turnout | ||||
| Republican hold | ||||
1980
| Party | Candidate | Votes | % | |
|---|---|---|---|---|
| Republican | John H. Rousselot (inc.) | 116,715 | 70.9 | |
| Democratic | Joseph Louis Lisoni | 40,099 | 24.4 | |
| Libertarian | William "B. J." Wagener | 7,700 | 4.7 | |
| Total votes | 164,514 | 100.0 | ||
| Turnout | ||||
| Republican hold | ||||
1982
| Party | Candidate | Votes | % | |||
|---|---|---|---|---|---|---|
| Democratic | Howard Berman | 97,383 | 59.6 | |||
| Republican | Hal Phillips | 66,072 | 40.4 | |||
| Total votes | 163,455 | 100.0 | ||||
| Turnout | ||||||
| Democratic gain from Republican | ||||||
1984
| Party | Candidate | Votes | % | |
|---|---|---|---|---|
| Democratic | Howard Berman (incumbent) | 117,080 | 62.8 | |
| Republican | Miriam Ojeda | 69,372 | 37.2 | |
| Total votes | 186,452 | 100.0 | ||
| Turnout | ||||
| Democratic hold | ||||
1986
| Party | Candidate | Votes | % | |
|---|---|---|---|---|
| Democratic | Howard Berman (incumbent) | 98,091 | 65.1 | |
| Republican | Robert M. Kerns | 52,662 | 34.9 | |
| Total votes | 150,753 | 100.0 | ||
| Turnout | ||||
| Democratic hold | ||||
1988
| Party | Candidate | Votes | % | |
|---|---|---|---|---|
| Democratic | Howard Berman (incumbent) | 126,930 | 70.3 | |
| Republican | Gerald C. "Brodie" Broderson | 53,518 | 29.7 | |
| Total votes | 180,448 | 100.0 | ||
| Turnout | ||||
| Democratic hold | ||||
1990
| Party | Candidate | Votes | % | |
|---|---|---|---|---|
| Democratic | Howard Berman (incumbent) | 78,031 | 61.1 | |
| Republican | Roy Dahlson | 44,492 | 34.8 | |
| Libertarian | Bernard Zimring | 5,268 | 4.1 | |
| Total votes | 127,791 | 100.0 | ||
| Turnout | ||||
| Democratic hold | ||||
1992
| Party | Candidate | Votes | % | |
|---|---|---|---|---|
| Democratic | Howard Berman (incumbent) | 73,807 | 61.0 | |
| Republican | Gary E. Forsch | 36,453 | 30.2 | |
| Peace and Freedom | Margery Hinds | 7,180 | 5.9 | |
| Libertarian | Bernard Zimring | 3,468 | 2.9 | |
| Total votes | 120,908 | 100.0 | ||
| Turnout | ||||
| Democratic hold | ||||
1994
| Party | Candidate | Votes | % | |
|---|---|---|---|---|
| Democratic | Howard Berman (incumbent) | 55,145 | 62.57 | |
| Republican | Gary E. Forsch | 28,423 | 32.25 | |
| Libertarian | Erich D. Miller | 4,570 | 5.19 | |
| Total votes | 88,138 | 100.0 | ||
| Turnout | ||||
| Democratic hold | ||||
1996
| Party | Candidate | Votes | % | |
|---|---|---|---|---|
| Democratic | Howard Berman (incumbent) | 67,525 | 65.9 | |
| Republican | Bill Glass | 29,332 | 28.7 | |
| Libertarian | Scott Fritschler | 3,539 | 3.4 | |
| Natural Law | Gary Hearne | 2,119 | 2.0 | |
| Total votes | 195,545 | 100.0 | ||
| Turnout | ||||
| Democratic hold | ||||
1998
| Party | Candidate | Votes | % | |
|---|---|---|---|---|
| Democratic | Howard Berman (incumbent) | 69,000 | 82.47 | |
| Libertarian | Juan Carlos Ros | 6,556 | 7.84 | |
| Green | Maria Armoudian | 4,858 | 5.81 | |
| Natural Law | David L. Cossak | 3,248 | 3.88 | |
| Total votes | 83,662 | 100.0 | ||
| Turnout | ||||
| Democratic hold | ||||
2000
| Party | Candidate | Votes | % | |
|---|---|---|---|---|
| Democratic | Howard Berman (incumbent) | 96,500 | 84.1 | |
| Libertarian | Bill Farley | 13,052 | 11.4 | |
| Natural Law | David L. Cossak | 5,229 | 4.5 | |
| No party | Robert Edwards (write-in) | 5 | 0.0% | |
| Total votes | 114,786 | 100.0 | ||
| Turnout | ||||
| Democratic hold | ||||
2002
| Party | Candidate | Votes | % | |
|---|---|---|---|---|
| Republican | David Dreier (incumbent) | 95,360 | 63.8 | |
| Democratic | Marjorie Musser Mikels | 50,081 | 33.5 | |
| Libertarian | Randall Weissbuch | 4,089 | 2.7 | |
| Total votes | 149,530 | 100.0 | ||
| Turnout | ||||
| Republican hold | ||||
2004
| Party | Candidate | Votes | % | |
|---|---|---|---|---|
| Republican | David Dreier (incumbent) | 134,596 | 51.6 | |
| Democratic | Cynthia Matthews | 107,522 | 46.8 | |
| Libertarian | Randall Weissbuch | 9,089 | 1.6 | |
| Total votes | 251,207 | 100.0 | ||
| Turnout | ||||
| Republican hold | ||||
2006
| Party | Candidate | Votes | % | |
|---|---|---|---|---|
| Republican | David Dreier (incumbent) | 102,028 | 52.0 | |
| Democratic | Cynthia Matthews | 99,878 | 43.9 | |
| Libertarian | Ted Brown | 5,887 | 2.3 | |
| American Independent | Elliott Graham | 3,503 | 1.8 | |
| Total votes | 179,296 | 100.0 | ||
| Turnout | ||||
| Republican hold | ||||
2008
| Party | Candidate | Votes | % | |
|---|---|---|---|---|
| Republican | David Dreier (incumbent) | 140,615 | 52.7 | |
| Democratic | Russ Warner | 108,039 | 40.4 | |
| Libertarian | Ted Brown | 18,476 | 6.9 | |
| Total votes | 267,130 | 100.0 | ||
| Turnout | ||||
| Republican hold | ||||
2010
| Party | Candidate | Votes | % | |
|---|---|---|---|---|
| Republican | David Dreier (incumbent) | 112,774 | 54.13 | |
| Democratic | Russ Warner | 76,093 | 36.52 | |
| American Independent | David L. Miller | 12,784 | 6.14 | |
| Libertarian | Randall Weissbuch | 6,696 | 3.21 | |
| Total votes | 208,347 | 100.00 | ||
| Turnout | ||||
| Republican hold | ||||
2012
| United States House of Representatives elections in California, 2012 | ||||
|---|---|---|---|---|
| Primary election | ||||
| Party | Candidate | Votes | % | |
| Republican | Tony Strickland | 49,043 | 44.1 | |
| Democratic | Julia Brownley | 29,892 | 26.9 | |
| No party preference | Linda Parks | 20,301 | 18.3 | |
| Democratic | Jess Herrera | 7,244 | 6.5 | |
| Democratic | David Cruz Thayne | 2,809 | 2.5 | |
| Democratic | Alex Maxwell Goldberg | 1,880 | 1.7 | |
| Total votes | 111,169 | 100.0 | ||
| General election | ||||
| Democratic | Julia Brownley | 139,072 | 53% | |
| Republican | Tony Strickland | 124,863 | 47% | |
| Total votes | 263,935 | 100% | ||
| Democratic gain from Republican | ||||
2014
| Party | Candidate | Votes | % | |
|---|---|---|---|---|
| Democratic | Julia Brownley (incumbent) | 87,176 | 51% | |
| Republican | Jeff Gorell | 82,653 | 49% | |
| Total votes | 169,829 | 100% | ||
| Democratic hold | ||||
2016
| Party | Candidate | Votes | % | |
|---|---|---|---|---|
| Democratic | Julia Brownley (incumbent) | 169,248 | 60% | |
| Republican | Rafael A. Dagnesses | 111,059 | 40% | |
| Total votes | 280,307 | 100% | ||
| Democratic hold | ||||
Election results for special elections
2003 Special Election[45]
Recall of Gray Davis
- 67.8% YES
- 32.1% NO
Governor's Race
- 20.3% for Cruz Bustamante (D)
- 14.2% for Tom McClintock (R)
- 61.1% for Arnold Schwarzenegger (R)
2005 Special Election [46]
Proposition 73
Parental notification before termination of minors' pregnancy. Generally regarded as a conservative/Republican ballot measure.
- 55.0% YES
- 45.0% NO
Proposition 77
Redistricting according to a panel of retired judges. Endorsed by Schwarzenegger, and is generally considered to be a conservative/Republican ballot measure.
- 49.8% YES
- 50.2% NO
Proposition 80
Regulation of electric grids and services through California. Generally regarded as a liberal/Democratic ballot measure.
- 32.1% YES
- 67.9% NO
Living former Members
As of April 2015, there are two former members of the U.S. House of Representatives from California's 26th congressional district that are currently living.
| Representative | Term in office | Date of birth (and age) |
|---|---|---|
| Howard Berman | 1983 - 2003 | April 15, 1941 |
| David Dreier | 2003 - 2013 | July 5, 1952 |
Historical district boundaries

See also
References
- ↑ http://www.latimes.com/la-redistricting-map-july-2011,0,5339409.htmlstory#39.71057374407184,-118.14590136718749,5,usCongress,,,current
- ↑ "Partisan Voting Index – Districts of the 115th Congress" (PDF). The Cook Political Report. April 7, 2017. Retrieved April 7, 2017.
- ↑ (2008 President) Archived 2009-02-11 at the Wayback Machine.
- ↑ Statement of Vote (2006 Governor) Archived 2011-08-10 at the Wayback Machine.
- ↑ Statement of Vote (2006 Senator) Archived 2011-08-10 at the Wayback Machine.
- ↑ Statement of Vote (2004 President) Archived 2010-08-01 at the Wayback Machine.
- ↑ Statement of Vote (2004 Senator) Archived 2011-08-10 at the Wayback Machine.
- ↑ Statement of Vote (2003 Recall Question) Archived 2011-05-20 at the Wayback Machine.
- ↑ Statement of Vote (2003 Governor) Archived 2011-05-20 at the Wayback Machine.
- ↑ Statement of Vote (2002 Governor) Archived 2010-11-11 at the Wayback Machine.
- ↑ Statement of Vote (2000 President) Archived 2007-06-11 at the Wayback Machine.
- ↑ Statement of Vote (2000 Senator) Archived 2007-06-11 at the Wayback Machine.
- ↑ 1952 election results
- ↑ 1954 election results
- ↑ 1956 election results
- ↑ 1958 election results
- ↑ 1960 election results
- ↑ 1962 election results
- ↑ 1964 election results
- ↑ 1965 special election results
- ↑ 1966 election results
- ↑ 1968 election results
- ↑ 1970 election results
- ↑ 1972 election results
- ↑ 1974 election results
- ↑ 1976 election results
- ↑ 1978 election results
- ↑ 1980 election results
- ↑ 1982 election results
- ↑ 1984 election results
- ↑ 1986 election results
- ↑ 1988 election results
- ↑ 1990 election results
- ↑ 1992 election results
- ↑ 1994 election results
- ↑ 1996 election results
- ↑ 1998 election results
- ↑ 2000 election results
- ↑ 2002 general election results Archived February 3, 2009, at the Wayback Machine.
- ↑ 2004 general election results
- ↑ 2006 general election results Archived November 27, 2008, at the Wayback Machine.
- ↑ 2008 general election results Archived December 21, 2008, at the Wayback Machine.
- ↑ 2010 general election results
- ↑ 2010 general election results
- ↑ Statement of Vote - 2003 Statewide Special Election Archived 2006-02-07 at the Wayback Machine.
- ↑ Statement of Vote - 2005 Special Statewide Election Archived 2006-02-12 at the Wayback Machine.
External links
- Official Congresswoman Julia Brownley website — representing the 26th District of California.
- GovTrack.us: California's 26th congressional district
- RAND California Election Returns: District Definitions
- California Voter Foundation map — CD26