Albion Township, Ontario
| Albion Township | |
|---|---|
 Albion Township | |
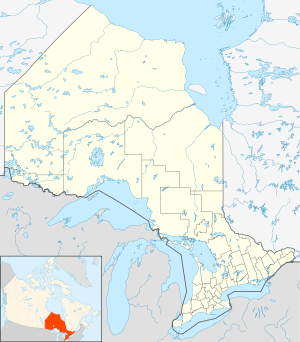 Albion Township Location within Ontario | |
| Coordinates: 43°55′26″N 79°50′38″W / 43.92389°N 79.84389°WCoordinates: 43°55′26″N 79°50′38″W / 43.92389°N 79.84389°W[1] | |
| Country | Canada |
| Province | Ontario |
| Region | Greater Toronto Area |
Albion Township is a former municipality that today is a geographic township in the town of Caledon, in the Greater Toronto Area of Ontario, Canada.[1] It used to be an incorporated township.[2] Its major population centre was Bolton. Albion Township was consolidated with Caledon Township and the upper half of Chinguacousy Township into the Town of Caledon.
Albion Road, a major roadway leading to the township from Weston (today part of the City of Toronto) is named after it.
Climate
| Climate data for Albion Field Centre 1981–2010 (Albion Township and Caledon) | |||||||||||||
|---|---|---|---|---|---|---|---|---|---|---|---|---|---|
| Month | Jan | Feb | Mar | Apr | May | Jun | Jul | Aug | Sep | Oct | Nov | Dec | Year |
| Record high °C (°F) | 12.0 (53.6) |
14.5 (58.1) |
24.5 (76.1) |
30.0 (86) |
33.0 (91.4) |
34.5 (94.1) |
36.1 (97) |
35.0 (95) |
34.4 (93.9) |
30.6 (87.1) |
22.2 (72) |
19.5 (67.1) |
36.1 (97) |
| Average high °C (°F) | −2.8 (27) |
−1.4 (29.5) |
3.7 (38.7) |
11.6 (52.9) |
18.8 (65.8) |
23.7 (74.7) |
26.3 (79.3) |
25.1 (77.2) |
19.9 (67.8) |
13.2 (55.8) |
5.8 (42.4) |
−0.3 (31.5) |
12.0 (53.6) |
| Daily mean °C (°F) | −7.0 (19.4) |
−5.9 (21.4) |
−1.4 (29.5) |
6.1 (43) |
12.4 (54.3) |
17.3 (63.1) |
19.9 (67.8) |
19.1 (66.4) |
14.3 (57.7) |
8.1 (46.6) |
2.1 (35.8) |
−3.9 (25) |
6.7 (44.1) |
| Average low °C (°F) | −11.2 (11.8) |
−10.4 (13.3) |
−6.6 (20.1) |
0.5 (32.9) |
5.9 (42.6) |
10.9 (51.6) |
13.5 (56.3) |
13.0 (55.4) |
8.6 (47.5) |
2.9 (37.2) |
−1.7 (28.9) |
−7.4 (18.7) |
1.5 (34.7) |
| Record low °C (°F) | −36.5 (−33.7) |
−35.0 (−31) |
−31.5 (−24.7) |
−21.1 (−6) |
−6.1 (21) |
−1.5 (29.3) |
1.7 (35.1) |
−0.5 (31.1) |
−5.0 (23) |
−11.5 (11.3) |
−19.0 (−2.2) |
−32.0 (−25.6) |
−36.5 (−33.7) |
| Average precipitation mm (inches) | 60.4 (2.378) |
50.2 (1.976) |
50.3 (1.98) |
67.0 (2.638) |
76.1 (2.996) |
75.5 (2.972) |
81.8 (3.22) |
77.4 (3.047) |
75.0 (2.953) |
68.3 (2.689) |
81.7 (3.217) |
57.7 (2.272) |
821.5 (32.343) |
| Average rainfall mm (inches) | 24.0 (0.945) |
22.2 (0.874) |
27.3 (1.075) |
63.0 (2.48) |
76.1 (2.996) |
75.5 (2.972) |
81.8 (3.22) |
77.4 (3.047) |
75.0 (2.953) |
64.9 (2.555) |
67.8 (2.669) |
25.9 (1.02) |
681.0 (26.811) |
| Average snowfall cm (inches) | 36.4 (14.33) |
28.0 (11.02) |
23.0 (9.06) |
4.0 (1.57) |
0.0 (0) |
0.0 (0) |
0.0 (0) |
0.0 (0) |
0.0 (0) |
3.4 (1.34) |
13.8 (5.43) |
31.9 (12.56) |
140.5 (55.31) |
| Average precipitation days (≥ 0.2 mm) | 12.4 | 9.4 | 9.6 | 10.8 | 10.3 | 10.2 | 9.0 | 9.8 | 10.8 | 11.3 | 12.1 | 9.8 | 125.5 |
| Average rainy days (≥ 0.2 mm) | 3.3 | 3.6 | 5.2 | 9.9 | 10.3 | 10.2 | 9.0 | 9.8 | 10.8 | 11.2 | 9.3 | 3.7 | 96.2 |
| Average snowy days (≥ 0.2 cm) | 9.8 | 6.4 | 5.3 | 1.4 | 0.1 | 0.0 | 0.0 | 0.0 | 0.0 | 0.6 | 4.0 | 6.8 | 34.3 |
| Mean monthly sunshine hours | 0.0 | 85.6 | 0.0 | 0.0 | 240.9 | 240.2 | 255.9 | 197.0 | 0.0 | 130.0 | 71.8 | 19.4 | 1,240.8 |
| Percent possible sunshine | 0.0 | 18.3 | 0.0 | 0.0 | 26.0 | 29.0 | 28.0 | 31.0 | 0.0 | 28.0 | 18.8 | 7.0 | 15.5 |
| Source: Environment Canada[3] | |||||||||||||
See also
References
- 1 2 "Caledon". Geographical Names Data Base. Natural Resources Canada. Retrieved 2012-06-11.
- ↑ "Map of the County of Peel". 1880 Map of Ontario Counties - The Canadian County Atlas Digital Project. McGill University. Retrieved 2012-06-11.
- ↑ "Albion Field Centre". 1981-2010 Canadian Climate Normals. Environment Canada. Retrieved 2016-05-12.
This article is issued from
Wikipedia.
The text is licensed under Creative Commons - Attribution - Sharealike.
Additional terms may apply for the media files.