Alberta municipal censuses, 2012
|
| ||
| ||
|
| ||
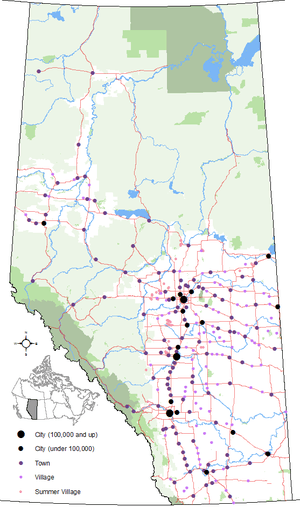 Distribution of Alberta's 269 urban municipalities as of August 31, 2013 | ||
Alberta has provincial legislation allowing its municipalities to conduct municipal censuses between April 1 and June 30 inclusive.[1][2] Municipalities choose to conduct their own censuses for multiple reasons such as to better inform municipal service planning and provision, to capitalize on per capita based grant funding from higher levels of government, or to simply update their populations since the last federal census.[3]
Alberta had 359 municipalities between April 1 and June 30, 2012,[lower-alpha 1] up from 358 during the same three-month period in 2011.[lower-alpha 2] At least 58 of these municipalities (16.2%) conducted a municipal census in 2012. Alberta Municipal Affairs recognized those conducted by 55 of these municipalities.[6] By municipal status, it recognized those conducted by 8 of Alberta's 17 cities, 23 of 108 towns, 8 of 95 villages, 4 of 51 summer villages, 1 of 5 specialized municipalities, 3 of 64 municipal districts and all 8 Metis settlements.[6][lower-alpha 3] In addition to those recognized by Municipal Affairs, censuses were conducted by the City of St. Albert, the Village of Beiseker and Strathcona County (a specialized municipality).
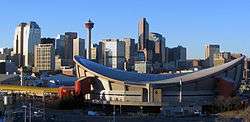
Some municipalities achieved population milestones as a result of their 2011 censuses. Calgary surpassed 1.1 million while the cities of Leduc and Fort Saskatchewan surpassed the 25,000 and the 20,000 marks respectively. Chestermere, Alberta's fourth-largest town, surpassed 15,000 residents.
Municipal census results
The following summarizes the results of the numerous municipal censuses conducted in 2012.
| 2012 municipal census summary | 2011 federal census comparison | Previous municipal census comparison | |||||||||
|---|---|---|---|---|---|---|---|---|---|---|---|
| Municipality | Status[6] | Census date[6] |
2012 pop.[6] |
2011 pop.[7] |
Absolute growth |
Absolute change |
Annual growth rate |
Prev. pop. [8][9][10][11][12][13][14] |
Prev. census year [8][9][10][11][12][13][14] |
Absolute growth |
Annual growth rate |
| Airdrie | City | April 1, 2012 | 45,711 | 42,564 | 3,147 | 7.4% | 7.4% | 43,155 | 2011 | 2,556 | 5.9% |
| Beaumont | Town | May 1, 2012 | 13,977 | 13,284 | 693 | 5.2% | 5.2% | 13,287 | 2011 | 690 | 5.2% |
| Beiseker | Village | 780[15] | 785 | −5 | −0.6% | −0.6% | 837 | 2008 | −57 | −1.7% | |
| Blackfalds | Town | May 18, 2012 | 6,767 | 6,300 | 467 | 7.4% | 7.4% | 6,399 | 2011 | 368 | 5.8% |
| Bonnyville | Town | May 3, 2012 | 6,837 | 6,216 | 621 | 10% | 10.0% | 6,470 | 2009 | 367 | 1.9% |
| Breton | Village | May 15, 2012 | 581 | 496 | 85 | 17.1% | 17.1% | 579 | 2007 | 2 | 0.1% |
| Bruderheim | Town | April 1, 2012 | 1,298 | 1,155 | 143 | 12.4% | 12.4% | 1,203 | 1990 | 95 | 0.3% |
| Buffalo Lake | Metis settlement | June 4, 2012 | 701 | 492 | 209 | 42.5% | 42.5% | 1,206 | 2009 | −505 | −16.5% |
| Calgary | City | April 1, 2012 | 1,120,225 | 1,096,833 | 23,392 | 2.1% | 2.1% | 1,090,936 | 2011 | 29,289 | 2.7% |
| Chestermere | Town | May 12, 2012 | 15,352 | 14,824 | 528 | 3.6% | 3.6% | 14,682 | 2011 | 670 | 4.6% |
| Clear Hills County | Municipal district | May 22, 2012 | 2,829 | 2,801 | 28 | 1% | 1.0% | 2,970 | 2008 | −141 | −1.2% |
| Coalhurst | Town | May 22, 2012 | 2,269 | 1,963 | 306 | 15.6% | 15.6% | 1,953 | 2010 | 316 | 7.8% |
| Cold Lake | City | April 15, 2012 | 14,400 | 13,839 | 561 | 4.1% | 4.1% | 13,924 | 2009 | 476 | 1.1% |
| Consort | Village | May 15, 2012 | 722 | 689 | 33 | 4.8% | 4.8% | 696 | 2000 | 26 | 0.3% |
| East Prairie | Metis settlement | June 4, 2012 | 345 | 366 | −21 | −5.7% | −5.7% | 906 | 2009 | −561 | −27.5% |
| Edgerton | Village | May 1, 2012 | 401 | 317 | 84 | 26.5% | 26.5% | 393 | 2007 | 8 | 0.4% |
| Edmonton | City | April 1, 2012 | 817,498 | 812,201 | 5,297 | 0.7% | 0.7% | 782,439 | 2009 | 35,059 | 1.5% |
| Edson | Town | May 31, 2012 | 8,646 | 8,475 | 171 | 2% | 2.0% | 8,365 | 2005 | 281 | 0.5% |
| Elizabeth | Metis settlement | June 4, 2012 | 671 | 654 | 17 | 2.6% | 2.6% | 820 | 2009 | −149 | −6.5% |
| Elk Point | Town | April 18, 2012 | 1,571 | 1,412 | 159 | 11.3% | 11.3% | 1,512 | 2007 | 59 | 0.8% |
| Fishing Lake | Metis settlement | June 4, 2012 | 425 | 436 | −11 | −2.5% | −2.5% | 952 | 2009 | −527 | −23.6% |
| Fort Saskatchewan | City | April 30, 2012 | 20,475 | 19,051 | 1,424 | 7.5% | 7.5% | 18,653 | 2010 | 1,822 | 4.8% |
| Gift Lake | Metis settlement | June 4, 2012 | 791 | 662 | 129 | 19.5% | 19.5% | 1,115 | 2010 | −324 | −15.8% |
| Hughenden | Village | May 5, 2012 | 258 | 230 | 28 | 12.2% | 12.2% | 266 | 2008 | −8 | −0.8% |
| Innisfail | Town | May 1, 2012 | 7,922 | 7,876 | 46 | 0.6% | 0.6% | 7,883 | 2009 | 39 | 0.2% |
| Kapasiwin | Summer village | June 19, 2012 | 14 | 10 | 4 | 40% | 40.0% | 14 | 2011 | 0 | 0.0% |
| Kikino | Metis settlement | June 4, 2012 | 810 | 964 | −154 | −16% | −16.0% | 1,113 | 2009 | −303 | −10.1% |
| Leduc | City | April 30, 2012 | 25,482 | 24,279 | 1,203 | 5% | 5.0% | 24,139 | 2011 | 1,343 | 5.6% |
| Lethbridge | City | April 1, 2012 | 89,074 | 83,517 | 5,557 | 6.7% | 6.7% | 87,882 | 2011 | 1,192 | 1.4% |
| Medicine Hat | City | June 1, 2012 | 61,180 | 60,005 | 1,175 | 2% | 2.0% | 61,097 | 2009 | 83 | 0.0% |
| Okotoks | Town | May 24, 2012 | 24,962 | 24,511 | 451 | 1.8% | 1.8% | 23,981 | 2011 | 981 | 4.1% |
| Oyen | Town | June 8, 2012 | 1,070 | 973 | 97 | 10% | 10.0% | 1,190 | 2009 | −120 | −3.5% |
| Paddle Prairie | Metis settlement | June 4, 2012 | 464 | 562 | −98 | −17.4% | −17.4% | 1,089 | 2009 | −625 | −24.8% |
| Peavine | Metis settlement | June 4, 2012 | 651 | 690 | −39 | −5.7% | −5.7% | 905 | 2009 | −254 | −10.4% |
| Penhold | Town | June 1, 2012 | 2,476 | 2,375 | 101 | 4.3% | 4.3% | 2,322 | 2010 | 154 | 3.3% |
| Raymond | Town | May 15, 2012 | 3,891 | 3,743 | 148 | 4% | 4.0% | 3,864 | 2011 | 27 | 0.7% |
| Redwater | Town | May 16, 2012 | 2,116 | 1,915 | 201 | 10.5% | 10.5% | 2,120 | 2000 | −4 | 0.0% |
| Rocky Mountain House | Town | June 19, 2012 | 7,300 | 6,933 | 367 | 5.3% | 5.3% | 7,231 | 2007 | 69 | 0.2% |
| Rosemary | Village | May 14, 2012 | 421 | 342 | 79 | 23.1% | 23.1% | 311 | 1981 | 110 | 1.0% |
| Silver Sands | Summer village | May 1, 2012 | 154 | 85 | 69 | 81.2% | 81.2% | 72 | 1982 | 82 | 2.6% |
| South View | Summer village | May 1, 2012 | 76 | 35 | 41 | 117.1% | 117.1% | 33 | 1981 | 43 | 2.7% |
| Spring Lake | Village | May 1, 2012 | 614 | 533 | 81 | 15.2% | 15.2% | 592 | 2007 | 22 | 0.7% |
| St. Albert | City | April 2, 2012[16] | 60,994[16] | 61,466 | −472 | −0.8% | −0.8% | 60,138 | 2010 | 856 | 0.7% |
| St. Paul | Town | May 15, 2012 | 5,844 | 5,400 | 444 | 8.2% | 8.2% | 5,632 | 2010 | 212 | 1.9% |
| County of St. Paul No. 19 | Municipal district | April 1, 2012 | 6,168 | 5,831 | 337 | 5.8% | 5.8% | 6,352 | 1984 | −184 | −0.1% |
| Strathcona County | Specialized municipality | May 1, 2012[17] | 92,403[17] | 92,490 | −87 | −0.1% | −0.1% | 87,998 | 2009 | 4,405 | 1.6% |
| Strathmore | Town | April 1, 2012 | 12,352 | 12,305 | 47 | 0.4% | 0.4% | 12,139 | 2010 | 213 | 0.9% |
| Sundre | Town | June 7, 2012 | 2,695 | 2,610 | 85 | 3.3% | 3.3% | 2,190 | 1999 | 505 | 1.6% |
| Thorsby | Village | April 1, 2012 | 947 | 951 | −4 | −0.4% | −0.4% | 988 | 2010 | −41 | −2.1% |
| Three Hills | Town | April 2, 2012 | 3,230 | 3,198 | 32 | 1% | 1.0% | 3,322 | 2008 | −92 | −0.7% |
| Two Hills | Town | May 7, 2012 | 1,431 | 1,379 | 52 | 3.8% | 3.8% | 1,232 | 2007 | 199 | 3.0% |
| Vegreville | Town | April 1, 2012 | 5,758 | 5,717 | 41 | 0.7% | 0.7% | 5,834 | 2009 | −76 | −0.4% |
| Vermilion | Town | April 15, 2012 | 4,545 | 3,930 | 615 | 15.6% | 15.6% | 4,472 | 2007 | 73 | 0.3% |
| Vilna | Village | June 18, 2012 | 290 | 249 | 41 | 16.5% | 16.5% | 302 | 1998 | −12 | −0.3% |
| Vulcan County | Municipal district | April 4, 2012 | 3,893 | 3,875 | 18 | 0.5% | 0.5% | 3,830 | 2007 | 63 | 0.3% |
| Wembley | Town | April 15, 2012 | 1,410 | 1,383 | 27 | 2% | 2.0% | 1,542 | 2001 | −132 | −0.8% |
| RM of Wood Buffalo | Specialized municipality | May 9, 2012 | 74,631[18] | 65,565 | 9,066 | 13.8% | 13.8% | 66,748 | 2007 | 7,883 | 2.3% |
| Yellowstone | Summer village | May 1, 2012 | 131 | 178 | −47 | −26.4% | −26.4% | 97 | 1992 | 34 | 1.5% |
Breakdowns
Urban and rural service areas
Strathcona County
| 2012 municipal census summary | 2009 municipal census comparison | |||
|---|---|---|---|---|
| Area | 2012 population [17] |
Previous population [17] |
Absolute growth |
Annual growth rate |
| Sherwood Park urban service area[lower-alpha 4] | 65,465 | 61,660 | 3,805 | 2.0% |
| Rural service area[lower-alpha 5] | 26,938 | 26,338 | 600 | 0.8% |
| Total Strathcona County | 92,403 | 87,998 | 4,405 | 1.6% |
Wood Buffalo
| 2012 municipal census summary | 2010 municipal census comparison | |||
|---|---|---|---|---|
| Area | 2012 population [18] |
Previous population [18] |
Absolute growth |
Annual growth rate |
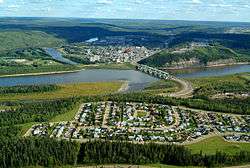
| Fort McMurray urban service area[lower-alpha 4] | 70,964[lower-alpha 6] | 74,709 | −3,745 | −2.5% |
| Rural service area[lower-alpha 5] | 3,667 | 4,216 | −549 | −6.7% |
| Total RM of Wood Buffalo | 74,631 | 78,925 | −4,294 | −2.8% |
Hamlets
The following is a list of hamlet populations determined by 2012 municipal censuses conducted by Strathcona County and the Regional Municipality (RM) of Wood Buffalo excluding the urban service areas of Fort McMurray and Sherwood Park that are presented above.
| 2012 municipal census summary | Previous census comparison | |||||
|---|---|---|---|---|---|---|
| Hamlet | Municipality | 2012 population [17][18] |
Previous population [17][18] |
Previous census year [17][18] |
Absolute growth |
Annual growth rate |
| Antler Lake | Strathcona County | 353 | 337 | 2009 | 16 | 1.6% |
| Anzac | RM of Wood Buffalo | 714 | 785 | 2010 | −71 | −4.6% |
| Ardrossan | Strathcona County | 514 | 434 | 2009 | 80 | 5.8% |
| Collingwood Cove | Strathcona County | 362 | 331 | 2009 | 31 | 3.0% |
| Conklin | RM of Wood Buffalo | 318 | 337 | 2010 | −19 | −2.9% |
| Fort Chipewyan | RM of Wood Buffalo | 1,008 | 1,261 | 2010 | −253 | −10.6% |
| Fort MacKay | RM of Wood Buffalo | 59 | 44 | 2010 | 15 | 15.8% |
| Gregoire Lake Estates | RM of Wood Buffalo | 275 | 248 | 2010 | 27 | 5.3% |
| Half Moon Lake | Strathcona County | 226 | 212 | 2009 | 14 | 2.2% |
| Hastings Lake | Strathcona County | 92 | 77 | 2009 | 15 | 6.1% |
| Janvier | RM of Wood Buffalo | 171 | 195 | 2010 | −24 | −6.4% |
| Josephburg | Strathcona County | 233 | 237 | 2009 | −4 | −0.6% |
| North Cooking Lake | Strathcona County | 66 | 49 | 2009 | 17 | 10.4% |
| Saprae Creek | RM of Wood Buffalo | 925 | 926 | 2010 | −1 | −0.1% |
| South Cooking Lake | Strathcona County | 294 | 293 | 2009 | 1 | 0.1% |
Shadow population counts
Alberta Municipal Affairs defines shadow population as "temporary residents of a municipality who are employed by an industrial or commercial establishment in the municipality for a minimum of 30 days within a municipal census year."[3] The RM of Wood Buffalo conducted a shadow population count in 2012. The following presents the results of this count for comparison with its concurrent municipal census results.
| Municipality | Status[18] | Municipal census population[18] |
Shadow population[18] |
Combined population[18] |
|---|---|---|---|---|
| RM of Wood Buffalo | Specialized municipality | 74,631 | 41,776 | 116,407 |
Notes
- ↑ By the end of 2013, the total amount of municipalities dropped to 358 due to the dissolution of New Norway from village status to become a hamlet under the jurisdiction of Camrose County on November 1, 2012.[4]
- ↑ Improvement District No. 349 was formed on January 1, 2012 through the separation of lands from the Regional Municipality of Wood Buffalo and Lac La Biche County.[5]
- ↑ No censuses were conducted among Alberta's 3 special areas and 8 improvement districts.[6]
- 1 2 The Fort McMurray and Sherwood Park urban service areas are deemed equivalents of cities.[19][20]
- 1 2 Strathcona County's and the RM of Wood Buffalo's rural service areas are deemed equivalents of municipal districts.[19][20]
- ↑ Fort McMurray's population is based on 95.5% enumeration. The RM of Wood Buffalo has extrapolated this population to 74,029 based on 100% enumeration.[18]
See also
References
- ↑ "Municipal Government Act: Revised Statutes of Alberta 2000 Chapter M-26 (Office Consolidation)". Alberta Queen's Printer. November 24, 2010. Retrieved June 24, 2013.
- ↑ "Municipal Government Act: Determination of Population Regulation, Alberta Regulation 63/2001 (Office Consolidation)" (PDF) (PDF). Alberta Queen's Printer. 2013. p. 3. Retrieved December 30, 2013.
- 1 2 "Municipal Census Manual: Requirements and Guidelines for Conducting a Municipal Census" (PDF) (PDF). Alberta Municipal Affairs. January 2013. p. 7. ISBN 978-1-4601-0359-3. Retrieved June 24, 2013.
- ↑ "Order in Council (O.C.) 328/2012". Province of Alberta. October 17, 2012. Retrieved December 31, 2013.
- ↑ "O.C. 419/2011". Province of Alberta. September 9, 2011. Retrieved January 1, 2014.
- 1 2 3 4 5 6 "2012 Municipal Affairs Population List" (PDF) (PDF). Alberta Municipal Affairs. November 22, 2013. ISBN 978-1-4601-0645-7. Retrieved December 25, 2013.
- ↑ "Population and dwelling counts, for Canada, provinces and territories, and census subdivisions (municipalities), 2011 and 2006 censuses (Alberta)". Statistics Canada. February 8, 2012. Retrieved February 8, 2012.
- 1 2 "2011 Municipal Affairs Population List" (PDF) (PDF). Alberta Municipal Affairs. October 5, 2011. ISBN 978-0-7785-9738-4. Retrieved December 28, 2013.
- 1 2 "2006 Official Population List" (PDF) (PDF). Alberta Municipal Affairs. February 5, 2007. ISBN 0-7785-4994-1. Retrieved December 28, 2013.
- 1 2 "2001 Official Population List" (PDF) (PDF). Alberta Municipal Affairs. September 4, 2001. Retrieved December 28, 2013.
- 1 2 "Official Population List 1996" (PDF) (PDF). Alberta Municipal Affairs. October 1, 1996. Retrieved December 28, 2013.
- 1 2 "1991 Official Population" (PDF) (PDF). Alberta Municipal Affairs. 1991. Retrieved December 28, 2013.
- 1 2 "1986 Official Population" (PDF) (PDF). Alberta Municipal Affairs. 1986. Retrieved December 28, 2013.
- 1 2 "1981 Official Population" (PDF) (PDF). Alberta Municipal Affairs. 1981. Retrieved December 28, 2013.
- ↑ Jessica Wallace (August 20, 2012). "Beiseker population declining: census". Rocky View Weekly. Great West Newspapers LP. Retrieved December 28, 2013.
- 1 2 "2012 St. Albert Census". City of St. Albert. Retrieved December 28, 2013.
- 1 2 3 4 5 6 7 "2012 Municipal Census Report" (PDF) (PDF). Strathcona County. 2012. pp. 3&ndash, 4. Retrieved December 26, 2013.
- 1 2 3 4 5 6 7 8 9 10 11 "Municipal Census 2012" (PDF) (PDF). Regional Municipality of Wood Buffalo. October 2012. pp. 22 & 24. Retrieved December 26, 2013.
- 1 2 "Order in Council 817/94" (PDF) (PDF). Province of Alberta. December 21, 1994. p. 2. Retrieved December 29, 2013.
- 1 2 "Order in Council 761/95" (PDF) (PDF). Province of Alberta. December 6, 1995. pp. 2&ndash, 3. Retrieved December 29, 2013.