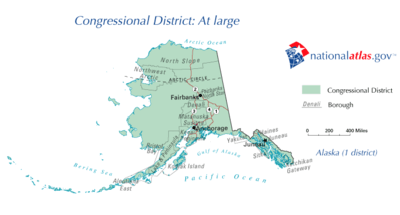
Alaska's at-large congressional district
| Alaska's At-large congressional district | |
|---|---|
 | |
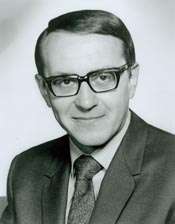
| Current Representative | Don Young (R–Fort Yukon) |
| Area | 570,641 sq mi (1,477,950 km2) |
| Distribution |
|
| Population (2016) | 741,894[1] |
| Median income | 57,431 |
| Ethnicity |
|
| Occupation |
|
| Cook PVI | R+9[2] |
Since becoming a State in 1959, Alaska has been entitled to one member in the United States House of Representatives, elected in the State's sole, at-large congressional district. Based on area, Alaska's congressional district is by far the largest congressional district in the United States (the next-largest being less than a quarter of the size of Alaska), and is one of the largest electoral districts in the world.
Since March 6, 1973, Republican Don Young has been the member for the district.
History
The district was created when Alaska achieved statehood on January 3, 1959, to elect Alaska's single member. Since then, Alaska has had a single congressional district.
Voter registration
| Voter registration as of January 5, 2018 | |||||
|---|---|---|---|---|---|
| Party | Total voters | Percentage | |||
| Unaffiliated | 287,965 | 53.93% | |||
| Republican | 141,547 | 26.51% | |||
| Democratic | 76,330 | 14.29% | |||
| Minor parties | 28,131 | 5.27% | |||
| Total | 533,973 | 100% | |||
Presidential Elections results
Election results from presidential races:
| Year | Office | Results |
|---|---|---|
| 2000 | President | George W. Bush 59 - Al Gore 28% |
| 2004 | President | George W. Bush 61 - John Kerry 36% |
| 2008 | President | John McCain 59 - Barack Obama 38% |
| 2012 | President | Mitt Romney 55 - Barack Obama 41% |
| 2016 | President | Donald Trump 51 - Hillary Clinton 37% |
List of representatives
| Representative | Party | Term | Notes | |
|---|---|---|---|---|
| District created January 3, 1959 | ||||
 | Democratic | January 3, 1959 – December 30, 1966 | Lost re-election, then resigned | |
| Vacant | December 30, 1966 – January 3, 1967 | |||
 | Republican | January 3, 1967 – January 3, 1971 | Retired | |
 | Democratic | January 3, 1971 – December 29, 1972 | Went missing October 16, 1972
Declared dead December 29, 1972 | |
| Vacant | December 29, 1972 – March 6, 1973 | |||
 | Republican | March 6, 1973 – present | Incumbent | |
Election results
This district is normally considered safely Republican because no Democrat has been elected since 1972 and because incumbent Don Young has rarely faced a serious challenge since 1992 when he beat Mayor John Devens (D-Valdez) by 4%. Although allegations of corruption against Young led Democrats to target this seat in 2008, Young retained his seat.
1958 to 2004
| Year | Republican | Democratic | Green | Libertarian | Others | Write-in[3] | ||||||||||||||||||
|---|---|---|---|---|---|---|---|---|---|---|---|---|---|---|---|---|---|---|---|---|---|---|---|---|
| Candidate | Votes | Pct | Candidate | Votes | Pct | Candidate | Votes | Pct | Candidate | Votes | Pct | Candidate | Votes | Pct | Votes | Pct | ||||||||
| 1958 | Henry A. Benson | 20,699 | 42.5% | Ralph Rivers | 27,948 | 57.5% | ||||||||||||||||||
| 1960 | R. L. Rettig | 25,517 | 43.2% | Ralph Rivers (inc.) | 33,546 | 56.8% | ||||||||||||||||||
| 1962 | Lowell Thomas, Jr. | 26,638 | 44% | Ralph Rivers (inc.) | 33,953 | 56% | ||||||||||||||||||
| 1964 | Lowell Thomas, Jr. | 32,556 | 48.5% | Ralph Rivers (inc.) | 34,590 | 51.5% | ||||||||||||||||||
| 1966 | Howard W. Pollock | 34,040 | 51.6% | Ralph Rivers (inc.) | 31,867 | 48.4% | ||||||||||||||||||
| 1968 | Howard W. Pollock (inc.) | 43,577 | 54.2% | Nick Begich | 36,785 | 45.8% | ||||||||||||||||||
| 1970 | Frank Murkowski | 35,947 | 44.9% | Nick Begich | 44,137 | 55.1% | ||||||||||||||||||
| 1972 | Don Young | 41,750 | 43.8% | Nick Begich (inc.) | 53,651 | 56.2% | ||||||||||||||||||
| 1973 | Don Young | 35,044 | 51.4% | Emil Notti | 33,123 | 48.6% | ||||||||||||||||||
| 1974 | Don Young (inc.) | 51,641 | 53.8% | William L. Hensley | 44,280 | 46.2% | ||||||||||||||||||
| 1976 | Don Young (inc.) | 83,722 | 70.8% | Eben Hopson | 34,194 | 28.9% | 292 | 0.2% | ||||||||||||||||
| 1978 | Don Young (inc.) | 68,811 | 55.4% | Patrick Rodey | 55,176 | 44.4% | 200 | 0.2% | ||||||||||||||||
| 1980 | Don Young (inc.) | 114,089 | 73.8% | Kevin Parnell | 39,922 | 25.8% | 607 | 0.4% | ||||||||||||||||
| 1982 | Don Young (inc.) | 128,274 | 70.8% | Dave Carlson | 52,011 | 28.7% | 799 | 0.4% | ||||||||||||||||
| 1984 | Don Young (inc.) | 113,582 | 55% | Pegge Begich | 86,052 | 41.7% | Betty Breck (I) | 6,508 | 3.2% | 295 | 0.1% | |||||||||||||
| 1986 | Don Young (inc.) | 101,799 | 56.5% | Pegge Begich | 74,053 | 41.1% | Betty Breck | 4,182 | 2.3% | 243 | 0.1% | |||||||||||||
| 1988 | Don Young (inc.) | 120,595 | 62.5% | Peter Gruenstein | 71,881 | 37.3% | 479 | 0.2% | ||||||||||||||||
| 1990 | Don Young (inc.) | 99,003 | 51.7% | John S. Devens | 91,677 | 47.8% | 967 | 0.5% | ||||||||||||||||
| 1992 | Don Young (inc.) | 111,849 | 46.8% | John S. Devens | 102,378 | 42.8% | Mike Milligan | 9,529 | 4% | Michael States (AI) | 15,049 | 6.3% | 311 | 0.1% | ||||||||||
| 1994 | Don Young (inc.) | 118,537 | 56.9% | Tony Smith | 68,172 | 32.7% | Joni Whitmore | 21,277 | 10.2% | 254 | 0.1% | |||||||||||||
| 1996 | Don Young (inc.) | 138,834 | 59.4% | Georgianna Lincoln | 85,114 | 36.4% | John J. G. Grames | 4,513 | 1.9% | William J. Nemec II (AI) | 5,017 | 2.1% | 222 | 0.1% | ||||||||||
| 1998 | Don Young (inc.) | 139,676 | 62.6% | Jim Duncan | 77,232 | 34.6% | John J. G. Grames | 5,923 | 2.7% | 469 | 0.2% | |||||||||||||
| 2000 | Don Young (inc.) | 190,862 | 69.6% | Clifford Mark Greene | 45,372 | 16.5% | Anna C. Young | 22,440 | 8.2% | Leonard J. Karpinski | 4,802 | 1.8% | Jim Dore (AI) | 10,085 | 3.7% | 832 | 0.3% | |||||||
| 2002 | Don Young (inc.) | 169,685 | 74.5% | Clifford Mark Greene | 39,357 | 17.3% | Russell deForest | 14,435 | 6.3% | Rob Clift | 3,797 | 1.7% | 291 | 0.1% | ||||||||||
| 2004 | Don Young (inc.) | 213,216 | 71.1% | Thomas M. Higgins | 67,074 | 22.4% | Timothy A. Feller | 11,434 | 3.8% | Alvin A. Anders | 7,157 | 2.4% | 1,115 | 0.4% | ||||||||||
| Year | Republican | Democratic | Green | Libertarian | Others | Write-in | ||||||||||||||||||
Source: "Election Statistics". Office of the Clerk of the House of Representatives. Archived from the original on 30 July 2008. Retrieved August 8, 2008.
2006 election
| Party | Candidate | Votes | % | ± | |
|---|---|---|---|---|---|
| Republican | Don Young (inc.) | 132,743 | 56.57% | -14.50% | |
| Democratic | Diane Benson | 93,879 | 40.01% | +17.65% | |
| Libertarian | Alexander Crawford | 4,029 | 1.72% | -0.67% | |
| Green | Eva Ince | 1,819 | 0.78% | -3.03% | |
| Independent | William Ratigan | 1,615 | 0.69% | ||
| Independent | Write-In Votes | 560 | 0.24% | -.13% | |
| Republican hold | Swing | ||||
| Turnout | 234,645 | ||||
2008 election
| Party | Candidate | Votes | % | ± | |
|---|---|---|---|---|---|
| Republican | Don Young (inc.) | 158,939 | 50.14 | -6.43 | |
| Democratic | Ethan Berkowitz | 142,560 | 44.98 | +4.97 | |
| Independent | Don Wright | 14,274 | 4.50 | +4.50 | |
| Independent | Write-In Votes | 1,205 | 0.38 | +0.14 | |
| Republican hold | Swing | ||||
| Turnout | 316,978 | ||||
2010 election
| Party | Candidate | Votes | % | ± | |
|---|---|---|---|---|---|
| Republican | Don Young (inc.) | 175,384 | 68.96 | +18.82 | |
| Democratic | Harry Crawford | 77,606 | 30.51 | -14.47 | |
| Independent | Write-In Votes | 1,345 | 0.53 | +0.15 | |
| Republican hold | Swing | ||||
| Turnout | 254,335 | ||||
2012 election
| Party | Candidate | Votes | % | ± | |
|---|---|---|---|---|---|
| Republican | Don Young (inc.) | 185,296 | 63.94 | -5.02 | |
| Democratic | Sharon Cissna | 82,927 | 28.62 | -1.89 | |
| Libertarian | Jim McDermott | 15,028 | 5.19 | +5.19 | |
| Independent | Ted Gianoutsos | 5,589 | 1.93 | +1.93 | |
| Independent | Write-In Votes | 964 | 0.33 | -0.20 | |
| Republican hold | Swing | ||||
| Turnout | 289,804 | ||||
2014 election
| Party | Candidate | Votes | % | ± | |
|---|---|---|---|---|---|
| Republican | Don Young (inc.) | 142,260 | 50.95 | -12.99 | |
| Democratic | Forrest Dunbar | 114,317 | 40.94 | +12.32 | |
| Libertarian | Jim McDermott | 21,373 | 7.65 | +2.46 | |
| Independent | Write-In Votes | 1,269 | 0.45 | +0.12 | |
| Republican hold | Swing | ||||
| Turnout | 279,219 | ||||
2016 election
| Party | Candidate | Votes | % | ± | |
|---|---|---|---|---|---|
| Republican | Don Young (inc.) | 155,088 | 50.32 | -0.63 | |
| Democratic | Steve Lindbeck | 111,019 | 36.02 | -4.92 | |
| Libertarian | Jim McDermott | 31,770 | 10.31 | +2.66 | |
| Independent | Bernie Souphanavong | 9,093 | 2.95 | +2.95 | |
| Independent | Write-In Votes | 1,228 | 0.40 | -0.05 | |
| Republican hold | Swing | ||||
| Turnout | 308,198 | ||||
Living former members
Since the death of Howard Wallace Pollock on January 9, 2011, there have been no living former members of the U.S. House of Representatives from Alaska's at-large congressional district. The most recently serving Representative to die was Nick Begich, who disappeared in a plane crash on October 16, 1972, while serving in office.
References
- ↑
- ↑ "Partisan Voting Index – Districts of the 115th Congress" (PDF). The Cook Political Report. April 7, 2017. Retrieved April 7, 2017.
- ↑ Prior to the 1976 election, official election returns released by the State of Alaska were typewritten rather than computer generated, and write-in votes were not included in published vote totals
- Martis, Kenneth C. (1989). The Historical Atlas of Political Parties in the United States Congress. New York: Macmillan Publishing Company.
- Martis, Kenneth C. (1982). The Historical Atlas of United States Congressional Districts. New York: Macmillan Publishing Company.
- Congressional Biographical Directory of the United States 1774–present
Juneau (capital) | ||
| Topics |  | |
| Society | ||
| Regions | ||
| Largest cities pop. over 25,000 | ||
| Smaller cities pop. over 2,000 | ||
| Boroughs | ||
| Census Areas | ||