2016–17 South Pacific cyclone season
| 2016–17 South Pacific cyclone season | |
|---|---|
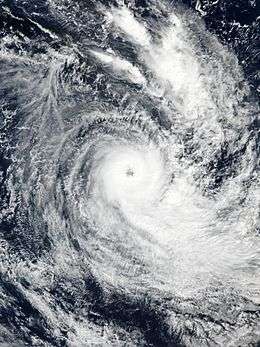
 Season summary map | |
| Seasonal boundaries | |
| First system formed | November 12, 2016 |
| Last system dissipated | May 14, 2017 |
| Strongest storm | |
| Name | Donna |
| • Maximum winds |
205 km/h (125 mph) (10-minute sustained) |
| • Lowest pressure | 935 hPa (mbar) |
| Seasonal statistics | |
| Total disturbances | 22 |
| Total depressions | 12 |
| Tropical cyclones | 4 |
| Severe tropical cyclones | 2 |
| Total fatalities | 3 total |
| Total damage | ≥ $5 million (2016 USD) |
| Related articles | |
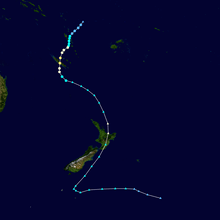
The 2016–17 South Pacific cyclone season was the least active South Pacific cyclone season since the 2011–12 season, with only four tropical cyclones occurring within the South Pacific Ocean to the east of 160°E. Two of the four systems developed into severe tropical cyclones on the Australian tropical cyclone intensity scale. The season officially ran from November 1, 2016 until April 30, 2017. However, May featured two post-season systems: Donna and Ella, of which the former was the strongest post-season South Pacific tropical cyclone ever recorded in that month. Overall, 22 tropical disturbances were monitored by a combination of the Fiji Meteorological Service (FMS), Australian Bureau of Meteorology (BoM) and New Zealand's MetService.
Official advisories regarding tropical cyclones in this basin were issued by the FMS through the Regional Specialized Meteorological Center (RSMC) in Nadi, the BoM through the Tropical Cyclone Warning Center (TCWC) in Brisbane and MetService through the TCWC in Wellington. The United States Armed Forces through the Joint Typhoon Warning Center (JTWC) also monitored the basin and issued unofficial warnings for American interests. RSMC Nadi attached a number and an F suffix to tropical disturbances that formed in or moved into the basin while the JTWC designated significant tropical cyclones with a number and a P suffix. RSMC Nadi, TCWC Wellington and TCWC Brisbane all used the Australian Tropical Cyclone Intensity Scale and estimated sustained windspeeds over a period of ten minutes, while the JTWC estimated sustained windspeeds over a 1-minute period, which were subsequently compared to the Saffir–Simpson scale (SSHWS).
Seasonal forecasts
| Source/Record | Tropical Cyclone |
Severe Tropical Cyclone |
Ref |
|---|---|---|---|
| Record high: | 1997–98: 16 | 1982–83:10 | [1] |
| Record low: | 2011–12: 3 | 2008–09: 0 | [1] |
| Average (1969-70 - 2015-16): | 7.3 | — | [2] |
| NIWA October | 8-10 | >5 | [3] |
| Fiji Meteorological Service | 5-7 | 3-5 | [2] |
| NIWA February | 6 | 2 | [4] |
| Region | Chance of above average |
Average number |
Actual activity |
| Western South Pacific | 65% | 7 | 1 |
| Eastern South Pacific | 52% | 10 | 4 |
| Source:BOM's South Pacific Tropical Cyclone Season Outlook.[5] | |||
Ahead of the cyclone season, the Fiji Meteorological Service (FMS), Australian Bureau of Meteorology (BoM), New Zealand's MetService and National Institute of Water and Atmospheric Research (NIWA) and various other Pacific Meteorological services, all contributed towards the Island Climate Update tropical cyclone outlook that was released during October 2016.[3] The outlook took into account the ENSO neutral conditions that had been observed across the Pacific and analogue seasons that had ENSO neutral and weak La Nina conditions occurring during the season.[3] The outlook called for a near average number of tropical cyclones for the 2016–17 season, with eight to ten named tropical cyclones, to occur between 135°E and 120°W compared to an average of 10.4.[3] At least five of the tropical cyclones were expected to become Category 3 severe tropical cyclones, while four could become Category 4 severe tropical cyclones; they also noted that a Category 5 severe tropical cyclone was unlikely to occur.[3] In addition to contributing towards the Island Climate Update outlook, the FMS and the BoM issued their own seasonal forecasts for the South Pacific region.[2][5]
The BoM issued two seasonal forecasts for the Southern Pacific Ocean, for their self-defined eastern and western regions of the South Pacific Ocean.[5] They predicted that the Western region between 142.5°E and 165°E, had a 65% chance of seeing activity above its average of 7 tropical cyclones. The BoM also predicted that the Eastern Region between 165°E and 120°W, had a 52% chance of seeing activity above its average of 10 tropical cyclones.[5] Within their outlook the FMS predicted that between five and six tropical cyclones, would occur within the basin compared to an average of around 7.3 cyclones.[2] At least three of the tropical cyclones were expected to become Category 3 severe tropical cyclones, while one or two were predicted to peak as a Category 4 or 5 severe tropical cyclone.[2] They also reported that the tropical cyclone genesis trough was expected to be located, within the Coral Sea to the west of the International Dateline.[2] This was based on the expected and predicted ENSO conditions, and the existence of the Pacific warm pool of sub-surface temperature anomalies in this region.[2]
Both the Island Climate Update and the FMS tropical cyclone outlooks assessed the risk of a tropical cyclone affecting a certain island or territory.[2][3] As the tropical cyclone genesis trough of low pressure was expected to be located to the west of the International Dateline, normal or slightly above normal activity was expected for areas near the dateline.[2][3] The Island Climate Update Outlook predicted that Fiji, New Zealand, Samoa, Tokelau, Tuvalu, Vanuatu, Wallis and Futuna, the Solomon and Cook Islands had a normal risk of being impacted by a tropical cyclone or ex tropical cyclone.[3] They also predicted that Tonga, Papua New Guinea and Niue had an elevated chance of being impacted, while it was thought unlikely that French Polynesia, Kiribati and the Pitcairn Islands would be affected by a tropical cyclone.[3] The FMS's outlook predicted that Fiji and Tonga had an elevated risk, while Tuvalu, French Polynesia and Kiribati, were thought to have a low to reduced chance of being affected by a tropical cyclone.[2] The outlook also predicted that New Caledonia, Niue, Samoa, Solomon Islands, Tokelau, Vanuatu, Wallis & Futuna were thought to have a normal chance of being affected by a tropical cyclone.[2] It was thought that there was an elevated risk of the Solomon Islands being impacted by at least one severe tropical cyclone, while other areas such as Fiji, New Caledonia, Niue, Samoa, French Polynesia and Tuvalu, had a normal to reduced chance of being impacted by a severe tropical cyclone.[2]
An updated tropical cyclone outlook was issued by the Island Climate Update during February 2017, as the predicted La Nina conditions had not materialised and the season had produced no tropical cyclones.[4] The outlook reported that around six tropical cyclones were now expected to occur, within the South Pacific between February and the end of the season in April.[4] As a result, the season overall was now expected to below average, however, many islands were still expected to have a near normal risk of a tropical cyclone impacting them.[4]
Seasonal summary
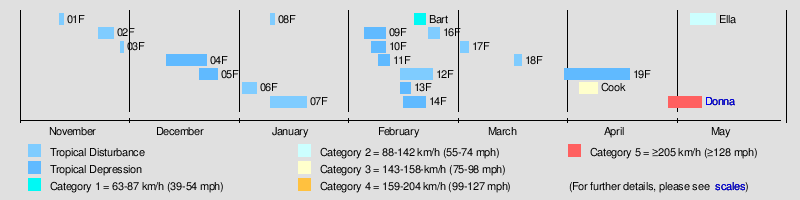
After a near average but destructive tropical cyclone season during the previous year, the first tropical disturbance of the season developed to the north-northeast of Niue during November 12.[4] However, over the next few months, no named tropical cyclones developed. This was attributed to a number of factors, including a poorly organised South Pacific Convergence Zone and a predicted La Nina episode not developing.[4] Four months after the beginning of the season, the first named storm, Bart, developed on February 21, making it one of the latest forming named tropical cyclones within the basin. No more cyclones were named for nearly two months after this, until the system that became Severe Tropical Cyclone Cook formed. The most active period of the season in terms of cyclone formation actually occurred outside the official bounds of the season, with both Severe Tropical Cyclone Donna and Tropical Cyclone Ella being named in May.
Systems
Tropical Depression 04F
| Tropical depression (Australian scale) | |
  | |
| Duration | December 12 – December 21 |
|---|---|
| Peak intensity | 45 km/h (30 mph) (10-min) 998 hPa (mbar) |
During December 12, the FMS reported that Tropical Disturbance 04F had developed about 105 km (65 mi) to the northeast of Rotuma, Fiji.[6]
Tropical Depression 05F
| Tropical depression (Australian scale) | |
  | |
| Duration | December 21 – December 26 |
|---|---|
| Peak intensity | Winds not specified 1005 hPa (mbar) |
A tropical disturbance formed east of island Fiji.It had developed into the tropical depression during 22 December. It moved westwards and dissipated 26 December.
Tropical Depression 09F
| Tropical depression (Australian scale) | |
  | |
| Duration | February 5 – February 11 |
|---|---|
| Peak intensity | Winds not specified 999 hPa (mbar) |
Tropical Depression 10F
| Tropical depression (Australian scale) | |
  | |
| Duration | February 7 – February 11 |
|---|---|
| Peak intensity | Winds not specified 993 hPa (mbar) |
Tropical Depression 11F
| Tropical depression (Australian scale) | |
  | |
| Duration | February 9 – February 12 |
|---|---|
| Peak intensity | Winds not specified 1002 hPa (mbar) |
Tropical Depression 13F
| Tropical depression (Australian scale) | |
  | |
| Duration | February 15 – February 18 |
|---|---|
| Peak intensity | Winds not specified 998 hPa (mbar) |
Tropical Depression 14F
| Tropical depression (Australian scale) | |
| Tropical storm (SSHWS) | |
  | |
| Duration | February 16 – February 22 |
|---|---|
| Peak intensity | 55 km/h (35 mph) (10-min) 997 hPa (mbar) |
Tropical Cyclone Bart
| Category 1 tropical cyclone (Australian scale) | |
| Tropical storm (SSHWS) | |
  | |
| Duration | February 19 – February 22 |
|---|---|
| Peak intensity | 75 km/h (45 mph) (10-min) 994 hPa (mbar) |
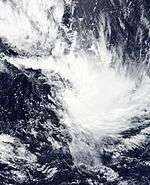
During February 19, the FMS reported that Tropical Disturbance 15F had developed, about 300 km (185 mi) to the southwest of Apia, Samoa.[7] Over the next couple of days, the system gradually developed further and became a tropical depression, as it moved south-eastwards within an area of low vertical wind shear.[8] During February 21, the JTWC initiated advisories and designated it as Tropical Cyclone 07P, after an ASCAT satellite image had revealed the presence of 65–75 km/h (40–45 mph) winds, within its partially exposed circulation.[9] The FMS subsequently named the system Bart as it had become a Category 1 tropical cyclone on the Australian scale, with peak 10-minute sustained wind speeds of 75 km/h (45 mph).[10][11] After it had been named, Bart continued to move south-eastwards and passed to the west of the Southern Cook Islands, before it entered MetService's area of responsibility early on February 22.[11][12] During that day, the system gradually transitioned and was reclassified as an extratropical cyclone, before it continued to weaken and dissipated over open seas.[11] Gale-force winds, rain and thunderstorms were observed over the Southern Cook Islands, but there was no significant impact reported.[12]
Tropical Depression 19F
| Tropical depression (Australian scale) | |
| Tropical storm (SSHWS) | |
  | |
| Duration | April 1 – April 19 |
|---|---|
| Peak intensity | 65 km/h (40 mph) (1-min) 988 hPa (mbar) |
Tropical Disturbance 19F was first noted on April 1, while it was located about 240 km (150 mi) to the northeast of Pago-Pago, in American Samoa.[13] The system was poorly organised at this stage and lied within an upper-level monsoonal trough of low pressure in a moderate area of vertical wind shear.[13]
Severe Tropical Cyclone Cook
| Category 3 severe tropical cyclone (Australian scale) | |
| Category 2 tropical cyclone (SSHWS) | |
  | |
| Duration | April 5 – April 12 |
|---|---|
| Peak intensity | 155 km/h (100 mph) (10-min) 961 hPa (mbar) |
Tropical Disturbance 20F was first noted during April 5, while it was located about 200 km (125 mi) to the northwest of the Fijian dependency of Rotuma.[14] Over the next couple of days, the disturbance moved south-westwards and gradually developed further, before it was classified as a tropical depression by the FMS during April 7. The system subsequently continued to move south-westwards and passed near to or over the islands of Maewo, Ambae and Malakula in northern Vanuatu. As the system impacted Vanuatu, the JTWC and the FMS reported that the system had developed into a tropical cyclone, with the latter naming it as Cook.[12][15] After Cook was named, the cyclone steadily intensified further and developed a 30 km (20 mi) eye, as it moved south-westwards towards New Caledonia.[16] The FMS subsequently reported during April 9, that the system had become a Category 3 severe tropical cyclone, with peak 10-minute sustained winds of 155 km/h (100 mph).[17] The JTWC subsequently reported that the cyclone had peaked with 1-minute sustained wind speeds of 165 km/h (105 mph), which made it equivalent to a Category 2 hurricane. Cook subsequently passed over New Caledonia during April 10, before it started to move southwards towards New Zealand and transition into an extratropical cyclone as it moved southwards towards New Zealand. The system was subsequently declared extratropical by both MetService and the JTWC during April 11, before it made landfall on New Zealand's North Island during April 13.[18] After making landfall, the system moved south-southwest and moved to the east of the South Island during the following day before they were last noted during April 17.[11]
Severe Tropical Cyclone Donna
| Category 5 severe tropical cyclone (Australian scale) | |
| Category 4 tropical cyclone (SSHWS) | |
  | |
| Duration | May 1 – May 10 |
|---|---|
| Peak intensity | 205 km/h (125 mph) (10-min) 935 hPa (mbar) |
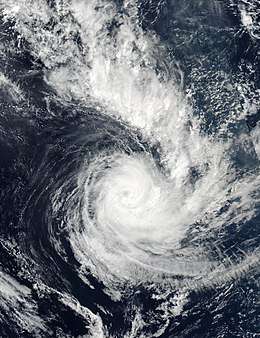
Cyclone Donna was the strongest off-season South Pacific tropical cyclone on record during the month of May.[19] Donna formed from an area of disturbed weather that was first monitored west-northwest of Fiji on 1 May 2017. The disturbance drifted eastward amid an increasingly favorable environment, and it was designated Tropical Depression 21F late on 2 May. Twelve hours later, it intensified into a Category 1 on the Australian tropical cyclone scale and was designated Tropical Cyclone Donna as the storm's motion shifted west and then south. After reaching its initial peak as a Category 4 cyclone early on 6 May, the effects of wind shear and upwelling caused the storm to weaken. However, it reintensified into a Category 5 cyclone on 8 May. Soon after, Donna entered a region of strong westerly flow and began to rapidly weaken. Continuing to accelerate in a southerly direction, Donna eventually weakened into a tropical low on 10 May. By 16 May, Donna's remnants had fully dissipated.
Tropical Cyclone Ella
| Category 2 tropical cyclone (Australian scale) | |
| Category 1 tropical cyclone (SSHWS) | |
  | |
| Duration | May 7 – May 14 |
|---|---|
| Peak intensity | 110 km/h (70 mph) (10-min) 977 hPa (mbar) |
During May 7, the FMS started to monitor Tropical Disturbance 22F that had developed within a trough of low pressure about 470 km (290 mi) to the northeast of Suva, Fiji. Amid generally favorable environmental conditions, Tropical Depression 22F developed southwest of American Samoa on 9 May.[20] Just three hours later, the system intensified into a Category 1 tropical cyclone on the Australian scale, and was named Ella by the Fiji Meteorological Service (FMS).[21]
Other systems
During November 12, the first tropical disturbance of the season developed, about 300 km (185 mi) to the northeast of the island nation, Niue.[22] The system was poorly organised and over the next day atmospheric convection surrounding the system significantly decreased as it moved south-eastwards, within an area of moderate to high vertical wind shear.[22][23] As a result, the system was subsequently last noted during November 13, as it was not expected to develop into a tropical cyclone.[23] Tropical Disturbance 02F subsequently developed during November 23, around 300 km (185 mi) to the northeast of Pago Pago in American Samoa.[24] Over the next few days, the system remained poorly organised as it slowly moved south-eastwards, before the FMS reported that 02F was not expected to develop into a tropical cyclone and issued its last advisory on the system.[25] During November 26, the third tropical disturbance of the season moved into the basin from the Australian region, while it was located about 820 km (510 mi) to the northwest of Noumea, New Caledonia.[26] Over the next couple of days, 03F moved eastwards towards Vanuatu and remained poorly organised, before the FMS issued its last advisory on the system during November 30.[27]
During the first half of January 2017, Tropical Disturbances 06F, 07F and 08F developed in quick succession. Tropical Disturbance 06F developed over the Solomon Islands on 2 January, and dissipated four days later. Tropical Disturbances 07F and 08F both formed on 10 January. The former meandered around French Polynesia before it dissipated on 20 January, while the latter degenerated within 24 hours near Fiji. Tropical Disturbance 12F developed over Fiji on February 15, and moved around the archipelago erratically for the next nine days before dissipating. On February 23, Tropical Disturbance 16F formed well to the east of Vanuatu, and stalled there for the next few days before dissipating on February 26.
On March 4, Tropical Disturbance 17F developed in roughly the same region as its predecessor 16F. However, it dissipated just one day later. Tropical Disturbance 18F developed along a pre-frontal trough of low pressure during March 18, about 455 km (285 mi) to the north of Suva, Fiji.[28] Over the next couple of days, the system and associated trough of low pressure, moved south-eastwards towards Tonga, before the disturbance was last noted during March 21.[28][29] Cloud bands associated with the trough brought heavy rain and flooding to the Northern Division.[28]
Season effects
This table lists all the storms that developed in the South Pacific to the east of longitude 160°E during the 2016–17 season. It includes their intensity on the Australian tropical cyclone intensity scale, duration, name, where they affected, deaths and damages (in 2016 USD).
| Name | Dates active | Peak classification | Sustained wind speeds |
Pressure | Areas affected | Damage (USD) |
Deaths | Refs |
|---|---|---|---|---|---|---|---|---|
| 01F | November 12 – 13 | Tropical disturbance | Not Specified | 1008 hPa (29.77 inHg) | No land areas impacted | None | None | |
| 02F | November 23 – 27 | Tropical disturbance | Not Specified | 1006 hPa (29.71 inHg) | No land areas impacted | None | None | |
| 03F | November 29 – 30 | Tropical disturbance | Not Specified | 1000 hPa (29.53 inHg) | No land areas impacted | None | None | |
| 04F | December 12 – 23 | Tropical depression | 45 km/h (30 mph) | 998 hPa (29.47 inHg) | Fiji | $5 million | None | [30] |
| 05F | December 21 – 26 | Tropical depression | Not Specified | 1005 hPa (29.68 inHg) | No land areas impacted | None | None | |
| 06F | January 2 – 6 | Tropical disturbance | Not Specified | 1002 hPa (29.59 inHg) | None | None | None | |
| 07F | January 10 – 20 | Tropical disturbance | Not Specified | 998 hPa (29.47 inHg) | None | None | None | |
| 08F | January 10 – 11 | Tropical disturbance | Not Specified | 1009 hPa (29.80 inHg) | None | None | None | |
| 09F | February 5 – 11 | Tropical depression | Not Specified | 999 hPa (29.50 inHg) | Fiji | None | None | |
| 10F | February 7 – 11 | Tropical depression | Not Specified | 993 hPa (29.32 inHg) | Vanuatu, Fiji | None | None | |
| 11F | February 9 – 12 | Tropical depression | Not Specified | 1002 hPa (29.59 inHg) | Vanuatu, Fiji | None | None | |
| 12F | February 15 – 24 | Tropical disturbance | Not Specified | 1002 hPa (29.59 inHg) | Fiji | None | None | |
| 13F | February 15 – 18 | Tropical depression | Not Specified | 998 hPa (29.47 inHg) | None | None | None | |
| 14F | February 16 – 22 | Tropical depression | 55 km/h (35 mph) | 997 hPa (29.44 inHg) | Fiji | None | None | |
| Bart | February 19 – 22 | Category 1 tropical cyclone | 75 km/h (45 mph) | 994 hPa (29.35 inHg) | Southern Cook Islands | None | None | [12] |
| 16F | February 23 – 26 | Tropical disturbance | Not Specified | 1005 hPa (29.68 inHg) | None | None | None | |
| 17F | March 4 – 5 | Tropical disturbance | Not Specified | 1006 hPa (29.71 inHg) | None | None | None | |
| 18F | March 19 – 21 | Tropical disturbance | Not Specified | 1007 hPa (29.74 inHg) | None | None | None | |
| 19F | April 1 – 20 | Tropical depression | Not Specified | 988 hPa (29.17 inHg) | Samoa, Niue | None | None | |
| Cook | April 6 – 11 | Category 3 severe tropical cyclone | 155 km/h (100 mph) | 961 hPa (28.38 inHg) | Vanuatu, New Caledonia, New Zealand | Moderate | 1 | [31] |
| Donna | May 1 – 10 | Category 5 severe tropical cyclone | 205 km/h (125 mph) | 935 hPa (27.61 inHg) | Solomon Islands, Vanuatu, Fiji New Caledonia, New Zealand | Significant | 2 | [32] |
| Ella | May 7 – 14 | Category 2 tropical cyclone | 110 km/h (70 mph) | 977 hPa (28.85 inHg) | Samoan Islands, Tonga, Wallis and Futuna | None | None | |
| Season aggregates | ||||||||
| 22 systems | November 12, 2016 – May 14, 2017 | 205 km/h (125 mph) | 935 hPa (27.61 inHg) | $5 million | 3 | |||
See also
- List of South Pacific cyclone seasons
- List of off-season South Pacific tropical cyclones
- Atlantic hurricane seasons: 2016, 2017
- Pacific hurricane seasons: 2016, 2017
- Pacific typhoon seasons: 2016, 2017
- North Indian Ocean cyclone seasons: 2016, 2017
- 2016–17 Australian region cyclone season
- 2016–17 South-West Indian Ocean cyclone season
- South Atlantic tropical cyclone
References
- 1 2 Climate Services Division (October 26, 2010). Tropical Cyclone Guidance for Season 2010/11 for the Fiji and the Southwest Pacific (PDF) (Report). Fiji Meteorological Service. Archived from the original (PDF) on February 27, 2012. Retrieved October 17, 2016.
- 1 2 3 4 5 6 7 8 9 10 11 12 RSMC Nadi — Tropical Cyclone Centre (October 14, 2016). "2016–17 Tropical Cyclone Season Outlook in the Regional Specialised Meteorological Centre Nadi – Tropical Cyclone Centre (RSMC Nadi – TCC) Area of Responsibility (AOR)" (PDF). Fiji Meteorological Service. Archived (PDF) from the original on October 29, 2016. Retrieved October 29, 2016.
- 1 2 3 4 5 6 7 8 9 "Southwest Pacific Tropical Cyclone Outlook: Moderate La Niña or neutral tropical conditions expected to produce near average activity across most islands". National Institute of Water and Atmospheric Research. October 14, 2016. Archived from the original on February 10, 2017. Retrieved February 10, 2017.
- 1 2 3 4 5 6 "Southwest Pacific Tropical Cyclone Outlook Update: This update for the latter half of the 2016–17 Tropical Cyclone (TC) season (February to April 2017) suggests near normal activity can still be expected". National Institute of Water and Atmospheric Research. February 10, 2017. Archived from the original on February 10, 2017. Retrieved February 10, 2017.
- 1 2 3 4 National Climate Centre (October 14, 2016). "South Pacific Tropical Cyclone Outlook for 2016 to 2017". Australian Bureau of Meteorology. Archived from the original on October 17, 2016. Retrieved October 17, 2016.
- ↑ Tropical Disturbance Summary December 12, 2016 21z (Report). Fiji Meteorological Service. December 12, 2016. Archived from the original on 2016-12-14. Retrieved July 25, 2018.
- ↑ Tropical Disturbance Summary February 19, 2017 21z (Report). Fiji Meteorological Service. February 19, 2017. Archived from the original on 2017-02-21. Retrieved July 22, 2018.
- ↑ Tropical Disturbance Summary February 20, 2017 21z (Report). Fiji Meteorological Service. February 20, 2017. Archived from the original on 2017-02-21. Retrieved July 22, 2018.
- ↑ Tropical Cyclone 07P (Seven) Warning 001 February 21, 2017 03z (Report). United States Joint Typhoon Warning Center. February 21, 2017. Archived from the original on 2017-02-21. Retrieved July 22, 2018.
- ↑ Tropical Disturbance Advisory February 21, 2017 21z (Report). Fiji Meteorological Service. February 21, 2017. Archived from the original on 2017-02-21. Retrieved July 22, 2018.
- 1 2 3 4 MetService (2018). Review of the 2016/2017 and 2017/2018 Cyclone Seasons by TCWC Wellington (PDF). RA V Tropical Cyclone Committee for the South Pacific and South-East Indian Ocean Seventeenth Session. World Meteorological Organisation. p. 2. Archived (PDF) from the original on 2018-07-22. Retrieved July 22, 2018.
- 1 2 3 4 Fiji Meteorological Service (2018). Review of the 2016/2017 and 2017/2018 Cyclone Seasons by RSMC Nadi (PDF). RA V Tropical Cyclone Committee for the South Pacific and South-East Indian Ocean Seventeenth Session. World Meteorological Organisation. p. 2. Archived (PDF) from the original on 2018-07-22. Retrieved July 22, 2018.
- 1 2 Tropical Disturbance Summary April 1, 2017 09z (Report). Fiji Meteorological Service. April 1, 2017.
- ↑ Tropical Disturbance Summary April 5, 2017 21z (Report). Fiji Meteorological Service. April 5, 2017. Archived from the original on 2017-04-06. Retrieved July 27, 2018.
- ↑ Tropical Cyclone 16P Warning 001 April 8, 2017 03z (Report). United States Joint Typhoon Warning Center. April 7, 2017. Archived from the original on 2017-04-08. Retrieved July 27, 2018.
- ↑ Tropical Cyclone 16P Warning 005 April 10, 2017 03z (Report). United States Joint Typhoon Warning Center. April 10, 2017. Archived from the original on 2017-04-10. Retrieved July 27, 2018.
- ↑ Tropical Disturbance Advisory April 9, 2017 18z (Report). Fiji Meteorological Service. April 9, 2017. Archived from the original on 2017-04-10. Retrieved July 27, 2018.
- ↑ "{title}". Archived from the original on 2017-04-11. Retrieved 2017-04-11.
- ↑ "Cyclone Donna strongest May cyclone to hit Southern Hemisphere". 9 May 2017.
- ↑ Tropical Disturbance Advisory Number B1 issued from RSMC Nadi May 090235 UTC (Report). Fiji Meteorological Service. 9 May 2017. Archived from the original on 9 May 2017. Retrieved 11 May 2017.
- ↑ Tropical Disturbance Advisory Number B2 issued from RSMC Nadi May 090447 UTC (Report). Fiji Meteorological Service. 9 May 2017. Archived from the original on 9 May 2017. Retrieved 11 May 2017.
- 1 2 Tropical Disturbance Summary November 13, 2016 00z (Report). Fiji Meteorological Service. November 13, 2016. Archived from the original on 2016-11-13. Retrieved July 25, 2018.
- 1 2 Tropical Disturbance Summary November 13, 2016 23z (Report). Fiji Meteorological Service. November 13, 2016. Archived from the original on 2016-11-13. Retrieved July 25, 2018.
- ↑ Tropical Disturbance Summary November 23, 2016 18z (Report). Fiji Meteorological Service. November 23, 2016. Archived from the original on 2016-11-25. Retrieved July 26, 2018.
- ↑ Tropical Disturbance Summary November 27, 2016 21z (Report). Fiji Meteorological Service. November 27, 2016.
- ↑ Tropical Disturbance Summary November 29, 2016 06z (Report). Fiji Meteorological Service. November 29, 2016. Archived from the original on December 1, 2016. Retrieved July 25, 2018.
- ↑ Tropical Disturbance Summary November 30, 2016 21z (Report). Fiji Meteorological Service. November 30, 2016. Archived from the original on 2016-12-01. Retrieved July 25, 2018.
- 1 2 3 Climate Services Division (January 10, 2017). Fiji Islands Climate Summary March 2017 Volume 34 Issue 1 (PDF) (Report). Fiji Meteorological Service. Archived from the original (PDF) on April 29, 2017. Retrieved April 30, 2017.
- ↑ https://www.webcitation.org/6p9ecKO1r?url=http://gwydir.demon.co.uk/advisories/WWPS21-NFFN_201703210900.htm
- ↑ Climate Services Division (January 10, 2017). Fiji Islands Climate Summary December 2016 Volume 33 Issue 12 (PDF) (Report). Fiji Meteorological Service. Archived from the original (PDF) on 2017-01-16. Retrieved January 17, 2017.
- ↑ "Cyclone "Cook" hits New Caledonia, leaving 1 dead, 20 000 without power". The Watchers. April 10, 2017.
- ↑ "Damages reported in Temotu". Solomon Star. May 15, 2017. Archived from the original on May 16, 2017.
External links
- World Meteorological Organization
- Australian Bureau of Meteorology
- Fiji Meteorological Service
- New Zealand MetService
- Joint Typhoon Warning Center
Tropical cyclones of the 2016–17 South Pacific cyclone season | ||
|---|---|---|
| ||
| ||