1988 in Michigan
| 1988 in Michigan |
|---|
| History of Michigan |
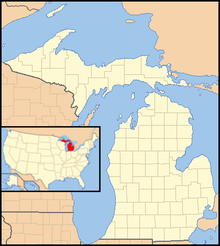
| Locator Map |
 |
| License plate |
 |
| 1986 1987 ← → 1989 1990 |
Events from the year 1988 in Michigan.
Top Michigan news stories
The Associated Press (AP) selected the top stories in Michigan for 1988 as follows:
- State ban on Medicaid funding for abortion.
- A drought led Gov. Blanchard to impose a statewide ban on outdoor burning, fireworks and cigarette smoking.
- Presidential politics, including Pat Robertson's popularity, Jesse Jackson's victory in the Michigan caucus, and Michael Dukakis losing the state
- (tie) The creation of the Michigan Education Trust
- (tie) Debate over changes in school financing.
- Medical waste on state beaches.
- The joint operating agreement between The Detroit News and Detroit Free Press.
- The trial and conviction of Alberta Easter and her three sons for the murder of three Inkster police officers.
- (tie) Crack cocaine, including firebombings of crackhouses and trials of Richard "White Boy Rick" Wershe and the Chambers Brothers drug ring.
- (tie) The surrender of Vincent Loonsfoot who was accused of killing four members of his wife's family on an Indian reservation near Escanaba.
The AP also selected the state's top sports stories as follows:
- The Detroit Pistons taking the Lakers to seven games in the NBA finals.
- Michigan State's victory over USC in the 1988 Rose Bowl.
- The Detroit Red Wings advancing the Stanley Cup semifinals.
- Kirk Gibson's signing as a free agent with the Los Angeles Dodgers.
- The Detroit Tigers finishing in second place in the American League East.
- The Detroit Lions' firing of Darryl Rogers and replacing him with Wayne Fontes.
- Flint native Jim Abbott leading the US baseball team in the 1988 Summer Olympics.
- The 1988 Michigan football winning the Big Ten championship and earning a berth in the 1989 Rose Bowl.
- Steve Yzerman emerging as a star with a 50-goal season.
- The Red Wings' suspension of Bob Probert and Petr Klíma
Office holders
State office holders
- Governor of Michigan: James Blanchard (Democrat)
- Lieutenant Governor of Michigan: Martha Griffiths (Democrat)
- Michigan Attorney General: Frank J. Kelley (Democrat)
- Michigan Secretary of State: Richard H. Austin (Democrat)
- Speaker of the Michigan House of Representatives: Gary Owen (Democrat)
- Majority Leader of the Michigan Senate: John Engler (Republican)
- Chief Justice, Michigan Supreme Court:
Mayors of major cities
- Mayor of Detroit: Coleman Young
- Mayor of Grand Rapids: Gerald R. Helmholdt
- Mayor of Flint: Matthew S. Collier
- Mayor of Lansing: Terry John McKane
- Mayor of Ann Arbor: Gerald Jernigan (Republican)
Federal office holders
- U.S. Senator from Michigan: Donald W. Riegle Jr. (Democrat)
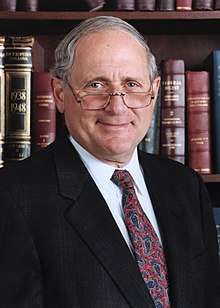
- U.S. Senator from Michigan: Carl Levin (Democrat)
- House District 1: John Conyers (Democrat)
- House District 2: Carl Pursell (Republican)
- House District 3: Howard Wolpe (Republican)
- House District 4: Fred Upton (Republican)
- House District 5: Harold S. Sawyer (Republican)
- House District 6: Bob Carr (Democrat)
- House District 7: Dale Kildee (Democrat)
- House District 8: J. Bob Traxler (Democrat)
- House District 9: Guy Vander Jagt (Republican)
- House District 10: Bill Schuette (Republican)
- House District 11: Robert William Davis (Republican)
- House District 12: David Bonior (Democrat)
- House District 13: George Crockett Jr. (Democrat)
- House District 14: Dennis M. Hertel (Democrat)
- House District 15: William D. Ford (Democrat)
- House District 16: John Dingell (Democrat)
- House District 17: Sander Levin (Democrat)
- House District 18: William Broomfield (Republican)
Population
In the 1980 United States Census, Michigan was recorded as having a population of 9,259,000 persons, ranking as the eighth most populous state in the country. By 1990, the state's population had grown only marginally by 0.4% to 9,259,000 persons.
Cities
The following is a list of cities in Michigan with a population of at least 50,000 based on 1980 U.S. Census data. Historic census data from 1970 and 1990 is included to reflect trends in population increases or decreases. Cities that are part of the Detroit metropolitan area are shaded in tan.
| 1980 Rank |
City | County | 1970 Pop. | 1980 Pop. | 1990 Pop. | Change 1980-90 |
|---|---|---|---|---|---|---|
| 1 | Detroit | Wayne | 1,514,063 | 1,203,368 | 1,027,974 | −14.6% |
| 2 | Grand Rapids | Kent | 197,649 | 181,843 | 189,126 | 4.0% |
| 3 | Warren | Macomb | 179,260 | 161,134 | 144,864 | −10.1% |
| 4 | Flint | Genesee | 193,317 | 159,611 | 140,761 | −11.8% |
| 5 | Lansing | Ingham | 131,403 | 130,414 | 127,321 | −2.4% |
| 6 | Sterling Heights | Macomb | 61,365 | 108,999 | 117,810 | 8.1% |
| 7 | Ann Arbor | Washtenaw | 100,035 | 107,969 | 109,592 | 1.5% |
| 8 | Livonia | Wayne | 110,109 | 104,814 | 100,850 | −3.8% |
| 9 | Dearborn | Wayne | 104,199 | 90,660 | 89,286 | −1.5% |
| 10 | Westland | Wayne | 86,749 | 84,603 | 84,724 | 0.1% |
| 11 | Kalamazoo | Kalamazoo | 85,555 | 79,722 | 80,277 | 0.7% |
| 12 | Taylor | Wayne | 70,020 | 77,568 | 70,811 | −8.7% |
| 13 | Saginaw | Saginaw | 91,849 | 77,508 | 69,512 | −10.3% |
| 14 | Pontiac | Oakland | 85,279 | 76,715 | 71,166 | −7.2% |
| 15 | St. Clair Shores | Macomb | 88,093 | 76,210 | 68,107 | −10.6% |
| 16 | Southfield | Oakland | 69,298 | 75,608 | 75,745 | 0.2% |
| 17 | Royal Oak | Oakland | 86,238 | 70,893 | 65,410 | −7.7% |
| 18 | Dearborn Heights | Wayne | 80,069 | 67,706 | 60,838 | −10.1% |
| 19 | Troy | Oakland | 39,419 | 67,102 | 72,884 | 8.6% |
| 20 | Wyoming | Kent | 56,560 | 59,616 | 63,891 | 7.2% |
| 21 | Farmington Hills | Oakland | -- | 58,056 | 74,611 | 28.5% |
| 22 | Roseville | Macomb | 60,529 | 54,311 | 51,412 | −5.3% |
| 23 | East Lansing | Ingham | 47,540 | 51,392 | 50,677 | −1.4% |
Counties
The following is a list of counties in Michigan with populations of at least 100,000 based on 1980 U.S. Census data. Historic census data from 1970 and 1990 are included to reflect trends in population increases or decreases. Counties that are part of the Detroit metropolitan area are shaded in tan.
| 1980 Rank |
County | Largest city | 1970 Pop. | 1980 Pop. | 1990 Pop. | Change 1980-90 |
|---|---|---|---|---|---|---|
| 1 | Wayne | Detroit | 2,666,751 | 2,337,891 | 2,111,687 | −9.7% |
| 2 | Oakland | Pontiac | 907,871 | 1,011,793 | 1,083,592 | 7.1% |
| 3 | Macomb | Warren | 625,309 | 694,600 | 717,400 | 3.3% |
| 4 | Genesee | Flint | 444,341 | 450,449 | 430,459 | −4.4% |
| 5 | Kent | Grand Rapids | 411,044 | 444,506 | 500,631 | 12.6% |
| 6 | Ingham | Lansing | 261,039 | 275,520 | 281,912 | 2.3% |
| 7 | Washtenaw | Ann Arbor | 234,103 | 264,748 | 282,937 | 6.9% |
| 8 | Saginaw | Saginaw | 219,743 | 228,059 | 211,946 | −7.1% |
| 9 | Kalamazoo | Kalamazoo | 201,550 | 212,378 | 223,411 | 5.2% |
| 10 | Berrien | Benton Harbor | 163,875 | 171,276 | 161,378 | −5.8% |
| 11 | Muskegon | Muskegon | 157,426 | 157,589 | 158,983 | 0.9% |
| 12 | Ottawa | Holland | 128,181 | 157,174 | 187,768 | 19.5% |
| 13 | Jackson | Jackson | 143,274 | 151,495 | 149,756 | −1.1% |
| 14 | Calhoun | Battle Creek | 141,963 | 141,557 | 135,982 | −3.9% |
| 15 | St. Clair | Port Huron | 120,175 | 138,802 | 145,607 | 4.9% |
| 16 | Monroe | Monroe | 118,479 | 134,659 | 133,600 | −0.8% |
| 17 | Bay | Bay City | 117,339 | 119,881 | 111,723 | −6.8% |
| 18 | Livingston | Howell | 58,967 | 100,289 | 115,645 | 15.3% |
Chronology of events
Births
Gallery of 1988 births
Deaths
- February 2 - G. Mennen Williams, Governor of Michigan (1949-1961), at age 76 in Detroit
- June 16 - Floyd J. McCree, first African-American Mayor of Flint, at age 65
- August 1 - John Dearden, Archbishop of Detroit (1958-1980) and a cardinal from 1969, at age 80 in Southfield, Michigan
- September 27 - J. C. Heard, swing, bop, and blues drummer, at age 71 in Royal Oak, Michigan
- November 13 - Antal Doráti, conductor and composer, conductor of the Detroit Symphony Orchestra (1977–81), at age 82 in Gerzensee, Switzerland.
Gallery of 1988 deaths
See also
References
|