Money supply
The money supply (or money stock) is the total value of money available in an economy at a point of time. There are several ways to define "money", but standard measures usually include currency in circulation and demand deposits (depositors' easily accessed assets on the books of financial institutions).[1][2] Each country’s central bank may use its own definitions of what constitutes money for its purposes.
| Part of a series on |
| Macroeconomics |
|---|
|
Basic concepts
|
|
Policies
|
|
Models
|
|
Related fields
|
|
Schools Mainstream
Heterodox
|
|
People
|
|
See also
|
|
| Finance | ||||||
|---|---|---|---|---|---|---|
 | ||||||
|
||||||
|
Instruments
|
||||||
|
Corporate
|
||||||
|
Personal
|
||||||
|
||||||
|
Regulation · Financial law
|
||||||
|
Economic history
|
||||||

Money supply data is recorded and published, usually by the government or the central bank of the country. Public and private sector analysts monitor changes in the money supply because of the belief that such changes affect the price level of securities, inflation, the exchange rates and the business cycle.[3]
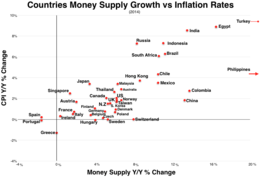
The relationship between money and prices has historically been associated with the quantity theory of money. There is strong empirical evidence of a direct relationship between the growth of the money supply and long-term price inflation, at least for rapid increases in the amount of money in the economy. For example, a country such as Zimbabwe which saw extremely rapid increases in its money supply also saw extremely rapid increases in prices (hyperinflation). This is one reason for the reliance on monetary policy as a means of controlling inflation.[4][5]
The nature of this causal chain is the subject of some debate. Some heterodox economists argue that the money supply is endogenous (determined by the workings of the economy, not by the central bank) and that the sources of inflation must be found in the distributional structure of the economy.[6]
In addition, those economists seeing the central bank's control over the money supply as feeble say that there are two weak links between the growth of the money supply and the inflation rate. First, in the aftermath of a recession, when many resources are underutilized, an increase in the money supply can cause a sustained increase in real production instead of inflation. Second, if the velocity of money (i.e., the ratio between nominal GDP and money supply) changes, an increase in the money supply could have either no effect, an exaggerated effect, or an unpredictable effect on the growth of nominal GDP.
Money creation by commercial banks
Commercial banks play a role in the process of money creation, especially under the fractional-reserve banking system used throughout the world. In this system, money is created whenever a bank gives out a new loan. This is because the loan, when drawn on and spent, mostly finishes up as a deposit in the banking system, which is counted as part of money supply. After putting aside a part of these deposits as mandated bank reserves, the balance is available for the making of further loans by the bank. This process continues multiple times, and is called the multiplier effect.
This new money makes up the non-M0 components in the M1-M3 statistics. In short, there are two types of money in a fractional-reserve banking system:[7][8]
- central bank money — obligations of a central bank, including currency and central bank depository accounts
- commercial bank money — obligations of commercial banks, including checking accounts and savings accounts.
In the money supply statistics, central bank money is MB while the commercial bank money is divided up into the M1-M3 components. Generally, the types of commercial bank money that tend to be valued at lower amounts are classified in the narrow category of M1 while the types of commercial bank money that tend to exist in larger amounts are categorized in M2 and M3, with M3 having the largest.
In the United States, a bank's reserves consist of U.S. currency held by the bank (also known as "vault cash"[9]) plus the bank's balances in Federal Reserve accounts.[10][11] For this purpose, cash on hand and balances in Federal Reserve ("Fed") accounts are interchangeable (both are obligations of the Fed). Reserves may come from any source, including the federal funds market, deposits by the public, and borrowing from the Fed itself.[12]
A reserve requirement is a ratio a bank must maintain between deposit liabilities and reserves.[13] Reserve requirements do not apply to the amount of money a bank may lend out. The ratio that applies to bank lending is its capital requirement.[14]
Open market operations by central banks
Central banks can influence the money supply by open market operations. They can increase the money supply by purchasing government securities, such as government bonds or treasury bills. This increases the liquidity in the banking system by converting the illiquid securities of commercial banks into liquid deposits at the central bank. This also causes the price of such securities to rise due to the increased demand, and interest rates to fall. These funds become available to commercial banks for lending, and by the multiplier effect from fractional-reserve banking, loans and bank deposits go up by many times the initial injection of funds into the banking system.
In contrast, when the central bank "tightens" the money supply, it sells securities on the open market, drawing liquid funds out of the banking system. The prices of such securities fall as supply is increased, and interest rates rise. This also has a multiplier effect.
This kind of activity reduces or increases the supply of short term government debt in the hands of banks and the non-bank public, also lowering or raising interest rates. In parallel, it increases or reduces the supply of loanable funds (money) and thereby the ability of private banks to issue new money through issuing debt.
The simple connection between monetary policy and monetary aggregates such as M1 and M2 changed in the 1970s as the reserve requirements on deposits started to fall with the emergence of money funds, which require no reserves. At present, reserve requirements apply only to "transactions deposits" – essentially checking accounts. The vast majority of funding sources used by private banks to create loans are not limited by bank reserves. Most commercial and industrial loans are financed by issuing large denomination CDs. Money market deposits are largely used to lend to corporations who issue commercial paper. Consumer loans are also made using savings deposits, which are not subject to reserve requirements. This means that instead of the value of loans supplied responding passively to monetary policy, we often see it rising and falling with the demand for funds and the willingness of banks to lend.
Some economists argue that the money multiplier is a meaningless concept, because its relevance would require that the money supply be exogenous, i.e. determined by the monetary authorities via open market operations. If central banks usually target the shortest-term interest rate (as their policy instrument) then this leads to the money supply being endogenous.[15]
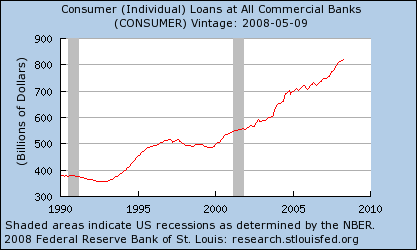
Neither commercial nor consumer loans are any longer limited by bank reserves. Nor are they directly linked proportional to reserves. Between 1995 and 2008, the value of consumer loans has steadily increased out of proportion to bank reserves. Then, as part of the financial crisis, bank reserves rose dramatically as new loans shrank.
In recent years, some academic economists renowned for their work on the implications of rational expectations have argued that open market operations are irrelevant. These include Robert Lucas, Jr., Thomas Sargent, Neil Wallace, Finn E. Kydland, Edward C. Prescott, T. Slimani and Scott Freeman. Keynesian economists point to the ineffectiveness of open market operations in 2008 in the United States, when short-term interest rates went as low as they could go in nominal terms, so that no more monetary stimulus could occur. This zero bound problem has been called the liquidity trap or "pushing on a string" (the pusher being the central bank and the string being the real economy).
Empirical measures in the United States Federal Reserve System
- See also European Central Bank for other approaches and a more global perspective.
Money is used as a medium of exchange, a unit of account, and as a ready store of value. Its different functions are associated with different empirical measures of the money supply. There is no single "correct" measure of the money supply. Instead, there are several measures, classified along a spectrum or continuum between narrow and broad monetary aggregates. Narrow measures include only the most liquid assets, the ones most easily used to spend (currency, checkable deposits). Broader measures add less liquid types of assets (certificates of deposit, etc.).
This continuum corresponds to the way that different types of money are more or less controlled by monetary policy. Narrow measures include those more directly affected and controlled by monetary policy, whereas broader measures are less closely related to monetary-policy actions.[5] It is a matter of perennial debate as to whether narrower or broader versions of the money supply have a more predictable link to nominal GDP.
The different types of money are typically classified as "M"s. The "M"s usually range from M0 (narrowest) to M3 (broadest) but which "M"s are actually focused on in policy formulation depends on the country's central bank. The typical layout for each of the "M"s is as follows:
| Type of money | M0 | MB | M1 | M2 | M3 | MZM |
|---|---|---|---|---|---|---|
| Notes and coins in circulation (outside Federal Reserve Banks and the vaults of depository institutions) (currency) | ✓[16] | ✓ | ✓ | ✓ | ✓ | ✓ |
| Notes and coins in bank vaults (vault cash) | ✓ | |||||
| Federal Reserve Bank credit (required reserves and excess reserves not physically present in banks) | ✓ | |||||
| Traveler's checks of non-bank issuers | ✓ | ✓ | ✓ | ✓ | ||
| Demand deposits | ✓ | ✓ | ✓ | ✓ | ||
| Other checkable deposits (OCDs), which consist primarily of negotiable order of withdrawal (NOW) accounts at depository institutions and credit union share draft accounts. | ✓[17] | ✓ | ✓ | ✓ | ||
| Savings deposits | ✓ | ✓ | ✓ | |||
| Time deposits less than $100,000 and money-market deposit accounts for individuals | ✓ | ✓ | ||||
| Large time deposits, institutional money market funds, short-term repurchase and other larger liquid assets[18] | ✓ | |||||
| All money market funds | ✓ |
- M0: In some countries, such as the United Kingdom, M0 includes bank reserves, so M0 is referred to as the monetary base, or narrow money.[19]
- MB: is referred to as the monetary base or total currency.[16] This is the base from which other forms of money (like checking deposits, listed below) are created and is traditionally the most liquid measure of the money supply.[20]
- M1: Bank reserves are not included in M1.
- M2: Represents M1 and "close substitutes" for M1.[21] M2 is a broader classification of money than M1. M2 is a key economic indicator used to forecast inflation.[22]
- M3: M2 plus large and long-term deposits. Since 2006, M3 is no longer published by the US central bank.[23] However, there are still estimates produced by various private institutions.
- MZM: Money with zero maturity. It measures the supply of financial assets redeemable at par on demand. Velocity of MZM is historically a relatively accurate predictor of inflation.[24][25][26]
The ratio of a pair of these measures, most often M2 / M0, is called an (actual, empirical) money multiplier.
Definitions of "money"
United States

The United States Federal Reserve published data on three monetary aggregates until 2006, when it ceased publication of M3 data[23] and only published data on M1 and M2. M1 consists of money commonly used for payment, basically currency in circulation and checking account balances; and M2 includes M1 plus balances that generally are similar to transaction accounts and that, for the most part, can be converted fairly readily to M1 with little or no loss of principal. The M2 measure is thought to be held primarily by households. Prior to its discontinuation, M3 comprised M2 plus certain accounts that are held by entities other than individuals and are issued by banks and thrift institutions to augment M2-type balances in meeting credit demands, as well as balances in money market mutual funds held by institutional investors. The aggregates have had different roles in monetary policy as their reliability as guides has changed. The principal components are:[28]
- M0: The total of all physical currency including coinage. M0 = Federal Reserve Notes + US Notes + Coins. It is not relevant whether the currency is held inside or outside of the private banking system as reserves.
- MB: The total of all physical currency plus Federal Reserve Deposits (special deposits that only banks can have at the Fed). MB = Coins + US Notes + Federal Reserve Notes + Federal Reserve Deposits
- M1: The total amount of M0 (cash/coin) outside of the private banking system plus the amount of demand deposits, travelers checks and other checkable deposits
- M2: M1 + most savings accounts, money market accounts, retail money market mutual funds, and small denomination time deposits (certificates of deposit of under $100,000).
- MZM: 'Money Zero Maturity' is one of the most popular aggregates in use by the Fed because its velocity has historically been the most accurate predictor of inflation. It is M2 – time deposits + money market funds
- M3: M2 + all other CDs (large time deposits, institutional money market mutual fund balances), deposits of eurodollars and repurchase agreements.
- M4-: M3 + Commercial Paper
- M4: M4- + T-Bills (or M3 + Commercial Paper + T-Bills)
- L: The broadest measure of liquidity, that the Federal Reserve no longer tracks. L is very close to M4 + Bankers' Acceptance
- Money Multiplier: M1 / MB. As of December 3, 2015 it was 0.756.[29] While a multiplier under one is historically an oddity, this is a reflection of the popularity of M2 over M1 and the massive amount of MB the government has created since 2008.
Although the Treasury can and does hold cash and a special deposit account at the Fed (fed funds), these assets do not count in any of the aggregates. So in essence, money paid in taxes paid to the Federal Government (Treasury) is excluded from the money supply. To counter this, the government created the Treasury Tax and Loan (TT&L) program in which any receipts above a certain threshold are redeposited in private banks. The idea is that tax receipts won't decrease the amount of reserves in the banking system. The TT&L accounts, while demand deposits, do not count toward M1 or any other aggregate either.
When the Federal Reserve announced in 2005 that they would cease publishing M3 statistics in March 2006, they explained that M3 did not convey any additional information about economic activity compared to M2, and thus, "has not played a role in the monetary policy process for many years." Therefore, the costs to collect M3 data outweighed the benefits the data provided.[23] Some politicians have spoken out against the Federal Reserve's decision to cease publishing M3 statistics and have urged the U.S. Congress to take steps requiring the Federal Reserve to do so. Congressman Ron Paul (R-TX) claimed that "M3 is the best description of how quickly the Fed is creating new money and credit. Common sense tells us that a government central bank creating new money out of thin air depreciates the value of each dollar in circulation."[30] Modern Monetary Theory disagrees. It holds that money creation in a free-floating fiat currency regime such as the U.S. will not lead to significant inflation unless the economy is approaching full employment and full capacity. Some of the data used to calculate M3 are still collected and published on a regular basis.[23] Current alternate sources of M3 data are available from the private sector.[31]
As of April 2013, the monetary base was $3 trillion[32] and M2, the broadest measure of money supply, was $10.5 trillion.[33]
United Kingdom
There are just two official UK measures. M0 is referred to as the "wide monetary base" or "narrow money" and M4 is referred to as "broad money" or simply "the money supply".
- M0: Cash outside Bank of England + banks' operational deposits with Bank of England. (When the Bank introduced Money Market Reform in May 2006, the Bank ceased publication of M0 and instead began publishing series for Reserve Balances at the Bank of England to accompany Notes and Coin in circulation.[34])
- M4: Cash outside banks (i.e. in circulation with the public and non-bank firms) + private-sector retail bank and building society deposits + private-sector wholesale bank and building society deposits and certificates of deposit.[35] In 2010 the total money supply (M4) measure in the UK was £2.2 trillion while the actual notes and coins in circulation totalled only £47 billion, 2.1% of the actual money supply.[36]
There are several different definitions of money supply to reflect the differing stores of money. Owing to the nature of bank deposits, especially time-restricted savings account deposits, M4 represents the most illiquid measure of money. M0, by contrast, is the most liquid measure of the money supply.
Eurozone
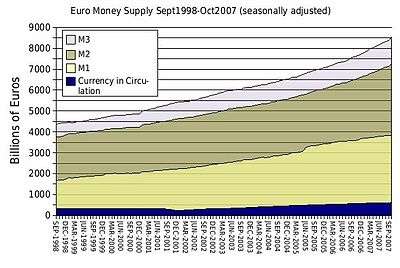
The European Central Bank's definition of euro area monetary aggregates:[37]
- M1: Currency in circulation + overnight deposits
- M2: M1 + deposits with an agreed maturity up to 2 years + deposits redeemable at a period of notice up to 3 months.
- M3: M2 + repurchase agreements + money market fund (MMF) shares/units + debt securities up to 2 years
Australia
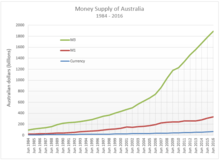
The Reserve Bank of Australia defines the monetary aggregates as:[38]
- M1: currency in circulation plus bank current deposits from the private non-bank sector
- M3: M1 + all other bank deposits from the private non-bank sector, plus bank certificate of deposits, less inter-bank deposits
- Broad money: M3 + borrowings from the private sector by NBFIs, less the latter's holdings of currency and bank deposits
- Money base: holdings of notes and coins by the private sector plus deposits of banks with the Reserve Bank of Australia (RBA) and other RBA liabilities to the private non-bank sector.
New Zealand

The Reserve Bank of New Zealand defines the monetary aggregates as:[39]
- M1: notes and coins held by the public plus chequeable deposits, minus inter-institutional chequeable deposits, and minus central government deposits
- M2: M1 + all non-M1 call funding (call funding includes overnight money and funding on terms that can of right be broken without break penalties) minus inter-institutional non-M1 call funding
- M3: the broadest monetary aggregate. It represents all New Zealand dollar funding of M3 institutions and any Reserve Bank repos with non-M3 institutions. M3 consists of notes & coin held by the public plus NZ dollar funding minus inter-M3 institutional claims and minus central government deposits
India
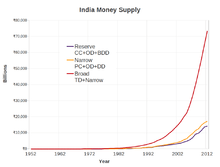
The Reserve Bank of India defines the monetary aggregates as:[40]
- Reserve Money (M0): Currency in circulation + Bankers' deposits with the RBI + 'Other' deposits with the RBI = Net RBI credit to the Government + RBI credit to the commercial sector + RBI's claims on banks + RBI's net foreign assets + Government's currency liabilities to the public – RBI's net non-monetary liabilities. M0 outstanding was ₹14.75 trillion in August 2017.
- M1: Currency with the public + Deposit money of the public (Demand deposits with the banking system + 'Other' deposits with the RBI). M1 was 184 per cent of M0 in August 2017.
- M2: M1 + Savings deposits with Post office savings banks. M2 was 879 per cent of M0 in August 2017.
- M3: (Broad concept of money supply)M1+ Time deposits with the banking system = Net bank credit to the Government + Bank credit to the commercial sector + Net foreign exchange assets of the banking sector + Government's currency liabilities to the public – Net non-monetary liabilities of the banking sector (Other than Time Deposits). M3 was 880 per cent of M0 in August 2017.
- M4: M3 + All deposits with post office savings banks (excluding National Savings Certificates).
Hong Kong
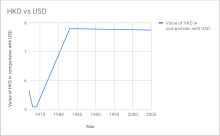
In 1967, when sterling was devalued, the dollar's peg to the pound was increased from 1 shilling 3 pence to 1 shilling 4½ pence (14.5455 dollars = 1 pound) although this did not entirely offset the devaluation. In 1972 the Hong Kong dollar was pegged to the U.S. dollar at a rate of 5.65 H.K. dollar = 1 U.S. dollar. This was revised to 5.085 H.K. dollar = 1 U.S. dollar in 1973. Between 1974 and 1983 the Hong Kong dollar floated. On 17 October 1983 the currency was pegged at a rate of 7.8 H.K. dollar = 1 U.S. dollar, through the currency board system.
As of 18 May 2005, in addition to the lower guaranteed limit, a new upper guaranteed limit was set for the Hong Kong dollar at 7.75 to the American dollar. The lower limit was lowered from 7.80 to 7.85 (by 100 pips per week from 23 May to 20 June 2005). The Hong Kong Monetary Authority indicated that this move was to narrow the gap between the interest rates in Hong Kong and those of the United States. A further aim of allowing the Hong Kong dollar to trade in a range is to avoid the HK dollar being used as a proxy for speculative bets on a renminbi revaluation.
The Hong Kong Basic Law and the Sino-British Joint Declaration provides that Hong Kong retains full autonomy with respect to currency issuance. Currency in Hong Kong is issued by the government and three local banks under the supervision of the territory's de facto central bank, the Hong Kong Monetary Authority. Bank notes are printed by Hong Kong Note Printing.
A bank can issue a Hong Kong dollar only if it has the equivalent exchange in US dollars on deposit. The currency board system ensures that Hong Kong's entire monetary base is backed with US dollars at the linked exchange rate. The resources for the backing are kept in Hong Kong's exchange fund, which is among the largest official reserves in the world. Hong Kong also has huge deposits of US dollars, with official foreign currency reserves of 331.3 billion USD as of September 2014.[41]
Japan
The Bank of Japan defines the monetary aggregates as:[42]
- M1: cash currency in circulation + deposit money
- M2 + CDs: M1 + quasi-money + CDs
- M3 + CDs: (M2 + CDs) + deposits of post offices + other savings and deposits with financial institutions + money trusts
- Broadly defined liquidity: (M3 + CDs) + money market + pecuniary trusts other than money trusts + investment trusts + bank debentures + commercial paper issued by financial institutions + repurchase agreements and securities lending with cash collateral + government bonds + foreign bonds
Link with inflation
Monetary exchange equation
The money supply is important because it is linked to inflation by the equation of exchange in an equation proposed by Irving Fisher in 1911:[43]

where
- is the total dollars in the nation's money supply,
- is the number of times per year each dollar is spent (velocity of money),
- is the average price of all the goods and services sold during the year,
- is the quantity of assets, goods and services sold during the year.


In mathematical terms, this equation is an identity which is true by definition rather than describing economic behavior. That is, velocity is defined by the values of the other three variables. Unlike the other terms, the velocity of money has no independent measure and can only be estimated by dividing PQ by M. Some adherents of the quantity theory of money assume that the velocity of money is stable and predictable, being determined mostly by financial institutions. If that assumption is valid then changes in M can be used to predict changes in PQ. If not, then a model of V is required in order for the equation of exchange to be useful as a macroeconomics model or as a predictor of prices.
Most macroeconomists replace the equation of exchange with equations for the demand for money which describe more regular and predictable economic behavior. However, predictability (or the lack thereof) of the velocity of money is equivalent to predictability (or the lack thereof) of the demand for money (since in equilibrium real money demand is simply Q/V). Either way, this unpredictability made policy-makers at the Federal Reserve rely less on the money supply in steering the U.S.economy. Instead, the policy focus has shifted to interest rates such as the fed funds rate.
In practice, macroeconomists almost always use real GDP to define Q, omitting the role of all transactions except for those involving newly produced goods and services (i.e., consumption goods, investment goods, government-purchased goods, and exports). But the original quantity theory of money did not follow this practice: PQ was the monetary value of all new transactions, whether of real goods and services or of paper assets.
The monetary value of assets, goods, and services sold during the year could be grossly estimated using nominal GDP back in the 1960s. This is not the case anymore because of the dramatic rise of the number of financial transactions relative to that of real transactions up until 2008. That is, the total value of transactions (including purchases of paper assets) rose relative to nominal GDP (which excludes those purchases).
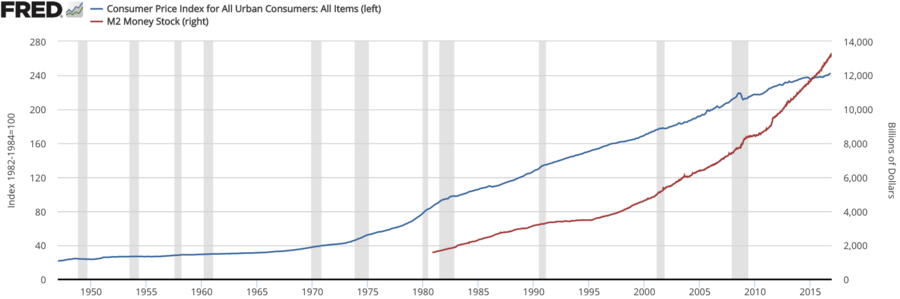
Ignoring the effects of monetary growth on real purchases and velocity, this suggests that the growth of the money supply may cause different kinds of inflation at different times. For example, rises in the U.S. money supplies between the 1970s and the present encouraged first a rise in the inflation rate for newly-produced goods and services ("inflation" as usually defined) in the ’70s and then asset-price inflation in later decades: it may have encouraged a stock market boom in the '80s and '90s and then, after 2001, a rise in home prices, i.e., the famous housing bubble. This story, of course, assumes that the amounts of money were the causes of these different types of inflation rather than being endogenous results of the economy's dynamics.
When home prices went down, the Federal Reserve kept its loose monetary policy and lowered interest rates; the attempt to slow price declines in one asset class, e.g. real estate, may well have caused prices in other asset classes to rise, e.g. commodities.
Rates of growth
In terms of percentage changes (to a close approximation, under low growth rates)[44], the percentage change in a product, say XY, is equal to the sum of the percentage changes %ΔX + %ΔY). So, denoting all percentage changes as per unit of time,
- %ΔP + %ΔQ = %ΔM + %ΔV.
This equation rearranged gives the basic inflation identity:
- %ΔP = %ΔM + %ΔV – %ΔQ.
Inflation (%ΔP) is equal to the rate of money growth (%ΔM), plus the change in velocity (%ΔV), minus the rate of output growth (%ΔQ).[45] So if in the long run the growth rate of velocity and the growth rate of real GDP are exogenous constants (the former being dictated by changes in payment institutions and the latter dictated by the growth in the economy’s productive capacity), then the monetary growth rate and the inflation rate differ from each other by a fixed constant.
As before, this equation is only useful if %ΔV follows regular behavior. It also loses usefulness if the central bank lacks control over %ΔM.
Arguments
Historically, in Europe, the main function of the central bank is to maintain low inflation. In the USA the focus is on both inflation and unemployment. These goals are sometimes in conflict (according to Phillips curve). A central bank may attempt to do this by artificially influencing the demand for goods by increasing or decreasing the nation's money supply (relative to trend), which lowers or raises interest rates, which stimulates or restrains spending on goods and services.
An important debate among economists in the second half of the twentieth century concerned the central bank's ability to predict how much money should be in circulation, given current employment rates and inflation rates. Economists such as Milton Friedman believed that the central bank would always get it wrong, leading to wider swings in the economy than if it were just left alone.[46] This is why they advocated a non-interventionist approach—one of targeting a pre-specified path for the money supply independent of current economic conditions—even though in practice this might involve regular intervention with open market operations (or other monetary-policy tools) to keep the money supply on target.
The former Chairman of the U.S. Federal Reserve, Ben Bernanke, suggested in 2004 that over the preceding 10 to 15 years, many modern central banks became relatively adept at manipulation of the money supply, leading to a smoother business cycle, with recessions tending to be smaller and less frequent than in earlier decades, a phenomenon termed "The Great Moderation"[47] This theory encountered criticism during the global financial crisis of 2008–2009. Furthermore, it may be that the functions of the central bank may need to encompass more than the shifting up or down of interest rates or bank reserves: these tools, although valuable, may not in fact moderate the volatility of money supply (or its velocity).
Impact of digital currencies and possible transition to a cashless society
See also
- A Program for Monetary Reform
- American Monetary Institute
- Bank regulation
- Capital requirement
- Central bank
- Chartalism
- Chicago plan
- The Chicago Plan Revisited
- Committee on Monetary and Economic Reform
- Core inflation
- Debt levels and flows
- Economics terminology that differs from common usage
- Fiat currency
- Financial capital
- Float
- Fractional-reserve banking
- FRED (Federal Reserve Economic Data)
- Full reserve banking
- Great Contraction
- Index of Leading Indicators – money supply is a component
- Inflation
- Monetarism
- Monetary base
- Monetary economics
- Monetary reform
- Money circulation
- Money creation
- Money market
- Money demand
- Liquidity preference
- Seigniorage
- Stagflation
References
- Alan Deardorff. "Money supply," Deardorff's Glossary of International Economics
- Karl Brunner, "money supply," The New Palgrave: A Dictionary of Economics, v. 3, p. 527.
- The Money Supply – Federal Reserve Bank of New York. Newyorkfed.org.
- Milton Friedman (1987). "quantity theory of money", The New Palgrave: A Dictionary of Economics, v. 4, pp. 15–19.
- "money supply Definition". Retrieved July 20, 2008.
- Lance Taylor: Reconstructing Macroeconomics, 2006
- Bank for International Settlements – The Role of Central Bank Money in Payment Systems. See page 9, titled, "The coexistence of central and commercial bank monies: multiple issuers, one currency": http://www.bis.org/publ/cpss55.pdf
A quick quote in reference to the two different types of money is listed on page 3. It is the first sentence of the document:
- "Contemporary monetary systems are based on the mutually reinforcing roles of central bank money and commercial bank monies."
- European Central Bank – "Domestic payments in Euroland: commercial and central bank money": "At the beginning of the 20th almost the totality of retail payments were made in central bank money. Over time, this monopoly came to be shared with commercial banks, when deposits and their transfer via checks and giros became widely accepted. Banknotes and commercial bank money became fully interchangeable payment media that customers could use according to their needs. While transaction costs in commercial bank money were shrinking, cashless payment instruments became increasingly used, at the expense of banknotes"
- 12 C.F.R. sec. 204.2(k).
- 12 C.F.R. sec. 204.5(a).
- What is vault cash? definition and meaning. Investorwords.com.
- Net Free or Borrowed Reserves of Depository Institutions (NFORBRES) – FRED – St. Louis Fed. Research.stlouisfed.org.
- FRB: Reserve Requirements. Federal Reserve Bank.
- Bank Capital Requirements Archived March 10, 2016, at the Wayback Machine.
- Boermans, Martijn; Moore, Basil (2009). Locked-in and Sticky textbooks. Issuu.com.
- "Gold, Oil, Stocks, Investments, Currencies, and the Federal Reserve: Growth of Global Money Supply" Archived September 15, 2015, at the Wayback Machine. DollarDaze Economic Commentary Blog by Mike Hewitt.
- M1 Money Stock (M1) – FRED – St. Louis Fed. Research.stlouisfed.org.
- M3 Definition. Investopedia (February 15, 2009).
- M0 (monetary base). Moneyterms.co.uk.
- "M0". Investopedia. Archived from the original on March 30, 2018. Retrieved July 20, 2008.
- "M2". Investopedia. Retrieved July 20, 2008.
- "M2 Definition". InvestorWords.com. Retrieved July 20, 2008.
- Discontinuance of M3, Federal Reserve, November 10, 2005, revised March 9, 2006.
- Aziz, John (March 10, 2013). "Is Inflation Always And Everywhere a Monetary Phenomenon?". Azizonomics. Retrieved April 2, 2013.
- Thayer, Gary (January 16, 2013). "Investors should assume that inflation will exceed the Fed's target". Macro Strategy. Wells Fargo Advisors. Archived from the original on July 14, 2014. Retrieved April 2, 2013.
- Carlson, John B.; Benjamin D. Keen (1996). "MZM: A monetary aggregate for the 1990s?" (PDF). Economic Review. Federal Reserve Bank of Cleveland. 32 (2): 15–23. Archived from the original (PDF) on September 4, 2012. Retrieved April 2, 2013.
- "Monetary Data – FRED". St. Louis Federal Reserve Bank. Retrieved November 20, 2016.
- "The Federal Reserve – Purposes and Functions''". Federalreserve.gov. April 24, 2013. Retrieved December 11, 2013.
- "M1 Money Multiplier". research.stlouisfed.org. Retrieved December 3, 2015.
- What the Price of Gold Is Telling Us. Lewrockwell.com (April 25, 2006).
- See, for example. Shadowstats.com.
- "Aggregate Reserves of Depository Institutions and the Monetary Base – H.3". Federal Reserve. Archived from the original on June 16, 2013.
- "H.6 Money Stock Measures". Federal Reserve Statistical Release. Federal Reserve. Archived from the original on June 16, 2013.
- https://www.bankofengland.co.uk/statistics/details/further-details-about-m0-data
- www.bankofengland.co.uk Archived August 9, 2007, at the Wayback Machine Explanatory Notes – M4 Retrieved August 13, 2007
- Lipsey, R. G. and Chrystal, K. A. (2011). Economics, 12th Edition, Oxford University Press. p. 455
- Bank, European Central. "Monetary aggregates". Retrieved November 20, 2016.
- RBA Glossary
- Series description – Monetary and financial statistics. Rbnz.govt.nz.
- "Handbook of Statistics on Indian Economy". See the document at the bottom of the page titled, "Notes on Tables". The definitions are on the fourth page of the document
- "Hong Kong's Latest Foreign Currency Reserve Assets Figures Released". Hong Kong Monetary Authority. Retrieved November 20, 2016.
- click on the link to the exms01.pdf file. They are defined in Appendix 1 which on the 11th page of the pdf. Archived August 31, 2010, at the Wayback Machine
- The Purchasing Power of Money, its Determination and Relation to Credit, Interest and Crises, Irving Fisher.
- Archived July 24, 2012, at the Wayback Machine
- "Breaking Monetary Policy into Pieces", May 24, 2004
- Milton Friedman (1962). Capitalism and Freedom.
- Speech, Bernanke – The Great Moderation. Federal Reserve Bank (February 20, 2004).
Further reading
- Article in the New Palgrave on Money Supply by Milton Friedman
- Do all banks hold reserves, and, if so, where do they hold them? (11/2001)
- What effect does a change in the reserve requirement have on the money supply? (08/2001)
- St. Louis Fed: Monetary Aggregates
- Hülsmann, Jörg (2008). The Ethics of Money Production. Auburn, Alabama: Ludwig von Mises Institute. p. 294. ISBN 9781933550091.
- Discontinuance of M3 Publication
- Investopedia: Money Zero Maturity (MZM)
External links
- Aggregate Reserves Of Depository Institutions And The Monetary Base (H.3)
- Historical H.3 releases
- Money Stock Measures (H.6)
- U.S. MZM magnitude and velocity, used as a predictor of inflation
- Data on Monetary Aggregates in Australia
- Monetary Statistics on Hong Kong Monetary Authority
- Monetary Survey from People's Bank of China