Demography of Australia
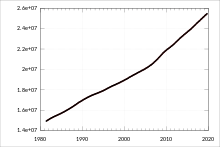
The demography of Australia covers basic statistics, most populous cities, ethnicity and religion. The population of Australia is estimated to be 25,686,900 as of 23 April 2020.[1] Australia is the 52nd most populous country in the world and the most populous Oceanian country. Its population is concentrated mainly in urban areas and is expected to exceed 28 million by 2030.[4]
| Demographics of | ||
|---|---|---|
| Indicator | Rank | Measure |
| Population | ||
| Population | 53rd | 25,686,900[1] |
| Economy | ||
| GDP (PPP) per capita | 19th | $63,699 |
| GDP | 12th | $1.56 trillion |
| Unemployment rate | ↓ 57th | 5.80%[2] |
| CO2 emissions | 11th | 18.3 t† |
| Electricity consumption | 17th | 213.5 TWh |
| Economic freedom | 3rd | 82.5 |
| Politics | ||
| Human Development Index | 3rd | 0.939 |
| Political freedom | 1st (equal)* | 1 |
| Corruption (A higher score means less (perceived) corruption.) | 11th | 80 |
| Press freedom | 18th | 5.38 |
| Society | ||
| Literacy rate | 21st | 99% |
| Broadband uptake | 17th | 13.8% |
| Beer consumption | 20th[3] | 4.49 L† |
| Health | ||
| Life expectancy | 4th | 81.2 |
| Birth rate | 148th | 13.8‡ |
| Fertility rate | 137th | 1.969†† |
| Infant mortality | 202nd | 4.57‡‡ |
| Death rate | 122nd | 7.56‡ |
| Suicide rate | 50th | ♂ 14.9†‡ ♀ 4.4†‡ |
| HIV/AIDS rate | 108th | 0.10% |
| Notes | ||
| ↓ indicates rank is in reverse order (e.g. 1st is lowest) † per capita ‡ per 1000 people †† per woman ‡‡ per 1000 live births †‡ per 100,000 people per year ♂ indicates males, ♀ indicates females | ||
Australia's population has grown from an estimated population of between 300,000 and 1,000,000 at the time of British settlement in 1788 due to numerous waves of immigration during the period since. Also due to immigration from other continents, the European component's share of the population is declining as a percentage.[5]
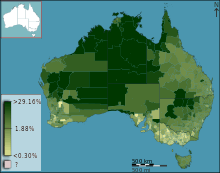
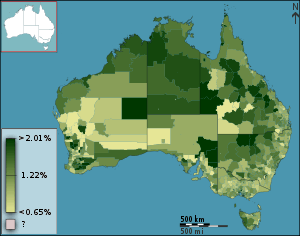
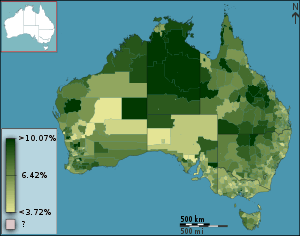
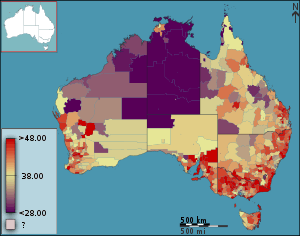
Australia has an average population density of 3.3 persons per square kilometre of total land area, which makes it one of the most sparsely populated countries in the world. This is generally attributed to the semi-arid and desert geography of much of the interior of the country. Another factor is urbanisation, with 89% of its population living in a handful of urban areas, Australia is one of the world's most urbanised countries.[6] The life expectancy of Australia in 2015–2017 was 83.2 years, among the highest in the world.[7]
Australia generally doesn't collect data on race, with the exception of Australian Aboriginals and Torres Strait Islanders, however the Australian census asks respondents to nominate their ancestry.
Cities
Australia contains five cities that consist of over one million people. Most of Australia's population live close to coastlines.[8]
Ancestry
The earliest accepted timeline for the first arrivals of indigenous Australians to the continent of Australia places this human migration to at least 65,000 years ago,[10] most probably from the islands of Indonesia and New Guinea.[11]
Captain James Cook claimed the east coast for Great Britain in 1770, the west coast was later settled by Britain also. At that time, the indigenous population was estimated to have been between 315,000 and 750,000,[12] divided into as many as 500 tribes speaking many different languages.
For generations, the vast majority of both colonial-era settlers and post-Federation immigrants came from the British Isles, although the gold rushes also drew migrants from other countries, notably from China. Since the end of World War II, Australia's population more than doubled, spurred by large-scale European immigration during the immediate post-war decades. At this time, the White Australia policy discouraged non-European immigration.
Abolition of the White Australia Policy in the mid-1970s led to a significant increase in non-European immigration, mostly from Asia.
In the 2016 Australian census, the most commonly nominated ancestries were:[N 1][13][14]
- English (36.1%)
- Australian (33.5%)[N 2]
- Irish (11.0%)
- Scottish (9.3%)
- Chinese (5.6%)
- Italian (4.6%)
- German (4.5%)
- Indian (2.8%)
- Indigenous (2.8%)[N 3]
- Greek (1.8%)
- Dutch (1.6%)
- Filipino (1.4%)
- Vietnamese (1.4%)
- Lebanese (1%)
At the 2016 census, 649,171 people (2.8% of the total population) identified as being Indigenous — Aboriginal Australians and Torres Strait Islanders.[N 4][16]
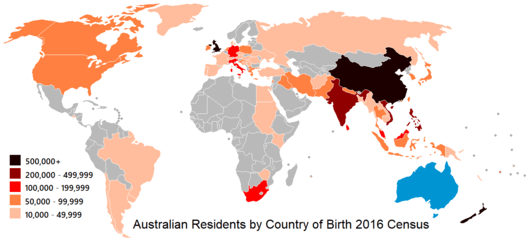
Immigration and country of birth
In 2018, 29% of the Australian resident population, or 7,341,910 people, were born overseas.[17]
Australia's population has quadrupled since the end of World War I,[18] much of this increase from immigration. Australia has the world's eighth-largest immigrant population, with immigrants accounting for 29% of the population, a higher proportion than in any other nation with a population of over 10 million.[17][19] Most immigrants are skilled,[20] but the immigration quota includes categories for family members and refugees.[20]
The Australian resident population consists of people who were born in the following countries:
| Source: Australian Bureau of Statistics (2018)[17] | |
|---|---|
| Place of birth | Estimated resident population[upper-alpha 1] |
| Total Australian-born | 17,650,000 |
| Total foreign-born | 7,341,910 |
| 992,000 | |
| 651,000 | |
| 592,000 | |
| 568,000 | |
| 278,000 | |
| 256,000 | |
| 189,000 | |
| 187,000 | |
| 174,000 | |
| 135,000 | |
| 134,500 | |
| 116,120 | |
| 114,580 | |
| 108,830 | |
| 108,610 | |
| 100,620 | |
For more information about immigration see Immigration to Australia and Foreign-born population of Australia.
Religion
Australia was, historically, a majority Protestant nation with a large Catholic minority.[23][24] Australia has become a religiously diverse country with 22% being Catholic, 30% having no religion and there are significant numbers of Muslims, Buddhists, Hindus and others. While Australia has no official religion, the various governments of Australia refer to the Christian God in their ceremonies, as do the various Australian Courts. Generally, 52.1% of Australians are Christian, 30.1% have no religion and 8.2% are other religions.[22]
In an optional question on the 2016 Census, 52.1% of the Australian population declared some variety of Christianity. Historically the percentage has been far higher and the religious landscape of Australia is changing and diversifying.[25] Also in 2016, 30.1% of Australians stated "no religion" and a further 9.6% chose not to answer the question.[25] The remaining population is a diverse group which includes Muslims (2.6%), Buddhists (2.4%), Hindus (1.9%), Sikhs (0.5%), and Jews (0.4%).[25][26]
The Australian Bureau of Statistics 2001 Census Dictionary statement on religious affiliation states the purpose for gathering such information:
Data on religious affiliation are used for such purposes as planning educational facilities, aged persons' care and other social services provided by religion-based organisations; the location of church buildings; the assigning of chaplains to hospitals, prisons, armed services and universities; the allocation of time on public radio and other media; and sociological research.
As in many Western countries, the level of active participation in religious services is lower than would be indicated by the proportion of the population identifying themselves as affiliated with a religion; weekly attendance at Christian church services is about 1.5 million, or about 7.5% of the population.[27] Christian charitable organisations, hospitals and schools play a prominent role in welfare and education services. The Catholic education system is the second biggest sector after government schools, with more than 650,000 students (and around 21 per cent of all secondary school enrolments).
Language
Although Australia has no official language, English has always been entrenched as the de facto national language.[28] Australian English is a major variety of the language with a distinctive accent and lexicon,[29] and differs slightly from other varieties of English in grammar and spelling.[30] General Australian serves as the standard dialect.
According to the 2016 census, English is the only language spoken in the home for close to 72.7% of the population. The next most common languages spoken at home are:[31][32]
- Mandarin (2.5%)
- Arabic (1.4%)
- Cantonese (1.2%)
- Vietnamese (1.2%)
- Italian (1.2%)
- Greek (1.0%)
- Hindi (0.7%)
- Spanish (0.6%)
- Punjabi (0.6%).
A considerable proportion of first- and second-generation migrants are bilingual.
Over 250 Indigenous Australian languages are thought to have existed at the time of first European contact, of which less than 20 are still in daily use by all age groups.[33][34] About 110 others are spoken exclusively by older people.[34] At the time of the 2006 census, 52,000 Indigenous Australians, representing 12% of the Indigenous population, reported that they spoke an Indigenous language at home.[35] Australia has a sign language known as Auslan, which is the main language of about 5,500 deaf people.[36]
Indigenous population
The earliest accepted timeline for the first arrivals of indigenous Australians to the continent of Australia places this human migration to at least 40,000 years ago.[11]
These first inhabitants of Australia were originally hunter-gatherers, who over the course of many succeeding generations diversified widely throughout the continent and its nearby islands. Although their technical culture remained static—depending on wood, bone, and stone tools and weapons—their spiritual and social life was highly complex. Most spoke several languages, and confederacies sometimes linked widely scattered tribal groups. Aboriginal population density ranged from approximately one person per 3 km2 (1 sq mi) along the coasts to one person per 90 km2 (35 sq mi) in the arid interior. Food procurement was usually a matter for the nuclear family, requiring an estimated 3 days of work per week.
Dutch navigators landed on the coasts of modern Western Australia and Queensland several times during the 17th century. Captain James Cook wrote that he claimed the east coast for Great Britain in 1770 while standing on Possession Island off the west coast of Cape York Peninsula. The west coast was later settled by Britain also. At that time, the indigenous population was estimated to have been between 315,000 and 750,000,[12] divided into many tribes speaking many different languages. In the 2011 census, 495,757 respondents declared they were Aboriginal, 31,407 declared they were Torres Strait Islander, and a further 21,206 declared they were both Aboriginal and Torres Strait Islanders.[37]
Since the end of World War II, efforts have been made both by the government and by the public to be more responsive to Aboriginal rights and needs.
Today, most of Australia's Indigenous population live on the east coast of Australia, where almost 60% of Indigenous Australians live in New South Wales (208,476) and Queensland (188,954) which roughly represents 2–5% of those state's populations. The Northern Territory has an Indigenous population of almost 70,000 and represents about 30% of the total Northern Territory population.
States and territories
| State/territory | Population (2016 census) |
Land area | Population density | % of population in capital |
Notes | ||
|---|---|---|---|---|---|---|---|
| km2 | mi2 | per km2 | per mi2 | ||||
| 7,797,800 | 800,642 | 309,130 | 8.64 | 22 | 63% | [38] | |
| 6,244,200 | 227,416 | 87,806 | 23.54 | 61 | 71% | [39] | |
| 4,883,700 | 1,730,648 | 668,207 | 2.50 | 6 | 46% | [40] | |
| 2,567,800 | 2,239,170 | 864,548 | 0.89 | 2 | 73.4% | [41] | |
| 1,717,000 | 983,482 | 379,725 | 1.62 | 4 | 73.5% | [42] | |
| 519,100 | 68,401 | 26,410 | 7.24 | 19 | 41% | [43] | |
| 406,400 | 2,358 | 910 | 151.49 | 392 | 100% | [44] | |
| 245,000 | 1,349,129 | 520,902 | 0.16 | 0.4 | 54% | [45] | |
Historical population
Note that population estimates in the table below do not include the Aboriginal population before 1961. Estimates of Aboriginal population prior to European settlement range from 300,000 to one million, with archaeological finds indicating a sustainable population of around 750,000.[46] Where available, actual population figures from census years are included.
| Historic population (estimated) | ||||||||||||||||||||||||||||||||||||||||||||||||||||||||||||||||||||||||||||||||||||||||||||||||||||||||||||||||||||||||||||||||||||||||||||
|---|---|---|---|---|---|---|---|---|---|---|---|---|---|---|---|---|---|---|---|---|---|---|---|---|---|---|---|---|---|---|---|---|---|---|---|---|---|---|---|---|---|---|---|---|---|---|---|---|---|---|---|---|---|---|---|---|---|---|---|---|---|---|---|---|---|---|---|---|---|---|---|---|---|---|---|---|---|---|---|---|---|---|---|---|---|---|---|---|---|---|---|---|---|---|---|---|---|---|---|---|---|---|---|---|---|---|---|---|---|---|---|---|---|---|---|---|---|---|---|---|---|---|---|---|---|---|---|---|---|---|---|---|---|---|---|---|---|---|---|---|
|
|
| ||||||||||||||||||||||||||||||||||||||||||||||||||||||||||||||||||||||||||||||||||||||||||||||||||||||||||||||||||||||||||||||||||||||||||
Total Fertility Rate from 1850 to 1899
The total fertility rate is the number of children born per woman. It is based on fairly good data for the entire period. Sources: Our World In Data and Gapminder Foundation.[54]
The following figures show the total fertility rates since the first years of British colonisation.
| Years | 1850 | 1851 | 1852 | 1853 | 1854 | 1855 | 1856 | 1857 | 1858 | 1859 | 1860[54] |
|---|---|---|---|---|---|---|---|---|---|---|---|
| Total Fertility Rate in Australia | 4.94 | 5.01 | 4.07 | 5.03 | 4.86 | 5.32 | 5.19 | 5.63 | 5.71 | 5.75 | 5.71 |
| Years | 1861 | 1862 | 1863 | 1864 | 1865 | 1866 | 1867 | 1868 | 1869 | 1870[54] |
|---|---|---|---|---|---|---|---|---|---|---|
| Total Fertility Rate in Australia | 5.67 | 5.8 | 5.59 | 5.75 | 5.64 | 5.33 | 5.41 | 5.43 | 5.19 | 5.19 |
| Years | 1871 | 1872 | 1873 | 1874 | 1875 | 1876 | 1877 | 1878 | 1879 | 1880[54] |
|---|---|---|---|---|---|---|---|---|---|---|
| Total Fertility Rate in Australia | 5.09 | 4.97 | 5.01 | 4.93 | 4.81 | 4.81 | 4.69 | 4.74 | 4.8 | 4.73 |
| Years | 1881 | 1882 | 1883 | 1884 | 1885 | 1886 | 1887 | 1888 | 1889 | 1890[54] |
|---|---|---|---|---|---|---|---|---|---|---|
| Total Fertility Rate in Australia | 4.73 | 4.62 | 4.66 | 4.77 | 4.78 | 4.74 | 4.77 | 4.76 | 4.65 | 4.69 |
| Years | 1891 | 1892 | 1893 | 1894 | 1895 | 1896 | 1897 | 1898 | 1899[54] |
|---|---|---|---|---|---|---|---|---|---|
| Total Fertility Rate in Australia | 4.62 | 4.52 | 4.4 | 4.13 | 4.07 | 3.81 | 3.78 | 3.64 | 3.66 |
Crude birth rates from 1860 to 1899
The crude birth rate is the total number of live births per 1,000 population in a year. Source: Australian Bureau of Statistics.[55]
| Years | 1860 | 1861 | 1862 | 1863 | 1864 | 1865 | 1866 | 1867 | 1868 | 1869 | 1870 |
|---|---|---|---|---|---|---|---|---|---|---|---|
| 42.6 | 42.3 | 43.3 | 41.7 | 42.9 | 42.1 | 39.8 | 40.4 | 40.5 | 38.7 | 38.7 | |
| Years | 1871 | 1872 | 1873 | 1874 | 1875 | 1876 | 1877 | 1878 | 1879 | 1880 | |
| 38.0 | 37.1 | 37.4 | 36.8 | 35.9 | 35.9 | 35.0 | 35.4 | 35.8 | 35.3 | ||
| Years | 1881 | 1882 | 1883 | 1884 | 1885 | 1886 | 1887 | 1888 | 1889 | 1890 | |
| 35.3 | 34.5 | 34.8 | 35.6 | 35.7 | 35.4 | 35.6 | 35.5 | 34.7 | 35.0 | ||
| Years | 1891 | 1892 | 1893 | 1894 | 1895 | 1896 | 1897 | 1898 | 1899 | ||
| 34.5 | 33.7 | 32.8 | 30.8 | 30.4 | 28.4 | 28.2 | 27.2 | 27.3 |
Historical percent distribution of the total population by age
Source: Australian Bureau of Statistics.[56][57][58][59]
| Ages | 1901 | 1911 | 1921 | 1931 | 1941 | 1951 | 1961 | 1971 | 1981 | 1991 | 2001 | 2007 | 2016 |
|---|---|---|---|---|---|---|---|---|---|---|---|---|---|
| 0-14 years | 35.1 | 31.6 | 31.8 | 28.5 | 24.2 | 27.2 | 30.3 | 28.7 | 25.0 | 21.9 | 20.5 | 19.4 | 18.6 |
| 15-24 years | 19.4 | 20.1 | 16.9 | 18.1 | 17.5 | 14.1 | 14.3 | 17.4 | 17.4 | 16.0 | 13.7 | 14.0 | 12.8 |
| 25-44 years | 29.4 | 28.8 | 30.0 | 29.3 | 30.0 | 29.4 | 27.7 | 27.4 | 28.4 | 28.6 | 30.0 | 29.2 | 27.9 |
| 45-64 years | 12.0 | 14.8 | 17.0 | 18.0 | 20.9 | 20.4 | 19.9 | 20.0 | 19.2 | 19.3 | 23.1 | 25.0 | 25.1 |
| 65 years and over | 4.0 | 4.3 | 4.5 | 6.1 | 7.4 | 8.1 | 8.5 | 8.3 | 9.8 | 11.3 | 12.6 | 13.2 | 15.8 |
| Total (%) | 100 | 99.6 | 100 | 100 | 100 | 100 | 100 | 100 | 100 | 100 | 100 | 100 | 100 |
Historical median age of the population
Median age of the Australia population through history. Source: Australian Bureau of Statistics.[57][58][60][61]
| Years | 1901 | 1911 | 1921 | 1951 | 1961 | 1971 | 1981 | 1991 | 2001 | 2015 | 2017 |
|---|---|---|---|---|---|---|---|---|---|---|---|
| Median age of the total population | 22.5 | 24.0 | 25.8 | 30.3 | 29.3 | 27.7 | 29.6 | 32.4 | 35.7 | 37.4 | 38.7 |
| Median age of males | 23.6 | 24.6 | 26.1 | 29.9 | 28.7 | 27.0 | 29.0 | 31.7 | 34.9 | 37.9 | |
| Median age of females | 21.5 | 23.4 | 25.5 | 30.8 | 30.2 | 28.3 | 30.2 | 33.0 | 36.4 | 39.5 |
Vital statistics since 1900
Source:[62]
| Average population | Live births | Deaths | Natural change | Crude birth rate (per 1,000) | Crude death rate (per 1,000) | Natural change (per 1,000) | Total fertility rates[upper-alpha 6][54] | Net overseas migration[63][64][65] | |
|---|---|---|---|---|---|---|---|---|---|
| 1900 | 3,715,000 | 102,221 | 44,060 | 58,161 | 27.3 | 11.8 | 15.5 | 3.66 | |
| 1901 | 3,765,000 | 102,945 | 46,330 | 56,615 | 27.1 | 12.2 | 14.9 | 3.64 | |
| 1902 | 3,824,000 | 102,776 | 48,078 | 54,698 | 26.7 | 12.5 | 14.2 | 3.39 | |
| 1903 | 3,875,000 | 98,443 | 47,293 | 51,150 | 25.3 | 12.1 | 13.2 | 3.58 | |
| 1904 | 3,916,000 | 104,113 | 43,572 | 60,541 | 26.4 | 11.0 | 15.4 | 3.54 | |
| 1905 | 3,974,000 | 104,941 | 43,514 | 61,427 | 26.2 | 10.9 | 15.3 | 3.51 | |
| 1906 | 4,032,000 | 107,890 | 44,333 | 63,557 | 26.6 | 10.9 | 15.7 | 3.35 | |
| 1907 | 4,091,000 | 110,347 | 45,305 | 55,042 | 26.7 | 11.0 | 15.7 | 3.35 | |
| 1908 | 4,161,000 | 111,545 | 46,426 | 55,119 | 26.6 | 11.1 | 15.5 | 3.35 | |
| 1909 | 4,232,000 | 114,071 | 44,172 | 59,899 | 26.7 | 10.3 | 16.4 | 3.35 | |
| 1910 | 4,323,000 | 116,801 | 45,590 | 61,211 | 26.7 | 10.4 | 16.3 | 3.35 | |
| 1911 | 4,425,000 | 122,193 | 47,869 | 74,324 | 27.2 | 10.6 | 16.6 | 3.51 | |
| 1912 | 4,573,000 | 133,088 | 52,177 | 80,911 | 28.6 | 11.2 | 17.4 | 3.51 | |
| 1913 | 4,820,172 | 135,714 | 51,789 | 83,925 | 28.2 | 10.7 | 17.5 | 3.51 | |
| 1914 | 4,893,000 | 137,983 | 51,720 | 86,263 | 28.0 | 10.5 | 17.5 | 3.51 | |
| 1915 | 4,971,000 | 134,871 | 52,782 | 82,089 | 27.1 | 10.6 | 16.5 | 3.51 | |
| 1916 | 4,969,000 | 131,426 | 54,197 | 77,219 | 26.6 | 11.0 | 15.6 | 3.07 | |
| 1917 | 4,917,000 | 129,965 | 48,029 | 81,936 | 26.3 | 9.7 | 16.6 | 3.35 | |
| 1918 | 4,982,000 | 125,739 | 50,249 | 75,490 | 25.0 | 10.0 | 15.0 | 3.07 | |
| 1919 | 5,080,000 | 122,290 | 65,930 | 56,360 | 23.6 | 12.7 | 10.9 | 3.07 | |
| 1920 | 5,303,000 | 136,406 | 56,289 | 80,117 | 25.5 | 10.5 | 15.5 | 3.07 | |
| 1921 | 5,411,000 | 136,198 | 54,076 | 82,122 | 24.9 | 9.9 | 15.0 | 3.12 | |
| 1922 | 5,510,000 | 137,496 | 51,311 | 86,185 | 24.7 | 9.2 | 15.5 | 3.11 | |
| 1923 | 5,637,000 | 135,222 | 56,236 | 78,986 | 23.7 | 9.9 | 13.8 | 3.02 | |
| 1924 | 5,755,000 | 134,927 | 54,980 | 79,953 | 23.2 | 9.4 | 13.8 | 2.97 | |
| 1925 | 5,882,000 | 135,792 | 54,658 | 81,134 | 22.9 | 9.2 | 13.7 | 2.95 | |
| 1926 | 6,000,000 | 133,162 | 56,952 | 76,210 | 22.0 | 9.4 | 12.6 | 2.85 | |
| 1927 | 6,124,000 | 133,698 | 58,282 | 75,716 | 21.6 | 9.4 | 12.2 | 2.80 | |
| 1928 | 6,251,000 | 134,078 | 59,378 | 74,700 | 21.3 | 9.4 | 11.9 | 2.77 | |
| 1929 | 6,355,000 | 129,480 | 60,857 | 68,623 | 20.2 | 9.5 | 10.7 | 2.64 | |
| 1930 | 6,436,000 | 128,399 | 55,331 | 73,068 | 19.8 | 8.6 | 11.2 | 2.58 | |
| 1931 | 6,500,000 | 118,509 | 56,560 | 61,949 | 18.2 | 8.7 | 9.5 | 2.36 | |
| 1932 | 6,552,000 | 110,933 | 56,757 | 54,176 | 16.9 | 8.6 | 8.3 | 2.19 | |
| 1933 | 6,603,000 | 111,269 | 59,117 | 52,152 | 16.8 | 8.9 | 7.9 | 2.17 | |
| 1934 | 6,656,000 | 109,475 | 62,229 | 47,246 | 16.4 | 9.3 | 7.1 | 2.11 | |
| 1935 | 6,707,000 | 111,325 | 63,599 | 47,726 | 16.5 | 9.4 | 7.1 | 2.12 | |
| 1936 | 6,755,000 | 116,073 | 63,932 | 52,141 | 17.1 | 9.4 | 7.7 | 2.18 | |
| 1937 | 6,810,000 | 119,131 | 64,496 | 54,635 | 17.4 | 9.4 | 8.0 | 2.21 | |
| 1938 | 6,871,000 | 120,415 | 66,451 | 53,964 | 17.4 | 9.6 | 7.8 | 2.21 | |
| 1939 | 6,935,000 | 122,891 | 69,147 | 53,744 | 17.6 | 9.9 | 7.7 | 2.22 | |
| 1940 | 7,004,000 | 126,347 | 68,384 | 57,963 | 17.9 | 9.7 | 8.2 | 2.26 | |
| 1941 | 7,077,000 | 134,525 | 71,176 | 63,349 | 18.9 | 10.0 | 8.9 | 2.36 | |
| 1942 | 7,143,000 | 136,708 | 75,191 | 61,517 | 19.1 | 10.5 | 8.6 | 2.38 | |
| 1943 | 7,201,000 | 149,295 | 74,486 | 74,809 | 20.6 | 10.3 | 10.3 | 2.57 | |
| 1944 | 7,269,000 | 153,344 | 69,596 | 83,748 | 21.0 | 9.5 | 11.5 | 2.63 | |
| 1945 | 7,347,000 | 160,560 | 70,231 | 90,229 | 21.7 | 9.5 | 12.2 | 2.74 | |
| 1946 | 7,430,000 | 176,379 | 74,661 | 101,718 | 23.6 | 10.0 | 13.6 | 2.99 | |
| 1947 | 7,517,000 | 182,384 | 73,468 | 108,916 | 24.1 | 9.7 | 14.4 | 3.08 | |
| 1948 | 7,637,000 | 177,976 | 76,839 | 101,137 | 23.1 | 10.0 | 13.1 | 2.98 | |
| 1949 | 7,792,000 | 181,261 | 75,260 | 106,001 | 22.9 | 9.5 | 13.4 | 2.99 | |
| 1950 | 8,045,000 | 190,591 | 78,187 | 112,404 | 23.3 | 9.6 | 13.7 | 3.01 | |
| 1951 | 8,307,000 | 193,298 | 81,788 | 111,510 | 23.0 | 9.7 | 13.3 | 3.06 | |
| 1952 | 8,527,000 | 201,650 | 81,597 | 120,053 | 23.4 | 9.5 | 13.9 | 3.15 | |
| 1953 | 8,739,000 | 202,235 | 80,188 | 122,047 | 22.9 | 9.1 | 13.8 | 3.23 | |
| 1954 | 8,902,000 | 202,256 | 81,805 | 120,451 | 22.5 | 9.1 | 13.4 | 3.3 | |
| 1955 | 9,089,000 | 207,677 | 82,036 | 125,641 | 22.6 | 8.9 | 13.7 | 3.35 | |
| 1956 | 9,311,000 | 212,633 | 86,088 | 126,545 | 22.5 | 9.1 | 13.4 | 3.39 | |
| 1957 | 9,530,000 | 220,358 | 84,953 | 135,405 | 22.9 | 8.8 | 14.1 | 3.41 | |
| 1958 | 9,744,000 | 222,504 | 83,723 | 138,481 | 22.6 | 8.5 | 14.1 | 3.42 | |
| 1959 | 9,947,000 | 226,976 | 89,212 | 137,765 | 22.6 | 8.9 | 13.7 | 3.41 | |
| 1960 | 10,160,000 | 230,326 | 88,464 | 141,862 | 22.4 | 8.6 | 13.8 | 3.39 | |
| 1961 | 10,391,000 | 239,986 | 88,961 | 151,025 | 22.8 | 8.5 | 14.3 | 3.35 | |
| 1962 | 10,642,000 | 237,081 | 93,163 | 143,918 | 22.1 | 8.7 | 13.4 | 3.3 | |
| 1963 | 10,846,000 | 235,689 | 94,894 | 140,795 | 21.5 | 8.7 | 12.8 | 3.24 | |
| 1964 | 11,055,000 | 229,149 | 100,594 | 128,555 | 20.5 | 8.7 | 11.8 | 3.17 | |
| 1965 | 11,280,000 | 222,854 | 99,715 | 123,139 | 19.6 | 8.8 | 10.8 | 2.97 | |
| 1966 | 11,505,000 | 223,731 | 103,929 | 119,802 | 19.3 | 9.0 | 10.3 | 2.89 | |
| 1967 | 11,704,000 | 229,796 | 102,703 | 127,093 | 19.4 | 8.7 | 10.7 | 2.85 | |
| 1968 | 11,912,000 | 240,906 | 109,547 | 131,359 | 20.0 | 9.1 | 10.9 | 2.89 | |
| 1969 | 12,145,000 | 250,175 | 106,496 | 143,681 | 20.4 | 8.7 | 11.7 | 2.93 | |
| 1970 | 12,407,000 | 257,516 | 113,048 | 144,468 | 20.5 | 9.0 | 10.5 | 2.94 | |
| 1971 | 12,663,000 | 276,361 | 110,650 | 165,711 | 21.5 | 8.6 | 12.9 | 2.98 | |
| 1972 | 13,067,000 | 271,960 | 110,191 | 161,769 | 20.6 | 8.4 | 12.2 | 2.74 | |
| 1973 | 13,303,000 | 255,848 | 111,336 | 144,512 | 19.1 | 8.3 | 10.8 | 2.49 | |
| 1974 | 13,504,000 | 243,658 | 110,179 | 133,479 | 17.9 | 8.1 | 9.8 | 2.32 | |
| 1975 | 13,722,000 | 239,794 | 114,501 | 125,293 | 17.4 | 8.3 | 9.1 | 2.15 | |
| 1976 | 13,892,000 | 231,135 | 110,610 | 120,525 | 16.6 | 7.9 | 8.7 | 2.06 | |
| 1977 | 14,033,000 | 226,954 | 111,490 | 115,464 | 16.1 | 7.9 | 8.2 | 2.01 | |
| 1978 | 14,192,000 | 226,359 | 108,059 | 118,300 | 15.9 | 7.6 | 8.3 | 1.95 | |
| 1979 | 14,359,000 | 223,370 | 108,315 | 115,055 | 15.5 | 7.5 | 8.0 | 1.91 | |
| 1980 | 14,515,000 | 223,664 | 106,654 | 117,010 | 15.3 | 7.3 | 8.0 | 1.89 | |
| 1981 | 14,695,000 | 230,920 | 109,429 | 121,491 | 15.6 | 7.4 | 8.2 | 1.94 | |
| 1982 | 14,923,000 | 237,076 | 110,990 | 116,086 | 15.7 | 7.4 | 8.3 | 1.93 | 128,100 |
| 1983 | 15,184,000 | 241,764 | 112,918 | 128,846 | 15.8 | 7.4 | 8.4 | 1.92 | 73,300 |
| 1984 | 15,393,000 | 240,544 | 110,887 | 129,657 | 15.5 | 7.2 | 8.3 | 1.84 | 49,100 |
| 1985 | 15,579,000 | 241,814 | 114,197 | 127,617 | 15.4 | 7.3 | 8.1 | 1.92 | 73,800 |
| 1986 | 15,788,000 | 239,115 | 116,069 | 123,046 | 15.0 | 7.3 | 7.7 | 1.87 | 100,500 |
| 1987 | 16,018,000 | 242,977 | 116,139 | 126,838 | 15.0 | 7.2 | 7.8 | 1.85 | 125,800 |
| 1988 | 16,263,000 | 246,200 | 120,463 | 125,737 | 15.0 | 7.3 | 7.7 | 1.83 | 149,400 |
| 1989 | 16,532,000 | 250,155 | 118,767 | 131,388 | 15.1 | 7.1 | 8.0 | 1.84 | 157,500 |
| 1990 | 16,814,000 | 257,521 | 125,112 | 132,409 | 15.3 | 7.4 | 7.9 | 1.90 | 124,700 |
| 1991 | 17,065,000 | 261,158 | 119,572 | 141,586 | 15.2 | 7.0 | 8.2 | 1.85 | 86,500 |
| 1992 | 17,284,000 | 259,186 | 120,836 | 138,350 | 14.9 | 6.9 | 8.0 | 1.89 | 68,600 |
| 1993 | 17,494,000 | 259,959 | 121,338 | 138,621 | 14.8 | 6.9 | 7.9 | 1.86 | 30,100 |
| 1994 | 17,667,000 | 258,314 | 123,496 | 134,818 | 14.5 | 7.0 | 7.5 | 1.84 | 46,600 |
| 1995 | 17,854,000 | 258,210 | 126,232 | 131,978 | 14.4 | 7.0 | 7.4 | 1.82 | 80,200 |
| 1996 | 18,071,000 | 250,438 | 126,400 | 124,038 | 13.8 | 6.9 | 6.9 | 1.80 | 104,000 |
| 1997 | 18,310,000 | 253,660 | 127,298 | 126,362 | 13.7 | 6.9 | 6.8 | 1.78 | 87,200 |
| 1998 | 18,517,000 | 249,105 | 129,255 | 119,850 | 13.4 | 6.9 | 6.5 | 1.75 | 79,100 |
| 1999 | 18,711,000 | 249,965 | 128,278 | 121,487 | 13.3 | 6.8 | 6.5 | 1.75 | 96,500 |
| 2000 | 18,925,000 | 249,310 | 128,392 | 120,918 | 13.1 | 6.7 | 6.4 | 1.75 | 107,200 |
| 2001 | 19,153,000 | 247,500 | 128,913 | 118,587 | 12.8 | 6.7 | 6.1 | 1.73 | 135,700 |
| 2002 | 19,413,000 | 250,988 | 133,707 | 117,281 | 12.9 | 6.9 | 6.0 | 1.77 | 110,600 |
| 2003 | 19,651,000 | 246,663 | 132,239 | 114,424 | 12.5 | 6.7 | 5.8 | 1.75 | 116,500 |
| 2004 | 19,895,000 | 249,082 | 133,231 | 115,851 | 12.4 | 6.7 | 5.7 | 1.76 | 100,000 |
| 2005 | 20,127,000 | 255,934 | 131,354 | 124,580 | 12.6 | 6.5 | 6.1 | 1.79 | 123,800 |
| 2006 | 20,394,000 | 263,540 | 134,041 | 129,499 | 12.8 | 6.5 | 6.3 | 1.82 | 146,700 |
| 2007 | 20,697,000 | 274,330 | 134,785 | 139,545 | 13.2 | 6.4 | 6.8 | 1.87 | 232,700 |
| 2008 | 21,015,000 | 302,272 | 143,946 | 158,326 | 14.4 | 6.8 | 7.6 | 2.02 | 277,400 |
| 2009 | 21,262,000 | 295,700 | 140,760 | 154,940 | 13.9 | 6.6 | 7.3 | 1.90 | 299,800 |
| 2010 | 22,183,000 | 297,900 | 143,473 | 154,427 | 13.4 | 6.4 | 7.0 | 1.89 | 172,038 |
| 2011 | 22,340,000 | 301,617 | 146,932 | 156,050 | 13.5 | 6.6 | 6.9 | 1.92 | 205,679 |
| 2012 | 22,723,000 | 309,582 | 147,098 | 161,782 | 13.6 | 6.5 | 7.1 | 1.91 | 241,151 |
| 2013 | 23,162,000 | 308,065 | 147,708 | 160,357 | 13.3 | 6.4 | 6.9 | 1.88 | 235,797 |
| 2014 | 23,413,000 | 299,697 | 153,400 | 146,300 | 12.8 | 6.5 | 6.3 | 1.8 | 179,000 |
| 2015 | 23,858,000 | 305,377 | 159,052 | 146,325 | 12.8 | 6.7 | 6.1 | 1.81 | 181,000 |
| 2016[66] | 24,385,600 | 311,104 | 158,504 | 152,600 | 12.9 | 6.5 | 6.4 | 1.789 | 243,800 |
| 2017 | 24,770,700[67] | 309,142 | 160,909 | 148,233 | 12.6 | 6.5 | 6.1 | 1.741 | 241,700 |
| 2018 | 25,180,200[68] | 315,147[69] | 158,493 | 156,654 | 12.6 | 6.5 | 6.1 | 1.741 | 248,400 |
In 2012, the total fertility rate of Australian-born women was 1.94, while for overseas-born women, it was 1.81,[70] while in 2013, it was 1.91 and 1.79 respectively.[71] In 2017, TFR was 1.68 for overseas women (overseas father 1.73) and 1.78 for native women (native father 1.69).
Life expectancy at birth from 1921 to 2015
Sources: Our World In Data and the United Nations.
1921–1950
| Years | 1921 | 1922 | 1923 | 1924 | 1925 | 1926 | 1927 | 1928 | 1929 | 1930[72] |
|---|---|---|---|---|---|---|---|---|---|---|
| Life expectancy in Australia | 61.0 | 62.9 | 61.7 | 62.5 | 63.2 | 62.9 | 62.8 | 62.9 | 63.1 | 64.9 |
| Years | 1931 | 1932 | 1933 | 1934 | 1935 | 1936 | 1937 | 1938 | 1939 | 1940[72] |
|---|---|---|---|---|---|---|---|---|---|---|
| Life expectancy in Australia | 65.3 | 65.6 | 65.4 | 64.8 | 65.1 | 65.2 | 65.8 | 65.8 | 65.8 | 66.2 |
| Years | 1941 | 1942 | 1943 | 1944 | 1945 | 1946 | 1947 | 1948 | 1949 | 1950[72] |
|---|---|---|---|---|---|---|---|---|---|---|
| Life expectancy in Australia | 66.1 | 65.9 | 66.4 | 68.0 | 68.5 | 68.0 | 68.6 | 68.5 | 69.1 | 69.0 |
1950–2015
| Period | Life expectancy in Years |
Period | Life expectancy in Years |
|---|---|---|---|
| 1950–1955 | 69.4 | 1985–1990 | 76.2 |
| 1955–1960 | 70.4 | 1990–1995 | 77.7 |
| 1960–1965 | 70.9 | 1995–2000 | 78.8 |
| 1965–1970 | 70.8 | 2000–2005 | 80.3 |
| 1970–1975 | 71.8 | 2005–2010 | 81.5 |
| 1975–1980 | 73.6 | 2010–2015 | 82.3 |
| 1980–1985 | 75.1 |
Source: UN World Population Prospects[73]
Other general demographic statistics
As of February 2018, the population growth rate was 0.9%.[74] This rate was based on estimates of (April 2019):[1]
- one birth every 1 minute and 41 seconds,
- one death every 3 minutes and 20 seconds,
- one migrant person arriving to live in Australia every 56 seconds,
- one Australian resident leaving Australia to live overseas every 1 minute and 53 seconds, leading to
- an overall total population increase of one person every 1 minute and 13 seconds.
Much of the data that follows has been derived from the CIA World Factbook[65] and the Australian Bureau of Statistics, through censuses.
Population

The following figures are ABS estimates for the resident population of Australia, based on the 2001 and 2006 Censuses and other data.
- 25,686,900 (as of 23 April 2020)[1]
- 23,470,145 (July 2018 est.)
- 23,232,413 (July 2017 est.)
- 21,262,641 (July 2009 – CIA World Factbook)
Age structure

- 0-14 years: 17.75% (male 2,138,080 /female 2,027,583)
- 15-24 years: 12.62% (male 1,520,528 /female 1,442,461)
- 25-54 years: 41.35% (male 4,944,587 /female 4,760,752)
- 55-64 years: 11.84% (male 1,379,681 /female 1,398,177)
- 65 years and over: 16.44% (male 1,786,595 /female 2,071,701) (2018 est.)
- 0–14 years: 17.8% (male 2,122,139/female 2,012,670)
- 15–24 years: 12.79% (male 1,524,368/female 1,446,663)
- 25–54 years: 41.45% (male 4,903,130/female 4,725,976)
- 55–64 years: 11.83% (male 1,363,331/female 1,384,036)
- 65 years and over: 16.14% (male 1,736,951/female 2,013,149) (2017 est.)
Median age
- total: 38.8 years. Country comparison to the world: 58th
- male: 38.1 years
- female: 39.7 years (2018 est.)
- Total: 36.9 years[76]
- Male: 36.6 years
- Female: 38.1 years (2009 est.)
Birth rate
- 12 births/1,000 population (2018 est.) Country comparison to the world: 165th
- 12.1 births/1,000 population (2017 est.)
- 12.47 births/1,000 population (2009 est.) (Rank 164)
Death rate
- 7.3 deaths/1,000 population (2018 est.) Country comparison to the world: 118th
- 6.68 deaths/1,000 population (2009 est.) (Rank 146)
Total fertility rate
- 1.77 children born/woman (2018 est.) Country comparison to the world: 155th
Net migration rate
- 5.4 migrant(s)/1,000 population (2018 est.) Country comparison to the world: 22nd
- 5.5 migrant(s)/1,000 population (2017 est.) (Rank 21)
- 6.23 migrant(s)/1,000 population. (2009 est.) (Rank 15)
Population growth rate
- 1.01% (2018 est.) Country comparison to the world: 107th
- 1.03% (2017 est.)
Mother's mean age at first birth
- 28.7 years (2014 est.)
Life expectancy at birth
- total population: 82.4 years (2018 est.)
- male: 79.9 years (2018 est.)
- female: 85 years (2018 est.)
At the time of Australian Federation in 1901, the rate of natural increase was 14.9 persons per 1,000 population. The rate increased to a peak of 17.4 per thousand population in the years 1912, 1913 and 1914. During the Great Depression, the rate declined to a low of 7.1 per thousand population in 1934 and 1935. Immediately after World War II, the rate increased sharply as a result of the start of the post–World War II baby boom and the immigration of many young people who then had children in Australia. A rate plateau of over 13.0 persons per 1,000 population occurred for every year from 1946 to 1962.
There has been a fall in the rate of natural increase since 1962 due to falling fertility. In 1971, the rate of natural increase was 12.7 persons per 1,000 population; a decade later it had fallen to 8.5. In 1996 the rate of natural increase fell below seven for the first time, with the downward trend continuing in the late 1990s. Population projections by the Australian Bureau of Statistics indicate that continued low fertility, combined with the increase in deaths from an ageing population, will result in natural increase falling below zero sometime in the mid-2030s. However, in 2006 the fertility rate rose to 1.81, one of the highest rates in the OECD.
Since 1901, the crude death rate has fallen from about 12.2 deaths per 1,000 population, to 6.4 deaths per 1,000 population in 2006.[77]
Urbanisation
- urban population: 86% of total population (2018)
- rate of urbanization: 1.43% annual rate of change (2015-20 est.)
- Urbanisation population: 89% of total population (2008)
- Rate of urbanisation: 1.2% annual rate of change (2005–2010)
Sex ratio
- At birth: 1.06 male(s)/female
- Under 15 years: 1.05 male(s)/female
- 15–64 years: 1.03 male(s)/female
- 65 years and over: 0.84 male(s)/female
- Total population: 1 male(s)/female (2009)
Dependency ratios
- total dependency ratio: 51.1
- youth dependency ratio: 28.5
- elderly dependency ratio: 22.6
- potential support ratio: 4.4 (2015 est.)
HIV/AIDS
- Adult prevalence rate: 0.1% (2017 est.)
- People living with HIV/AIDS: 26,000 (2017 est.)
- Deaths: fewer than 200 (2017 est.)[78]
School life expectancy (primary to tertiary education)
- total: 23 years
- male: 23 years
- female: 23 years (2016)
Unemployment, youth ages 15-24
- total: 12.6%. Country comparison to the world: 105th
- male: 13.7%
- female: 11.5% (2017 est.)
Incarceration and punishment
In March 2019, there was 43,320 adults imprisoned in Australia, which was an incarceration rate of 221 prisoners per 100,000 adult population.[79], or 169 per 100,000 total population.[80] Additionally, there was 75,544 people in community corrections (various non-custodial punishments such as parole, bail, probation and community service).[81]
In June 2018, there was about 980 minors imprisoned in Australia on an average night.[82]
Literacy
- Definition: aged 15 years and over can read and write
- Total population: 99%
- Male: 99%
- Female: 99% (2003 est.)
As of 2016, Indian Australians were the highest educated migrant group in Australia with 54.6% of Indians in Australia having a bachelor's or higher degree, more than three times Australia's national average of 17.2% in 2011.[83]
Education expenditure
- 4.9% of GDP (2013)
- country comparison to the world: 55
See also
- General
- Aging of Australia
- Health care in Australia
- List of most common surnames in Oceania
- List of cities in Australia
- List of population demographics of New South Wales by local government area
- Homelessness in Australia
- Cities
- Demographics of Sydney
- Demographics of Melbourne
- Demographics of Brisbane
- Demographics of Canberra
Notes
- Only countries with 100,000 or more are listed here.
- The Australian Bureau of Statistics source lists England, Scotland, Wales and Northern Ireland separately although they are all part of the United Kingdom. These should not be combined as they are not combined in the source.
- In accordance with the Australian Bureau of Statistics source, Mainland China, Taiwan and the Special Administrative Regions of Hong Kong and Macau are listed separately.
- The Australian Bureau of Statistics source lists England and Scotland separately although they are both part of the United Kingdom. These should not be combined as they are not combined in the source.
- In accordance with the Australian Bureau of Statistics source, Mainland China, Taiwan and the Special Administrative Regions of Hong Kong and Macau are listed separately.
- In fertility rates, 2.1 and above is a stable population and has been marked blue, 2 and below leads to an aging population and the result is that the population decreases.
- As a percentage of 21,769,209 persons who nominated their ancestry at the 2016 census. The Australian Census collects information on ancestry, but not on race or ethnicity.
- The Australian Bureau of Statistics has stated that most who nominate "Australian" as their ancestry are part of the Anglo-Celtic group.[15]
- Of any ancestry. Includes those identifying as Aboriginal Australians or Torres Strait Islanders. Indigenous identification is separate to the ancestry question on the Australian Census and persons identifying as Aboriginal or Torres Strait Islander may identify any ancestry.
- Includes those identifying as Aboriginal Australians or Torres Strait Islanders. Indigenous identification is separate to the ancestry question on the Australian Census and persons identifying as Aboriginal or Torres Strait Islander may identify any ancestry.
References
Citations
- "Population clock". Australian Bureau of Statistics website. Commonwealth of Australia. Retrieved 25 October 2019. The population estimate shown is automatically calculated daily at 00:00 UTC and is based on data obtained from the population clock on the date shown in the citation.
- Statistics, c=AU; o=Commonwealth of Australia; ou=Australian Bureau of. "Main Features – Main Features". www.abs.gov.au. Retrieved 28 December 2015.
- Heath, Michael. "Aussie Beer Drinking Market Goes Flat, Slumping to 65-Year Low". Bloomberg. Retrieved 11 September 2013.
- Xinhua (14 December 2010). "Australia's population to hit 28 million by 2031: report". People's Daily Online. Archived from the original on 3 June 2012. Retrieved 24 April 2013.
- Phillips, Janet; Simon-Davies, Joanne. "Migration—Australian migration flows and population". Australian Parliamentary Library. Retrieved 21 April 2019.
- "Data – Australia". The World Bank. The World Bank Group. 2013. Retrieved 24 April 2013.
- "3302.0.55.001 – Life Tables, States, Territories and Australia, 2015–2017". Australian Bureau of Statistics. Retrieved 21 April 2019.
- "The Beach". Australian Government: Culture Portal. Department of the Environment, Water, Heritage and the Arts, Commonwealth of Australia. 17 March 2008. Archived from the original on 26 February 2010.
- https://www.abs.gov.au/ausstats/abs@.nsf/0/B7616AB91C66CDCFCA25827800183B7B?Opendocument
- Weule, Genelle; Felicity James (20 July 2017). "Indigenous rock shelter in Top End pushes Australia's human history back to 65,000 years". Nature. Abc.net.au. 547 (7663): 306–310. doi:10.1038/nature22968. hdl:2440/107043. PMID 28726833. Retrieved 27 September 2017.
- "When did Australia's earliest inhabitants arrive?". University of Wollongong. 17 September 2004. Archived from the original on 21 June 2009. Retrieved 3 January 2009.
- "Aboriginal and Torres Strait Islander Population". 1301.0 – Year Book Australia, 2008. Australian Bureau of Statistics. 7 February 2008. Retrieved 3 January 2009.
- Statistics, c=AU; o=Commonwealth of Australia; ou=Australian Bureau of (28 June 2017). "Main Features - Cultural Diversity Article". www.abs.gov.au.
- "2016 Census Community Profiles: Australia". quickstats.censusdata.abs.gov.au.
- Statistics, c=AU; o=Commonwealth of Australia; ou=Australian Bureau of. "Feature Article - Ethnic and Cultural Diversity in Australia (Feature Article)". www.abs.gov.au.
- "Aboriginal and Torres Strait Islander Population". Australian Bureau of Statistics. 27 June 2017. Retrieved 27 June 2017.
- Statistics, c=AU; o=Commonwealth of Australia; ou=Australian Bureau of (3 April 2019). "Main Features - Australia's Population by Country of Birth". www.abs.gov.au.
- "3105.0.65.001—Australian Historical Population Statistics, 2006" (XLS). Australian Bureau of Statistics. 23 May 2006. Archived from the original on 8 September 2007. Retrieved 18 September 2007.
Australian population: (1919) 5,080,912; (2006) 20,209,993
- United Nations, Department of Economic and Social Affairs, Population Division, (2015). 'International Migration' in International migrant stock 2015. Accessed from International migrant stock 2015: maps on 24 May 2017
- "Fact Sheet 20 – Migration Program Planning Levels". Department of Immigration and Citizenship. 11 August 2009. Archived from the original on 7 May 2010. Retrieved 17 June 2010.
- "3412.0 - Migration, Australia, 2016-17". Australian Bureau of Statistics. 24 October 2018. Archived from the original on 9 February 2019.
- "Religion in Australia, 2016". Australian Bureau of Statistics. 28 June 2017. Retrieved 31 January 2018.
- Pettersson, Thorleif; Esmer, Yilmaz R. (2008). Changing Values, Persisting Cultures: Case Studies in Value Change. Brill. p. 21. ISBN 978-9004162341.
- Australian Political Facts. Longman Chesire. 1990. p. 122. ISBN 9780582712584.
- "Census of Population and Housing: Reflecting Australia - Stories from the Census, 2016 : Religion in Australia". Australian Bureau of Statistics. Archived from the original on 10 July 2017. Retrieved 27 June 2017.
- "Cultural diversity in Australia". 2071.0 – Reflecting a Nation: Stories from the 2011 Census, 2012–2013. Australian Bureau of Statistics. 21 June 2012. Archived from the original on 25 April 2016. Retrieved 27 June 2012.
- "NCLS releases latest estimates of church attendance" (Media release). NCLS Research. NCLS Research. 28 February 2012. Retrieved 24 April 2013.
- "Pluralist Nations: Pluralist Language Policies?". 1995 Global Cultural Diversity Conference Proceedings, Sydney. Department of Immigration and Citizenship. Archived from the original on 20 December 2008. Retrieved 11 January 2009.
English has no de jure status but it is so entrenched as the common language that it is de facto the official language as well as the national language.
- Moore, Bruce. "The Vocabulary Of Australian English" (PDF). National Museum of Australia. Archived from the original (PDF) on 20 March 2011. Retrieved 5 April 2010.
- "The Macquarie Dictionary", Fourth Edition. The Macquarie Library Pty Ltd, 2005.
- "2071.0 - Census of Population and Housing: Reflecting Australia - Stories from the Census, 2016". Abs.gov.au. Archived from the original on 2 September 2017. Retrieved 27 September 2017.
- Hindi is the top Indian language spoken in Australia, SBS, 26 October 2018.
- "A mission to save indigenous languages". Australian Geographic. Archived from the original on 24 December 2013. Retrieved 18 March 2016.
- "National Indigenous Languages Survey Report 2005". Department of Communications, Information Technology and the Arts. Archived from the original (PDF) on 9 July 2009. Retrieved 5 September 2009.
- "4713.0 – Population Characteristics, Aboriginal and Torres Strait Islander Australians, 2006". Australian Bureau of Statistics. Canberra: Australian Bureau of Statistics. 4 May 2010. Retrieved 7 December 2010.
- Australian Bureau of Statistics (27 June 2007). "20680-Language Spoken at Home (full classification list) by Sex – Australia". 2006 Census Tables : Australia. Canberra: Australian Bureau of Statistics. Archived from the original on 3 July 2009. Retrieved 7 December 2010.
- Australian Bureau of Statistics (31 October 2012). "2011 Community Profiles: Aboriginal and Torres Strait Islander Peoples (Indigenous) Profile". 2011 Census of Population and Housing. Retrieved 9 October 2013.

- Australian Bureau of Statistics (27 June 2017). "New South Wales". 2016 Census QuickStats. Retrieved 2 July 2017.
- Australian Bureau of Statistics (27 June 2017). "Victoria". 2016 Census QuickStats. Retrieved 2 July 2017.
- Australian Bureau of Statistics (27 June 2017). "Queensland". 2016 Census QuickStats. Retrieved 2 July 2017.
- Australian Bureau of Statistics (31 October 2012). "Western Australia". 2011 Census QuickStats. Retrieved 12 February 2013.
- Australian Bureau of Statistics (27 June 2017). "South Australia". 2016 Census QuickStats. Retrieved 2 July 2017.
- Australian Bureau of Statistics (27 June 2017). "Tasmania". 2016 Census QuickStats. Retrieved 2 July 2017.
- Australian Bureau of Statistics (27 June 2017). "Australian Capital Territory". 2016 Census QuickStats. Retrieved 2 July 2017.
- Australian Bureau of Statistics (27 June 2017). "Northern Territory". 2016 Census QuickStats. Retrieved 2 July 2017.
- "Aboriginal and Torres Strait Islander population". 1301.0 – Year Book Australia, 2002. Australian Bureau of Statistics. 20 August 2007. Retrieved 21 October 2009.
- Briscoe, Gordon; Smith, Len (2002). The Aboriginal Population Revisited: 70,000 years to the present. Canberra, Australia: Aboriginal History Inc. p. 12. ISBN 978-0-9585637-6-5.
- "TABLE 1.1. Population by sex, states and territories, 31 December 1788 onwards". 23 May 2014. Retrieved 8 July 2019.
- "TABLE 1.2. Population by sex, states and territories, 30 June 1901 onwards". Australian Bureau of Statistics. 23 May 2014. Retrieved 8 July 2019.
- Australian Bureau of Statistics (9 March 2006). "Australia". 2001 Census QuickStats. Retrieved 24 January 2016.
- Australian Bureau of Statistics (25 October 2007). "Australia". 2006 Census QuickStats. Retrieved 24 January 2016.
- Australian Bureau of Statistics (31 October 2012). "Australia". 2011 Census QuickStats. Retrieved 24 January 2016.
- Australian Bureau of Statistics (27 June 2017). "Australia". 2016 Census QuickStats. Retrieved 13 July 2017.
- Max Roser (2014), "Total Fertility Rate around the world over the last centuries", Our World In Data, Gapminder Foundation
- Australian Bureau of Statistics (23 May 2006). "3105.0.65.001 - Australian Historical Population Statistics, 2006.Table 42. Crude birth rates, states and territories, 1860 onwards".
- Australian Bureau of Statistics (5 August 2008). "3105.0.65.001 - Australian Historical Population Statistics, 2008 - 4. Population Age-Sex Structure - 4.1 Population, age and sex, Australia 30 June, 1901 onwards".
- Australian Bureau of Statistics (6 April 2006). "Population Characteristics: 20th century: beginning and end".
- Australian Bureau of Statistics (15 February 2016). "3101.0 - Australian Demographic Statistics, Jun 2015".
- .idcommunity. "Australia. Five year age groups".
- Australian Bureau of Statistics (15 March 2006). "4102.0 - Australian Social Trends, 1996".
- Australian Bureau of Statistics (5 August 2008). "3105.0.65.001 - Australian Historical Population Statistics, 2008. 4. Population Age-Sex Structure - 4.18. Median age by sex, states and territories, 30 June, 1971 onwards".
- "Developed countries database". ined.fr. Retrieved 10 July 2012.
- "Historical Migration Statistics". 25 July 2014. Archived from the original on 9 August 2014. Retrieved 27 July 2014.
- "3101.0 - Australian Demographic Statistics, Mar 2017". Abs.gov.au. Retrieved 27 September 2017.
- "World Factbook EUROPE : AUSTRALIA", The World Factbook, 12 July 2018
- "Population". Australian Bureau of Statistics. Retrieved 13 December 2017.
- "3101.0 - Australian Demographic Statistics, Dec 2017", Australian Bureau of Statistics
- "3101.0 - Australian Demographic Statistics, Dec 2018", Australian Bureau of Statistics, December 2018
- "3302.0 - Deaths, 2018", Australian Bureau of Statistics, December 2018
- "3301.0 Births, Australia, 2012" (XL file). Australian Bureau of Statistics. 11 July 2014. Retrieved 19 December 2014.
- "3301.0 Births, Australia, 2013" (XL file). Australian Bureau of Statistics. 23 October 2014. Retrieved 19 December 2014.
- "Life expectancy". Our World in Data. Retrieved 28 August 2018.
- "World Population Prospects – Population Division – United Nations". United Nations, Population Division. 2019. Retrieved 10 July 2019.
- "3101.0 – Australian Demographic Statistics, Dec 2017". Australian Bureau of Statistics. 21 June 2016. Retrieved 22 July 2018.
- "Animated Population Pyramids". Australian Bureau of Statistics. ABS. 17 December 2012. Retrieved 24 April 2013.
- "3201.0 – Population by Age and Sex, Australian States and Territories, Jun 2010". Australian Bureau of Statistics. 21 December 2010. Retrieved 5 June 2016.
- "Population Size and Growth". 1301.0 – Year Book Australia, 2008. Australian Bureau of Statistics. 7 February 2008. Retrieved 3 January 2009.
- "AUSTRALIA-OCEANIA :: AUSTRALIA". CIA – The World Factbook. Central Intelligence Agency. 2 July 2019. Retrieved 8 July 2019.
- "4512.0 - Corrective Services, Australia, March quarter 2019". www.abs.gov.au. Australian Bureau of Statistics. Retrieved 8 July 2019.
- "Highest to Lowest - Prison Incarceration Rate". World Prison Brief. Retrieved 8 July 2019.
- "4512.0 - Corrective Services, Australia, March quarter 2019 - Summary of findings". www.abs.gov.au. Australian Bureau of Statistics. Retrieved 8 July 2019.
- Youth detention population in Australia 2018. www.aihw.gov.au (Report). Australian Institute of Health and Welfare. 19 December 2018. p. 24. ISBN 978-1-76054-470-6. ISSN 2205-5010. Retrieved 8 July 2019.
- "Indians found to be Australia's most highly educated migrants - Interstaff Migration". 19 August 2016.
- "3218.0 – Regional Population Growth, Australia, 2016". Australian Bureau of Statistics. Retrieved 21 April 2019.
- "Population density (people per sq. km of land area)". World Bank Open Data. The World Bank. Retrieved 21 April 2019.
Sources
- General references

Further reading
- Jupp, James. The Australian People: An Encyclopedia of the Nation, its People and their Origins (2002)
- O'Farrell, Patrick. The Irish in Australia: 1798 to the Present Day (3rd ed. Cork University Press, 2001)
- Wells, Andrew, and Theresa Martinez, eds. Australia's Diverse Peoples: A Reference Sourcebook (ABC-CLIO, 2004)
External links
| Wikimedia Commons has media related to Demographics of Australia. |
- Australian Bureau of Statistics (ABS) Year Book Australia, 2009–10
- Australian population: ethnic origins (DOC)
- Build Australian population graph 1960 – 2013 (World Bank data)
- Build Australian population projection graph till 2100 (United Nation data)
- Build Australian life expectancy at birth graph 1950 – 2013 (United Nation data)
- Australia's population clock
Ancestral background of Australian citizens | |||
| Indigenous | |||
| Africa |
| ||
| Americas |
| ||
| Asia |
| ||
| Europe |
| ||
| Pacific Islands |
| ||