Virovitica-Podravina County
Virovitica-Podravina County (pronounced [ʋiroʋǐtit͡sa-pǒdraʋina]; Croatian: Virovitičko-podravska županija [ʋiroʋǐtit͡ʃko-pǒdraʋskaː ʒupǎnija]; Hungarian: Verőce-Drávamente megye) is a northern Slavonian county in Croatia. Its county seat is in Virovitica and it includes the area around the Drava river, hence the name Podravina. Other notable towns are Slatina and Orahovica.
Virovitica-Podravina County Virovitičko-podravska županija | |
|---|---|
 Flag  Coat of arms | |
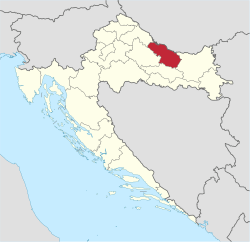 Virovitica-Podravina County within Croatia | |
| Country | Croatia |
| County seat | Virovitica |
| Government | |
| • Župan | Igor Andrović (HDZ) |
| Area | |
| • Total | 2,024 km2 (781 sq mi) |
| Population (2011)[2] | |
| • Total | 84,836 |
| • Density | 42/km2 (110/sq mi) |
| Area code | 033 |
| ISO 3166 code | HR-10 |
| HDI (2017) | 0.773[3] high · 21st |
| Website | http://www.vpz.hr/ |
Administrative division
Virovitica-Podravina County holds the following towns and districts:
Towns
| City / town | Population[2] | Area km2 | Website |
|---|---|---|---|
| Orahovica | 5,304 | 123.9 | orahovica.hr |
| Slatina | 13,686 | slatina.hr | |
| Virovitica | 21,291 | virovitica.hr | |
Municipalities
| Municipality | Population[2] | Area km2 | Website |
|---|---|---|---|
| Crnac | 1,456 | ||
| Čačinci | 2,802 | cacinci.hr | |
| Čađavica | 2,009 | slatina.hr | |
| Gradina | 3,850 | gradina.hr | |
| Lukač | 3,634 | ||
| Mikleuš | 1,464 | ||
| Nova Bukovica | 1,771 | ||
| Pitomača | 10,059 | pitomaca.hr | |
| Sopje | 2,320 | sopje.hr | |
| Suhopolje | 6,683 | suhopolje.hr | |
| Špišić Bukovica | 4,221 | ||
| Voćin | 2,382 | ||
| Zdenci | 1,904 | opcina-zdenci.hr | |
Demographics

Population pyramid of Virovitica-Podravina County per 2011 Census.
| Historical populations of Virovitica-Podravina County | |||||||||||||||||||||||||||||||||||||||||||||||||||||||
|---|---|---|---|---|---|---|---|---|---|---|---|---|---|---|---|---|---|---|---|---|---|---|---|---|---|---|---|---|---|---|---|---|---|---|---|---|---|---|---|---|---|---|---|---|---|---|---|---|---|---|---|---|---|---|---|
|
| ||||||||||||||||||||||||||||||||||||||||||||||||||||||
| Source: Naselja i stanovništvo Republike Hrvatske 1857–2001, Croatian Bureau of Statistics, Zagreb, 2005 | |||||||||||||||||||||||||||||||||||||||||||||||||||||||
As of the 2011 census, the county had 84,836 residents. The population density is 42 people per km².
Ethnic Croats form the majority with 91.8% of the population, followed by Serbs at 6.0%.[4]
References
- Ostroški, Ljiljana, ed. (December 2015). Statistički ljetopis Republike Hrvatske 2015 [Statistical Yearbook of the Republic of Croatia 2015] (PDF). Statistical Yearbook of the Republic of Croatia (in Croatian and English). 47. Zagreb: Croatian Bureau of Statistics. p. 62. ISSN 1333-3305. Retrieved 27 December 2015.
- "Population by Age and Sex, by Settlements, 2011 Census: County of Virovitica-Podravina". Census of Population, Households and Dwellings 2011. Zagreb: Croatian Bureau of Statistics. December 2012.
- "Sub-national HDI - Area Database - Global Data Lab". hdi.globaldatalab.org. Retrieved 2018-09-13.
- "Population by Ethnicity, by Towns/Municipalities, 2011 Census: County of Virovitica-Podravina". Census of Population, Households and Dwellings 2011. Zagreb: Croatian Bureau of Statistics. December 2012.
External links
- Official website

| Wikimedia Commons has media related to Virovitica-Podravina County. |
Subdivisions of Virovitica-Podravina County | ||
|---|---|---|
| Towns |
| Coat of arms of Virovitica-Podravina County |
| Municipalities | ||
This article is issued from Wikipedia. The text is licensed under Creative Commons - Attribution - Sharealike. Additional terms may apply for the media files.