US drug overdose death rates and totals over time
The US Centers for Disease Control and Prevention has data on drug overdose death rates and totals. 945,877 US residents died from drug overdoses from 1968 to 2018.[2] From 1999 to Feb 2019 over 770,000 people died from drug overdoses.[3] 21 people out of every 100,000 died from drug overdoses in 2018 in the US.[2]
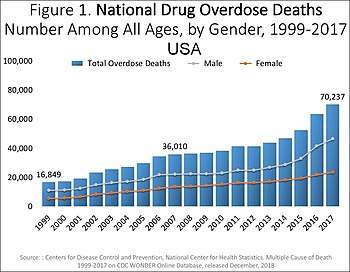
1968-2018 overdose death rates and totals
|
|
Overdose death rates by state. Map and timeline
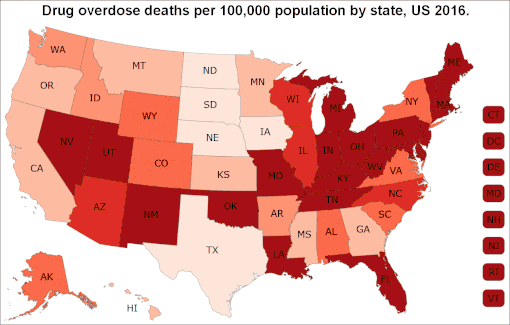
6.9–11 11.1–13.5 13.6–16.0 16.1–18.5 18.6–21.0 21.1–52.0 |
|
|
Overdose death totals by state. Timeline
|
|
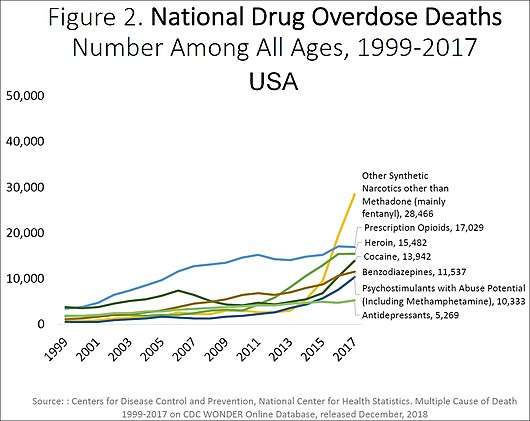
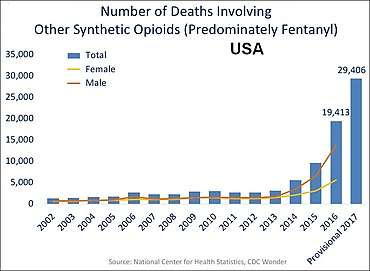
Overdose death rates and totals by drug
Concerning the 2017 data in the charts below (in this section and the following sections) deaths from the various drugs add up to more than 70,200 because multiple drugs are involved in many of the deaths.[1]
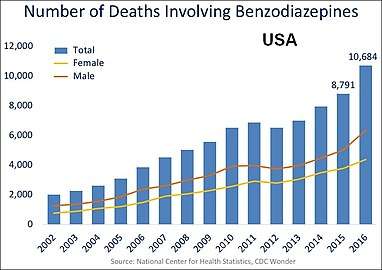 U.S. yearly overdose deaths involving benzodiazepines.[1]
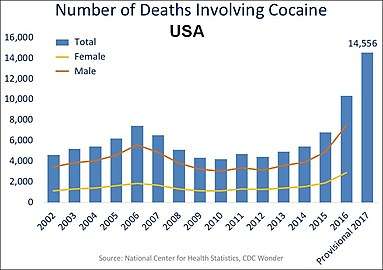
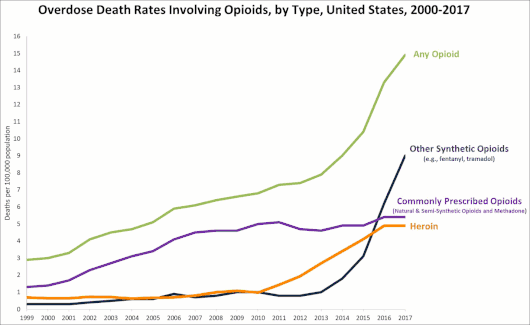
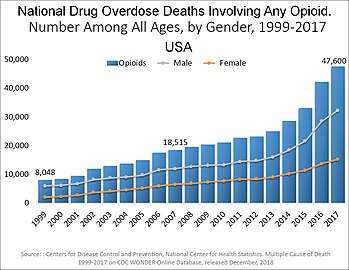
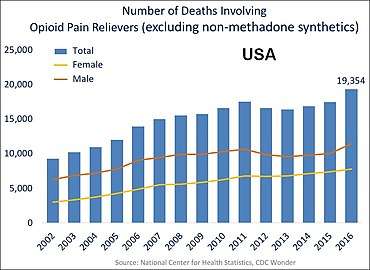
Opioid overdose death rates and totals
Of the 70,200 overdose deaths in the US in 2017, opioids were involved in 47,600.[1] This is an increase from 2016 where over 64,000 died from drug overdose, and opioids were involved in over 42,000.[8] In 2017, the five states with the highest rates of death due to drug overdose were West Virginia (57.8 per 100,000), Ohio (46.3 per 100,000), Pennsylvania (44.3 per 100,000), Kentucky (37.2 per 100,000), and New Hampshire (37.0 per 100,000).[6]
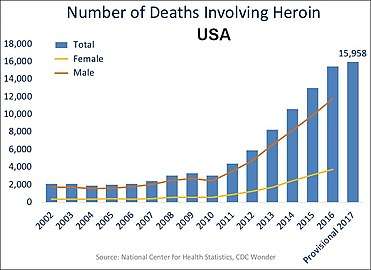 US yearly overdose deaths involving heroin.[1]
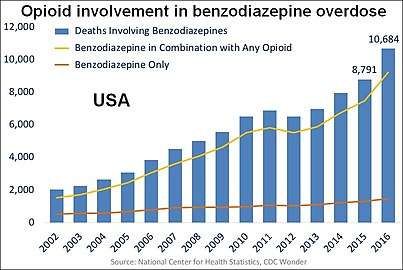 The top line represents the yearly number of benzodiazepine deaths that involved opioids in the US. The bottom line represents benzodiazepine deaths that did not involve opioids.[1]
 Opioid involvement in cocaine overdose deaths. Green line is cocaine and any opioid. Gray line is cocaine without any opioids. Yellow line is cocaine and other synthetic opioids.[1]
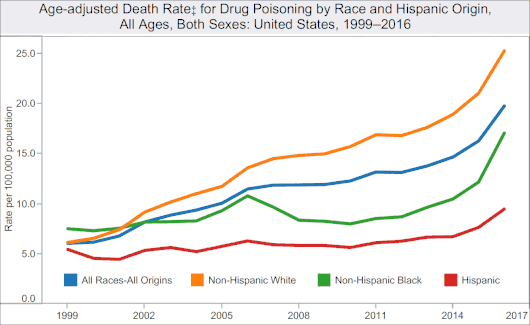
Overdose death rates by race and ethnicity
See also
References
- Overdose Death Rates. By National Institute on Drug Abuse (NIDA).
- Data is from these saved tables from CDC Wonder at the Centers for Disease Control and Prevention, National Center for Health Statistics:
- 1968-1978 data: Saved Request: Compressed Mortality, 1968-1978, D72F578. Compressed Mortality File 1968-1978. CDC WONDER Online Database, compiled from Compressed Mortality File CMF 1968-1988, Series 20, No. 2A, 2000. Accessed at http://wonder.cdc.gov/cmf-icd8.html on Jan 23, 2020.
- 1979-1998 data: Saved Request: Compressed Mortality, 1979-1998, D72F579. Compressed Mortality File 1979-1998. CDC WONDER On-line Database, compiled from Compressed Mortality File CMF 1968-1988, Series 20, No. 2A, 2000 and CMF 1989-1998, Series 20, No. 2E, 2003. Accessed at http://wonder.cdc.gov/cmf-icd9.html on Jan 23, 2020.
- 1999-2017 data: Saved Request: Multiple Cause of Death, 1999-2017, D72F580. Multiple Cause of Death 1999-2017 on CDC WONDER Online Database, released December, 2018. Data are from the Multiple Cause of Death Files, 1999-2017, as compiled from data provided by the 57 vital statistics jurisdictions through the Vital Statistics Cooperative Program. Accessed at http://wonder.cdc.gov/mcd-icd10.html on Jan 23, 2020.
- Scroll down the page and click on the dropdown data table called "Data Table for Figure 1a. 12 Month-ending Provisional Counts of Drug Overdose Deaths". The 2018 number is the "predicted value" for the 12 month period ending Jan 2019. That number changes as more info comes in.
- U.S. Census Bureau QuickFacts: United States. Has July 1, 2018 resident population.
- STATCAST - Week of September 9, 2019. NCHS Releases New Monthly Provisional Estimates on Drug Overdose Deaths. National Center for Health Statistics.
- National Center for Health Statistics. "Provisional Counts of Drug Overdose Deaths, as of 8/6/2017" (PDF). Centers for Disease Control and Prevention (CDC). Source lists US totals for 2015 and 2016 and statistics by state.
- Timeline bar chart with 2016 number of deaths in the US from opioids. Originally at Overdose Death Rates. By National Institute on Drug Abuse (NIDA)
- Drug Overdose Deaths. Centers for Disease Control and Prevention, National Center for Injury Prevention and Control. Click on a map year. The data table is below the map. Number of deaths for each state, and the age-adjusted rates of death for each state. Also, place cursor on map states to get data.
- Drug Overdose Mortality by State. Centers for Disease Control and Prevention, National Center for Health Statistics.
- National Center for Health Statistics. "Provisional Counts of Drug Overdose Deaths, as of 8/6/2017" (PDF). United States: Centers for Disease Control and Prevention. Source lists US totals for 2015 and 2016 and statistics by state.
- Opioid Data Analysis and Resources. Drug Overdose. CDC Injury Center. Centers for Disease Control and Prevention. Click on "Rising Rates" tab for a graph. See data table below the graph.
- Fentanyl. Image 4 of 17. US DEA (Drug Enforcement Administration).
- NCHS Data Visualization Gallery - Drug Poisoning Mortality. From National Center for Health Statistics. Open the dashboard dropdown menu and pick "U.S. Trends". From the menus on the right pick all races, all ages, and both sexes. Run your cursor over the graph to see the data.
Further reading
| Classification |
|---|
| Look up overdose in Wiktionary, the free dictionary. |
| Wikimedia Commons has media related to |
- Opioid Overdose Deaths by Race/Ethnicity. Kaiser Family Foundation.
- Opioid Overdose Deaths by Type of Opioid. Kaiser Family Foundation.
| General |  | ||||||||||||||||
|---|---|---|---|---|---|---|---|---|---|---|---|---|---|---|---|---|---|
| Combined substance use |
| ||||||||||||||||
| Alcohol |
| ||||||||||||||||
| Caffeine | |||||||||||||||||
| Cannabis |
| ||||||||||||||||
| Cocaine |
| ||||||||||||||||
| Hallucinogen | |||||||||||||||||
| Nicotine | |||||||||||||||||
| Opioids |
| ||||||||||||||||
| Sedative / hypnotic | |||||||||||||||||
| Stimulants | |||||||||||||||||
| Volatile solvent |
| ||||||||||||||||