Straits Times Index
The FTSE Straits Times Index (STI) is a capitalisation-weighted stock market index that is regarded as the benchmark index for the Singapore stock market. It tracks the performance of the top 30 companies listed on the Singapore Exchange. It is jointly calculated by Singapore Press Holdings (SPH), Singapore Exchange (SGX) and FTSE Group (FTSE).
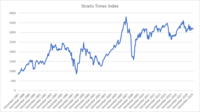 STI performance between 1987 and 2019 | |
| Foundation | 1966 |
|---|---|
| Operator |
|
| Exchanges | Singapore Exchange |
| Constituents | 30 |
| Type | Large cap |
| Market cap | S$288.8 billion (as of June 2018)[1] |
| Weighting method | Capitalization-weighted |
| Website | FTSE STI |
History
The STI has a history dating back to 1966.[1] Following a major sectoral re-classification of listed companies by the Singapore Exchange, which saw the removal of the "industrials" category, the STI replaced the Straits Times Industrials Index (STII) and began trading on 31 August 1998 at 885.26 points, in continuation of where the STII left off. At the time, it represented 78% of the average daily traded value over a 12-month period and 61.2% of total market capitalisation on the exchange.[2] The STI was constructed by SPH, the Singapore Exchange and SPH's consultant, Professor Tse Yiu Kuen from the Singapore Management University (formerly from the National University of Singapore). It came under formal review at least once annually and was also reviewed on an ad hoc basis when necessary.[2] One such review, for instance, raised the number of stocks from 45 to 50, which took effect when trading resumed on 18 March 2005. This change reduced the index representation of the average daily traded value to 60%, while increasing its total market capitalisation to 75%.
The STI was again revamped and relaunched on 10 January 2008. As part of a new partnership between SPH, SGX and FTSE, the number of constituent stocks was reduced from about 50 to 30 and the index was re-calculated using FTSE's methodology.[3][4] Besides the STI, the partners also developed a family of indices including the FTSE ST Dividend Index, FTSE ST China Top tradable index, FTSE ST Catalist Index and FTSE ST Maritime Index as well as 19 Supersector and 39 Sector indices. For the purposes of computing the indices, stocks are classified using the Industry Classification Benchmark (ICB).
The family tree of the FTSE ST Index Series:[1]
- FTSE ST All-Share Index
- Straits Times Index
- FTSE ST Mid Cap Index
- FTSE ST Small Cap Index
- FTSE ST China Index
- FTSE ST China Top Index
- FTSE ST Maritime Index
- FTSE ST All-Share Industry Indices (10)
- FTSE ST All-Share Supersector Indices (19)
- FTSE ST All-Share Sector Indices (39)
- FTSE ST Real Estate Index
- FTSE ST Real Estate Investment & Services Index
- FTSE ST Real Estate Investment Trusts Index
- FTSE ST All-Share Supersector Indices (19)
- FTSE ST Fledgling Index
The creation of the FTSE ST Index Series was intended to facilitate the creation of financial products such as institutional and retail funds, exchange-traded funds (ETFs), derivatives contracts and other index-linked products.[5] There are currently two ETFs listed on the SGX that track the STI: the SPDR Straits Times Index ETF (formerly known as the streetTRACKS Straits Times Index Fund) (managed by State Street Global Advisors) and the Nikko AM Singapore STI ETF .
Record values
| Category | All-Time Highs | |
|---|---|---|
| Closing | 3875.77 | Thursday, 11 October 2007[6][7] |
| Intraday | 3906.16 | Wednesday, 10 October 2007 |
Annual Returns
The following table shows the annual development of the S&P/TSX Composite Index, which was calculated back to 1970.[8][9][10]
| Year | Closing level | Change in index in points |
Change in index in % |
|---|---|---|---|
| 1970 | 139.06 | ||
| 1971 | 198.69 | 59.63 | 42.88 |
| 1972 | 432.73 | 234.04 | 117.79 |
| 1973 | 265.57 | −167.16 | −38.63 |
| 1974 | 150.82 | −114.75 | −43.21 |
| 1975 | 236.76 | 85.94 | 56.98 |
| 1976 | 254.81 | 18.05 | 7.62 |
| 1977 | 264.24 | 9.43 | 3.70 |
| 1978 | 349.16 | 84.92 | 32.14 |
| 1979 | 435.41 | 86.25 | 24.70 |
| 1980 | 660.82 | 225.41 | 51.77 |
| 1981 | 780.78 | 119.96 | 18.15 |
| 1982 | 732.32 | −48.46 | −6.21 |
| 1983 | 1,002.03 | 269.71 | 36.83 |
| 1984 | 812.61 | −189.42 | −18.90 |
| 1985 | 620.04 | −192.57 | −23.70 |
| 1986 | 891.30 | 271.26 | 43.75 |
| 1987 | 823.58 | −67.72 | −7.60 |
| 1988 | 1,038.62 | 215.04 | 26.11 |
| 1989 | 1,481.33 | 442.71 | 42.62 |
| 1990 | 1,154.48 | −326.85 | −22.06 |
| 1991 | 1,490.70 | 336.22 | 29.12 |
| 1992 | 1,524.40 | 33.70 | 2.26 |
| 1993 | 2,425.68 | 901.28 | 59.12 |
| 1994 | 2,239.56 | −186.12 | −7.67 |
| 1995 | 2,266.54 | 26.98 | 1.20 |
| 1996 | 2,216.79 | −49.75 | −2.19 |
| 1997 | 1,529.84 | −686.95 | −30.99 |
| 1998 | 1,392.73 | −137.11 | −8.96 |
| 1999 | 2,479.58 | 1,086.85 | 78.04 |
| 2000 | 1,926.83 | −552.75 | −22.29 |
| 2001 | 1,623.60 | −303.23 | −15.74 |
| 2002 | 1,341.03 | −282.57 | −17.40 |
| 2003 | 1,764.52 | 423.49 | 31.58 |
| 2004 | 2,066.14 | 301.62 | 17.09 |
| 2005 | 2,347.34 | 281.20 | 13.61 |
| 2006 | 2,985.83 | 638.49 | 27.20 |
| 2007 | 3,482.30 | 496.47 | 16.63 |
| 2008 | 1,761.56 | −1,720.74 | −49.41 |
| 2009 | 2,897.62 | 1,136.06 | 64.49 |
| 2010 | 3,190.04 | 292.42 | 10.09 |
| 2011 | 2,646.35 | −543.69 | −17.04 |
| 2012 | 3,167.08 | 520.73 | 19.68 |
| 2013 | 3,167.43 | 0.35 | 0.01 |
| 2014 | 3,365.15 | 197.72 | 6.24 |
| 2015 | 2,882.73 | −482.42 | −14.34 |
| 2016 | 2,880.76 | −1.97 | −0.07 |
| 2017 | 3,402.92 | 522.16 | 18.13 |
| 2018 | 3,068.76 | −334.16 | −9.82 |
| 2019 | 3,222.83 | 154.07 | 5.02 |
Constituents
The 30 constituents of the STI as of 23 June 2020 are:[11]
| Stock Symbol | Company |
|---|---|
| SGX: A17U | Ascendas Real Estate Investment Trust |
| SGX: C61U | CapitaCom Trust |
| SGX: C31 | CapitaLand |
| SGX: C38U | CapitaMall Trust |
| SGX: C09 | City Developments Limited |
| SGX: C52 | ComfortDelGro Corporation |
| SGX: D01 | Dairy Farm International Holdings |
| SGX: D05 | DBS Group Holdings |
| SGX: G13 | Genting Singapore PLC |
| SGX: H78 | Hongkong Land Holdings |
| SGX: C07 | Jardine Cycle & Carriage |
| SGX: J36 | Jardine Matheson Holdings Limited |
| SGX: J37 | Jardine Strategic Holdings Ltd |
| SGX: BN4 | Keppel Corporation |
| SGX: N2IU | Mapletree Commercial Trust |
| SGX: ME8U | Mapletree Industrial Trust |
| SGX: M44U | Mapletree Logistics Trust |
| SGX: O39 | Oversea-Chinese Banking Corp |
| SGX: S58 | SATS |
| SGX: U96 | Sembcorp Industries |
| SGX: C6L | Singapore Airlines |
| SGX: Z74 | Singtel |
| SGX: S68 | Singapore Exchange |
| SGX: S63 | Singapore Technologies Engineering |
| SGX: Y92 | Thai Beverages |
| SGX: U11 | United Overseas Bank |
| SGX: U14 | UOL Group |
| SGX: V03 | Venture Corporation |
| SGX: BS6 | Yangzijiang Shipbuilding Holdings |
| SGX: F34 | Wilmar International |
References
- "Straits Times Index Factsheet". FTSE. Archived from the original (PDF) on 4 November 2016. Retrieved 31 March 2014.
- "The STI Index". The Business Times. Archived from the original on 23 July 2011. Retrieved 28 February 2011.
- "SPH, SGX and FTSE launch revamped Straits Times Index and new FTSE ST Index Series today". The Straits Times. 10 January 2008. Archived from the original on 13 November 2010. Retrieved 22 September 2019.
- "Straits Times Index (STI)". The Straits Times. Archived from the original on 12 November 2010. Retrieved 28 February 2011.
- "FTSE ST Index Series". FTSE. Archived from the original on 26 October 2009.
- "Shares surge to a new high". Today. 12 October 2007. Retrieved 16 August 2019.
- "STI closes 3.05% lower". Asiaone. 16 January 2008. Retrieved 16 August 2019.
- Manual of Securities Statistics, Nomura Research Institute, Tokio 1997
- "Historical data: Straits Times Index - Singapore (^STI)".
- "STI Index (^STI?P=^STI) Historical Data - Yahoo Finance". finance.yahoo.com. Retrieved 21 January 2020.
- "Market Information". Singapore Exchange. Retrieved 23 June 2020.
External links
- Reuters page for .FTSTI
- Bloomberg page for FSSTI:IND
- A detailed list of the STI index components with description of each company, logo and link to its website can be found on ASEAN UP Top 30 companies from Singapore’s STI
- Performance of STI index and its 30 components for the period of 1 week, 1 month, 3 months, YTD, 1 year, 3 years.
| Current |
|
|---|---|
| Previous |
|
correct as of 23 June 2020 | |