Nikkei 225
The Nikkei 225 (日経平均株価, Nikkei heikin kabuka), more commonly called the Nikkei, the Nikkei index, or the Nikkei Stock Average[1][2] (/ˈnɪkeɪ, ˈniː-, nɪˈkeɪ/), is a stock market index for the Tokyo Stock Exchange (TSE). It has been calculated daily by the Nihon Keizai Shinbun (The Nikkei) newspaper since 1950. It is a price-weighted index, operating in the Japanese Yen (JP¥), and its components are reviewed once a year. The Nikkei measures the performance of 225 large, publicly owned companies in Japan from a wide array of industry sectors. [3]
 | |
| Foundation | 7 September 1950 |
|---|---|
| Operator | Nihon Keizai Shinbun (The Nikkei) (Nikkei, Inc.) |
| Exchanges | Tokyo Stock Exchange (TSE) |
| Constituents | 225 |
| Weighting method | Price-weighted index |
| Related indices | Tokyo Stock Price Index (TOPIX) |
| Website | Nikkei 225 |
The Nikkei 225 began to be calculated on 7 September 1950, retroactively calculated back to 16 May 1949. Since January 2010, the index is updated every 15 seconds during trading sessions.
The Nikkei 225 Futures, introduced at Singapore Exchange (SGX) in 1986, the Osaka Securities Exchange (OSE) in 1988, Chicago Mercantile Exchange (CME) in 1990, is now an internationally recognised futures index.[4]
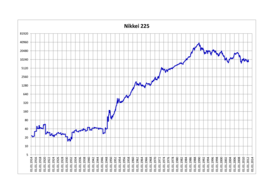
The Nikkei average has deviated sharply from the textbook model of stock averages, which grow at a steady exponential rate. The average hit its all-time high on 29 December 1989, during the peak of the Japanese asset price bubble, when it reached an intra-day high of 38,957.44, before closing at 38,915.87, having grown sixfold during the decade. Subsequently, it lost nearly all these gains, closing at 7,054.98 on 10 March 2009 — 81.9% below its peak twenty years earlier.
Another major index for the Tokyo Stock Exchange is the Tokyo Stock Price Index (TOPIX).
On 15 March 2011, the second working day after the massive earthquake in the northeast part of Japan, the index dropped over 10% to finish at 8605.15, a loss of 1,015 points. The index continued to drop throughout 2011, bottoming out at 8160.01 on 25 November, putting it at its lowest close since 10 March 2009. The Nikkei fell over 17% in 2011, finishing the year at 8455.35, its lowest year-end closing value in thirty years, when the index finished at 8016.70 in 1982.[5]
The Nikkei started 2013 near 10,600, hitting a peak of 15,942 in May. However, shortly afterward, it plunged by almost 10% before rebounding, making it the most volatile stock market index among the developed markets. By 2015, it has reached over 20,000 mark; marking a gain of over 10,000 in two years, making it one of the fastest growing stock market indexes in the world. However, by 2018, the index growth has been more moderate at around the 22,000 mark.
There is concern that the rise since 2013 is artificial and due to purchases by the Bank of Japan ("BOJ").[6][7] From a start in 2013, by end 2017, The BOJ owned circa 75%[8] of all Japanese Exchange Traded Funds ("ETFs"), and are a top 10 shareholder of 90% of the Nikkei 225 constituents.[9][10]
Weighting
The index is a price-weighted index. As of late 2014, the company with the largest influence on the index is Fast Retailing (TYO: 9983).
Annual returns
.svg.png)
The following table shows the annual development of the Nikkei 225, which was calculated back to 1914.[11][12][13]
| Year | Closing level | Change in Index in Points |
Change in Index in % |
|---|---|---|---|
| 1914 | 21.12 | ||
| 1915 | 32.10 | 10.98 | 51.99 |
| 1916 | 41.61 | 9.51 | 29.63 |
| 1917 | 41.40 | −0.21 | −0.50 |
| 1918 | 42.21 | 0.81 | 1.96 |
| 1919 | 53.63 | 11.42 | 27.06 |
| 1920 | 27.44 | −26.19 | −48.83 |
| 1921 | 28.88 | 1.44 | 5.25 |
| 1922 | 23.97 | −4.91 | −17.00 |
| 1923 | 22.83 | −1.14 | −4.76 |
| 1924 | 24.45 | 1.62 | 7.10 |
| 1925 | 27.96 | 3.51 | 14.36 |
| 1926 | 27.25 | −0.71 | −2.54 |
| 1927 | 25.82 | −1.43 | −5.25 |
| 1928 | 25.65 | −0.17 | −0.66 |
| 1929 | 21.32 | −4.33 | −16.88 |
| 1930 | 16.82 | −4.50 | −21.11 |
| 1931 | 16.28 | −0.54 | −3.21 |
| 1932 | 30.33 | 14.05 | 86.30 |
| 1933 | 34.12 | 3.79 | 12.50 |
| 1934 | 32.30 | −1.82 | −5.33 |
| 1935 | 33.76 | 1.46 | 4.52 |
| 1936 | 35.94 | 2.18 | 6.46 |
| 1937 | 37.33 | 1.39 | 3.87 |
| 1938 | 33.66 | −3.67 | −9.83 |
| 1939 | 44.96 | 11.30 | 33.57 |
| 1940 | 37.42 | −7.54 | −16.77 |
| 1941 | 42.44 | 5.02 | 13.42 |
| 1942 | 42.71 | 0.27 | 0.64 |
| 1943 | 42.11 | −0.60 | −1.40 |
| 1944 | 41.82 | −0.29 | −0.69 |
| 1945 | 40.53 | −1.29 | −3.08 |
| 1946 | 28.72 | −11.81 | −29.14 |
| 1947 | 39.31 | 10.59 | 36.87 |
| 1948 | 72.84 | 33.53 | 85.30 |
| 1949 | 109.91 | 37.07 | 50.89 |
| 1950 | 101.91 | −8.00 | −7.28 |
| 1951 | 166.06 | 64.15 | 62.95 |
| 1952 | 362.64 | 196.58 | 118.38 |
| 1953 | 377.95 | 15.31 | 4.22 |
| 1954 | 356.09 | −21.86 | −5.78 |
| 1955 | 425.69 | 69.60 | 19.55 |
| 1956 | 549.14 | 123.45 | 29.00 |
| 1957 | 474.55 | −74.59 | −13.58 |
| 1958 | 666.54 | 191.99 | 40.46 |
| 1959 | 874.88 | 208.34 | 31.26 |
| 1960 | 1,356.71 | 481.83 | 55.07 |
| 1961 | 1,432.60 | 75.89 | 5.59 |
| 1962 | 1,420.43 | −12.17 | −0.85 |
| 1963 | 1,225.10 | −195.33 | −13.75 |
| 1964 | 1,216.55 | −8.55 | −0.70 |
| 1965 | 1,417.83 | 201.28 | 16.55 |
| 1966 | 1,452.10 | 34.27 | 2.42 |
| 1967 | 1,283.47 | −168.63 | −11.61 |
| 1968 | 1,714.89 | 431.42 | 33.61 |
| 1969 | 2,358.96 | 644.07 | 37.56 |
| 1970 | 1,987.14 | −371.82 | −15.76 |
| 1971 | 2,713.74 | 726.60 | 36.57 |
| 1972 | 5,207.94 | 2,494.20 | 91.91 |
| 1973 | 4,306.80 | −901.14 | −17.30 |
| 1974 | 3,817.22 | −489.58 | −11.37 |
| 1975 | 4,358.60 | 541.38 | 14.18 |
| 1976 | 4,990.85 | 632.25 | 14.51 |
| 1977 | 4,865.60 | −125.25 | −2.51 |
| 1978 | 6,001.85 | 1,136.25 | 23.35 |
| 1979 | 6,569.47 | 567.62 | 9.46 |
| 1980 | 7,116.38 | 546.91 | 8.33 |
| 1981 | 7,681.84 | 565.46 | 7.95 |
| 1982 | 8,016.67 | 334.83 | 4.36 |
| 1983 | 9,893.82 | 1,877.15 | 23.42 |
| 1984 | 11,542.60 | 1,648.78 | 16.66 |
| 1985 | 13,113.32 | 1,570.72 | 13.61 |
| 1986 | 18,701.30 | 5,587.98 | 42.61 |
| 1987 | 21,564.00 | 2,862.70 | 15.31 |
| 1988 | 30,159.00 | 8,595.00 | 39.86 |
| 1989 | 38,915.87 | 8,756.87 | 29.04 |
| 1990 | 23,848.71 | −15,067.16 | −38.72 |
| 1991 | 22,983.77 | −864.94 | −3.63 |
| 1992 | 16,924.95 | −6,058.82 | −26.36 |
| 1993 | 17,417.24 | 492.29 | 2.91 |
| 1994 | 19,723.06 | 2,305.82 | 13.24 |
| 1995 | 19,868.15 | 145.09 | 0.74 |
| 1996 | 19,361.35 | −506.80 | −2.55 |
| 1997 | 15,258.74 | −4,102.61 | −21.19 |
| 1998 | 13,842.17 | −1.416,57 | −9.28 |
| 1999 | 18,934.34 | 5,092.17 | 36.79 |
| 2000 | 13,785.69 | −5,148.65 | −27.19 |
| 2001 | 10,542.62 | −3,243.07 | −23.52 |
| 2002 | 8,578.95 | −1,963.67 | −18.63 |
| 2003 | 10,676.64 | 2,097.69 | 24.45 |
| 2004 | 11,488.76 | 812.12 | 7.61 |
| 2005 | 16,111.43 | 4,622.67 | 40.24 |
| 2006 | 17,225.83 | 1,114.40 | 6.92 |
| 2007 | 15,307.78 | −1,918.05 | −11.13 |
| 2008 | 8,859.56 | −6,448.22 | −42.12 |
| 2009 | 10,546.44 | 1,686.88 | 19.04 |
| 2010 | 10,228.92 | −317.52 | −3.01 |
| 2011 | 8,455.35 | −1,773.57 | −17.24 |
| 2012 | 10,395.18 | 1,939.83 | 22.94 |
| 2013 | 16,291.31 | 5,896.13 | 56.72 |
| 2014 | 17,450.77 | 1,159.46 | 7.12 |
| 2015 | 19,033.71 | 1,582.94 | 9.07 |
| 2016 | 19,114.40 | 80.69 | 0.42 |
| 2017 | 22,764.94 | 3,650.54 | 19.10 |
| 2018 | 20,014.77 | −2,750.17 | −12.08 |
| 2019 | 23,656.62 | 3,641.85 | 18.20 |
Components
As of April 2018, the Nikkei 225 consists of the following companies: (Japanese securities identification code in parentheses)[14]
Foods
- Ajinomoto Co., Inc. (TYO: 2802)
- Asahi Breweries, Ltd. (TYO: 2502)
- Japan Tobacco Inc. (TYO: 2914)
- Kikkoman Corp. (TYO: 2801)
- Kirin Brewery Co., Ltd. (TYO: 2503)
- Meiji Holdings Company, Limited (TYO: 2269)
- Nichirei Corp. (TYO: 2871)
- Nippon Meat Packers, Inc. (TYO: 2282)
- Nisshin Seifun Group Inc. (TYO: 2002)
- Sapporo Holdings Ltd. (TYO: 2501)
- Takara Holdings Inc. (TYO: 2531)
Textiles & apparel
Pulp & paper
Chemicals
- Asahi Kasei Corp. (TYO: 3407)
- Denki Kagaku Kogyo K.K. (TYO: 4061)
- DIC Corporation (TYO: 4631)
- Fujifilm Holdings Corp. (TYO: 4901)
- Kao Corp. (TYO: 4452)
- Kuraray Co., Ltd. (TYO: 3405)
- Mitsubishi Chemical Holdings Corp. (TYO: 4188)
- Mitsui Chemicals, Inc. (TYO: 4183)
- Nippon Kayaku Co., Ltd. (TYO: 4272)
- Nissan Chemical Industries, Ltd. (TYO: 4021)
- Nitto Denko (TYO: 6988)
- Shin-Etsu Chemical Co., Ltd. (TYO: 4063)
- Shiseido Co., Ltd. (TYO: 4911)
- Showa Denko K.K. (TYO: 4004)
- Sumitomo Chemical Co., Ltd. (TYO: 4005)
- Tokuyama Corporation (TYO: 4043)
- Tosoh Corp. (TYO: 4042)
- Ube Industries, Ltd. (TYO: 4208)
Pharmaceuticals
- Astellas Pharma Inc. (TYO: 4503)
- Chugai Pharmaceutical Co., Ltd. (TYO: 4519)
- Daiichi Sankyo Co., Ltd. (TYO: 4568)
- Sumitomo Dainippon Pharma Co., Ltd. (TYO: 4506)
- Eisai Co., Ltd. (TYO: 4523)
- Kyowa Hakko Kirin Co., Ltd. (TYO: 4151)
- Otsuka Holdings Co. Co., Ltd. (TYO: 4578)
- Shionogi & Co., Ltd. (TYO: 4507)
- Takeda Pharmaceutical Company, Ltd. (TYO: 4502)
Oil & coal products
- JXTG Holdings (TYO: 5020)
- Idemitsu Kosan Co., Ltd (TYO: 5019)
Rubber products
- Bridgestone Corp. (TYO: 5108)
- The Yokohama Rubber Co., Ltd. (TYO: 5101)
Glass & ceramics
- AGC Inc. (TYO: 5201)
- NGK Insulators, Ltd. (TYO: 5333)
- Nippon Electric Glass Co., Ltd. (TYO: 5214)
- Nippon Sheet Glass Co., Ltd. (TYO: 5202)
- Sumitomo Osaka Cement Co., Ltd. (TYO: 5232)
- Taiheiyo Cement Corp. (TYO: 5233)
- Tokai Carbon Co., Ltd. (TYO: 5301)
- Toto Ltd. (TYO: 5332)
Steel products
- JFE Holdings, Inc. (TYO: 5411)
- Kobe Steel, Ltd. (TYO: 5406)
- Nippon Steel Corp. (TYO: 5401)
- Pacific Metals Co., Ltd. (TYO: 5541)
Nonferrous metals
- Dowa Holdings Co., Ltd. (TYO: 5714)
- Fujikura Ltd. (TYO: 5803)
- Furukawa Co., Ltd. (TYO: 5715)
- The Furukawa Electric Co., Ltd. (TYO: 5801)
- Mitsubishi Materials Corp. (TYO: 5711)
- Mitsui Mining & Smelting Co., Ltd. (TYO: 5706)
- Nippon Light Metal Co., Ltd (TYO: 5703)
- SUMCO Corp. (TYO: 3436)
- Sumitomo Electric Industries, Ltd. (TYO: 5802)
- Sumitomo Metal Mining Co., Ltd. (TYO: 5713)
- Toho Zinc Co., Ltd. (TYO: 5707)
- Toyo Seikan Kaisha, Ltd. (TYO: 5901)
Machinery
- Amada Co. Ltd. (TYO: 6113)
- Chiyoda Corp. (TYO: 6366)
- Daikin Industries, Ltd. (TYO: 6367)
- Ebara Corp. (TYO: 6361)
- Hitachi Construction Machinery Co., Ltd. (TYO: 6305)
- Hitachi Zōsen Corporation (TYO: 7004)
- IHI Corp. (TYO: 7013)
- The Japan Steel Works, Ltd. (TYO: 5631)
- JTEKT Corp. (TYO: 6473)
- Komatsu Ltd. (TYO: 6301)
- Kubota Corp. (TYO: 6326)
- Mitsubishi Heavy Industries, Ltd. (TYO: 7011)
- NSK Ltd. (TYO: 6471)
- NTN Corp. (TYO: 6472)
- Okuma Holdings, Inc. (TYO: 6103)
- Sumitomo Heavy Industries, Ltd. (TYO: 6302)
Electric machinery
- Advantest Corp. (TYO: 6857)
- Alps Electric Co., Ltd. (TYO: 6770)
- Canon Inc. (TYO: 7751)
- Casio Computer Co., Ltd. (TYO: 6952)
- Dainippon Screen Mfg. Co., Ltd. (TYO: 7735)
- Denso Corp. (TYO: 6902)
- FANUC Corp. (TYO: 6954)
- Fuji Electric Holdings Co., Ltd. (TYO: 6504)
- Fujitsu Ltd. (TYO: 6702)
- GS Yuasa Corp. (TYO: 6674)
- Hitachi, Ltd. (TYO: 6501)
- Kyocera Corp. (TYO: 6971)
- Panasonic Corp. (TYO: 6752)
- Minebea Co., Ltd. (TYO: 6479)
- Mitsubishi Electric Corp. (TYO: 6503)
- NEC Corp. (TYO: 6701)
- Nisshinbo Holdings Inc. (TYO: 3105)
- Oki Electric Industry Co., Ltd. (TYO: 6703)
- Pioneer Corporation (TYO: 6773)
- Ricoh (TYO: 7752)
- Seiko Epson Corp. (TYO: 6724)
- Sony Corp. (TYO: 6758)
- Taiyo Yuden Co., Ltd. (TYO: 6976)
- TDK Corp. (TYO: 6762)
- Tokyo Electron Ltd. (TYO: 8035)
- Yaskawa Electric Corporation, Limited (TYO: 6506)
- Yokogawa Electric Corp. (TYO: 6841)
Shipbuilding
- Kawasaki Heavy Industries, Ltd. (TYO: 7012)
- Mitsui Engineering & Shipbuilding Co., Ltd. (TYO: 7003)
Automotive
- Hino Motors, Ltd. (TYO: 7205)
- Honda Motor Co., Ltd. (TYO: 7267)
- Isuzu Motors Ltd. (TYO: 7202)
- Mazda Motor Corp. (TYO: 7261)
- Mitsubishi Motors Corp. (TYO: 7211)
- Nissan Motor Co., Ltd. (TYO: 7201)
- Subaru Corp. (TYO: 7270)
- Suzuki Motor Corp. (TYO: 7269)
- Toyota Motor Corp. (TYO: 7203)
- Yamaha Motor Corp. (TYO: 7272)
Precision instruments
Other manufacturing
Fishery
- Nippon Suisan Kaisha, Ltd. (TYO: 1332)
- Maruha Nichiro Holdings, Inc. (TYO: 1333)
Mining
Construction
Trading companies
Retail
- Aeon Co., Ltd. (TYO: 8267)
- FamilyMart Uny Holdings Co., Ltd. (TYO: 8028)
- Fast Retailing Co., Ltd. (TYO: 9983)
- Isetan Mitsukoshi Holdings Ltd. (TYO: 3099)
- J. Front Retailing Co., Ltd. (TYO: 3086)
- Marui Group Co., Ltd. (TYO: 8252)
- Seven & I Holdings Co., Ltd. (TYO: 3382)
- Takashimaya Co., Ltd. (TYO: 8233)
Banking
- Aozora Bank, Ltd. (TYO: 8304)
- The Chiba Bank, Ltd. (TYO: 8331)
- Concordia Financial Group, Inc. (TYO: 7186)
- Sumitomo Mitsui Trust Holdings, Inc. (TYO: 8309)
- Fukuoka Financial Group, Inc. (TYO: 8354)
- Mitsubishi UFJ Financial Group, Inc. (TYO: 8306)
- Mizuho Financial Group, Inc. (TYO: 8411)
- Resona Holdings, Inc. (TYO: 8308)
- Shinsei Bank, Ltd. (TYO: 8303)
- The Shizuoka Bank, Ltd. (TYO: 8355)
- Sumitomo Mitsui Financial Group, Inc. (TYO: 8316)
Securities
- Daiwa Securities Group Inc. (TYO: 8601)
- Matsui Securities Co., Ltd. (TYO: 8628)
- Nomura Holdings, Inc. (TYO: 8604)
Insurance
- Dai-ichi Life Insurance Company, Limited (TYO: 8750)
- MS&AD Insurance Group, Inc. (TYO: 8725)
- Sompo Holdings, Inc. (TYO: 8630)
- Sony Financial Holdings Inc. (TYO: 8729)
- T&D Holdings, Inc. (TYO: 8795)
- Tokio Marine Holdings, Inc. (TYO: 8766)
Other financial services
- Credit Saison Co., Ltd. (TYO: 8253)
Real estate
- Mitsubishi Estate Co., Ltd. (TYO: 8802)
- Mitsui Fudosan Co.,Ltd (TYO: 8801)
- Sumitomo Realty & Development Co., Ltd. (TYO: 8830)
- Tokyo Tatemono Co., Ltd. (TYO: 8804)
- Tokyu Land Corp. (TYO: 3289)
Railway/bus
- Central Japan Railway Company (TYO: 9022)
- East Japan Railway Company (TYO: 9020)
- Keio Corp. (TYO: 9008)
- Keisei Electric Railway Co., Ltd. (TYO: 9009)
- Odakyu Electric Railway Co., Ltd. (TYO: 9007)
- Tobu Railway Co., Ltd. (TYO: 9001)
- Tokyu Corp. (TYO: 9005)
- West Japan Railway Company (TYO: 9021)
Other land transport
- Nippon Express Co., Ltd. (TYO: 9062)
- Yamato Holdings Co., Ltd. (TYO: 9064)
Marine transport
- Kawasaki Kisen Kaisha, Ltd. (TYO: 9107)
- Mitsui O.S.K. Lines, Ltd. (TYO: 9104)
- Nippon Yusen K.K. (TYO: 9101)
Air transport
- All Nippon Airways Co., Ltd. (TYO: 9202)
Warehousing
- Mitsubishi Logistics Corp. (TYO: 9301)
Communications
Electric power
- Chubu Electric Power Co., Inc. (TYO: 9502)
- The Kansai Electric Power Co., Inc. (TYO: 9503)
- Tokyo Electric Power Company Holdings, Incorporated (TYO: 9501)
Gas
Services
- Dena Co., Ltd. (TYO: 2432)
- Dentsu Inc. (TYO: 4324)
- Japan Post Holdings Co., Ltd. (TYO: 6178)
- Konami Corp. (TYO: 9766)
- Rakuten Inc. (TYO: 4755)
- Recruit Holdings Co., Ltd. (TYO: 6098)
- Secom Co., Ltd. (TYO: 9735)
- Tokyo Dome Corp. (TYO: 9681)
- Toho Co., Ltd. (TYO: 9602)
- Trend Micro Inc. (TYO: 4704)
- Yahoo Japan Corp. (TYO: 4689)
See also
References
- "the Nikkei (index) definition, meaning - what is the Nikkei (index) in the British English Dictionary & Thesaurus". cambridge.org. Cambridge Dictionaries Online.
- "Nikkei 225". Yahoo.com. Yahoo. Archived from the original on 12 December 2011.
- Overview of the Nikkei 225 Stock Market Index
- Nikkei Net interactive Archived 22 December 2008 at the Wayback Machine
- "Finfacts: Irish business, finance news on economics". FinFacts.com.
- "Japan Central Bank's ETF Shopping Spree Is Becoming a Worry". Bloomberg. 18 July 2017.
- "Japan's Central Bank Is Distorting the Market, Bourse Chief Says". Bloomberg. 19 July 2017.
- "Bank of Japan's $150 Billion ETF Binge Looks Likely to Slow Next Year". Bloomberg. 10 December 2017.
- "BoJ Now A Top 10 Shareholder In 90% Of Nikkei 225". Barrons. 24 April 2017.
- "What Happens When The Bank Of Japan Owns Everything?". Forbes. 27 April 2016.
- "Finfacts: Irish business, finance news on economics". www.finfacts.com. Retrieved 19 January 2020.
- "Historical Data (Nikkei 225) - Nikkei Indexes". indexes.nikkei.co.jp. Retrieved 19 January 2020.
- "NIKKEI 225 Index (Japan) Yearly Stock Returns". www.1stock1.com. Retrieved 19 January 2020.
- "Components:Nikkei Stock Average (Nikkei 225)". Nikkei Indexes. 24 April 2018.
External links
- Nikkei 225 Components — official website at indexes.Nikkei.co.jp
- Index detail: Nikkei Stock Average 225 — at Reuters
- Nikkei 225 page – NKY:IND — on Bloomberg Markets
- Nikkei 225 index — on Google Finance
- Nikkei 225 index — on Yahoo! Finance
- Nikkei 225 profile — at Wikinvest