Spectrum
A spectrum (plural spectra or spectrums)[1] is a condition that is not limited to a specific set of values but can vary, without steps, across a continuum. The word was first used scientifically in optics to describe the rainbow of colors in visible light after passing through a prism. As scientific understanding of light advanced, it came to apply to the entire electromagnetic spectrum.

Spectrum has since been applied by analogy to topics outside optics. Thus, one might talk about the "spectrum of political opinion", or the "spectrum of activity" of a drug, or the "autism spectrum". In these uses, values within a spectrum may not be associated with precisely quantifiable numbers or definitions. Such uses imply a broad range of conditions or behaviors grouped together and studied under a single title for ease of discussion. Nonscientific uses of the term spectrum are sometimes misleading. For instance, a single left–right spectrum of political opinion does not capture the full range of people's political beliefs. Political scientists use a variety of biaxial and multiaxial systems to more accurately characterize political opinion.
In most modern usages of spectrum there is a unifying theme between the extremes at either end. This was not always true in older usage.
Etymology
In Latin, spectrum means "image" or "apparition", including the meaning "spectre". Spectral evidence is testimony about what was done by spectres of persons not present physically, or hearsay evidence about what ghosts or apparitions of Satan said. It was used to convict a number of persons of witchcraft at Salem, Massachusetts in the late 17th century. The word "spectrum" [Spektrum] was strictly used to designate a ghostly optical afterimage by Goethe in his Theory of Colors and Schopenhauer in On Vision and Colors.
The prefix "spectro-" is used to form words relating to spectra. For example, a spectrometer is a device used to record spectra and spectroscopy is the use of a spectrometer for chemical analysis.
Physical science
In the 17th century, the word spectrum was introduced into optics by Isaac Newton, referring to the range of colors observed when white light was dispersed through a prism.[2][3] Soon the term referred to a plot of light intensity or power as a function of frequency or wavelength, also known as a spectral density plot.
The term spectrum was expanded to apply to other waves, such as sound waves that could also be measured as a function of frequency, frequency spectrum and power spectrum of a signal. The term now applies to any signal that can be measured or decomposed along a continuous variable such as energy in electron spectroscopy or mass-to-charge ratio in mass spectrometry. Spectrum is also used to refer to a graphical representation of the signal as a function of the dependent variable.
Electromagnetic spectrum
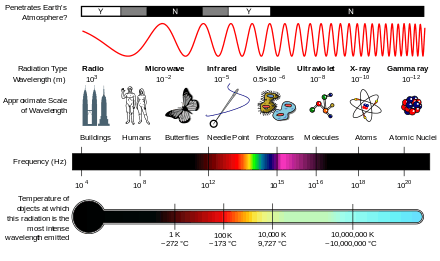
Electromagnetic spectrum refers to the full range of all frequencies of electromagnetic radiation[4] and also to the characteristic distribution of electromagnetic radiation emitted or absorbed by that particular object. Devices used to measure an electromagnetic spectrum are called spectrograph or spectrometer. The visible spectrum is the part of the electromagnetic spectrum that can be seen by the human eye. The wavelength of visible light ranges from 390 to 700 nm.[5] The absorption spectrum of a chemical element or chemical compound is the spectrum of frequencies or wavelengths of incident radiation that are absorbed by the compound due to electron transitions from a lower to a higher energy state. The emission spectrum refers to the spectrum of radiation emitted by the compound due to electron transitions from a higher to a lower energy state.
Light from many different sources contains various colors, each with its own brightness or intensity. A rainbow, or prism, sends these component colors in different directions, making them individually visible at different angles. A graph of the intensity plotted against the frequency (showing the brightness of each color) is the frequency spectrum of the light. When all the visible frequencies are present equally, the perceived color of the light is white, and the spectrum is a flat line. Therefore, flat-line spectra in general are often referred to as white, whether they represent light or another type of wave phenomenon (sound, for example, or vibration in a structure).
In radio and telecommunications, the frequency spectrum can be shared among many different broadcasters. The radio spectrum is the part of the electromagnetic spectrum corresponding to frequencies lower below 300 GHz, which corresponds to wavelengths longer than about 1 mm. The microwave spectrum corresponds to frequencies between 300 MHz (0.3 GHz) and 300 GHz and wavelengths between one meter and one millimeter.[6][7] Each broadcast radio and TV station transmits a wave on an assigned frequency range, called a channel. When many broadcasters are present, the radio spectrum consists of the sum of all the individual channels, each carrying separate information, spread across a wide frequency spectrum. Any particular radio receiver will detect a single function of amplitude (voltage) vs. time. The radio then uses a tuned circuit or tuner to select a single channel or frequency band and demodulate or decode the information from that broadcaster. If we made a graph of the strength of each channel vs. the frequency of the tuner, it would be the frequency spectrum of the antenna signal.
In astronomical spectroscopy, the strength, shape, and position of absorption and emission lines, as well as the overall spectral energy distribution of the continuum, reveal many properties of astronomical objects. Stellar classification is the categorisation of stars based on their characteristic electromagnetic spectra. The spectral flux density is used to represent the spectrum of a light-source, such as a star.
In radiometry and colorimetry (or color science more generally), the spectral power distribution (SPD) of a light source is a measure of the power contributed by each frequency or color in a light source. The light spectrum is usually measured at points (often 31) along the visible spectrum, in wavelength space instead of frequency space, which makes it not strictly a spectral density. Some spectrophotometers can measure increments as fine as one to two nanometers. the values are used to calculate other specifications and then plotted to show the spectral attributes of the source. This can be helpful in analyzing the color characteristics of a particular source.
Mass spectrum
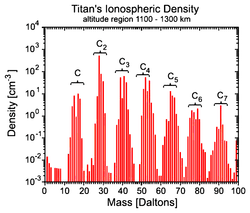
A plot of ion abundance as a function of mass-to-charge ratio is called a mass spectrum. It can be produced by a mass spectrometer instrument.[8] The mass spectrum can be used to determine the quantity and mass of atoms and molecules. Tandem mass spectrometry is used to determine molecular structure.
Energy spectrum
In physics, the energy spectrum of a particle is the number of particles or intensity of a particle beam as a function of particle energy. Examples of techniques that produce an energy spectrum are alpha-particle spectroscopy, electron energy loss spectroscopy, and mass-analyzed ion-kinetic-energy spectrometry.
Discrete spectrum
In physics, particularly in quantum mechanics, some differential operators have discrete spectra, with gaps between values. Common cases include the Hamiltonian and the angular momentum operator.
Spectrogram
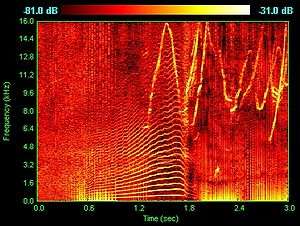
In acoustics, a spectrogram is a visual representation of the frequency spectrum of sound as a function of time or another variable.
A source of sound can have many different frequencies mixed. A Musical tone's timbre is characterized by its harmonic spectrum. Sound in our environment that we refer to as noise includes many different frequencies. When a sound signal contains a mixture of all audible frequencies, distributed equally over the audio spectrum, it is called white noise.[9]
The spectrum analyzer is an instrument which can be used to convert the sound wave of the musical note into a visual display of the constituent frequencies. This visual display is referred to as an acoustic spectrogram. Software based audio spectrum analyzers are available at low cost, providing easy access not only to industry professionals, but also to academics, students and the hobbyist. The acoustic spectrogram generated by the spectrum analyzer provides an acoustic signature of the musical note. In addition to revealing the fundamental frequency and its overtones, the spectrogram is also useful for analysis of the temporal attack, decay, sustain, and release of the musical note.
Biological science
Antibiotic spectrum of activity is a component of antibiotic classification. A broad-spectrum antibiotic is active against a wide range of bacteria,[10] whereas a narrow-spectrum antibiotic is effective against specific families of bacteria.[11] An example of a commonly used broad-spectrum antibiotic is ampicillin.[11] An example of a narrow spectrum antibiotic is Dicloxacillin, which acts on beta-lactamase-producing Gram-positive bacteria such as Staphylococcus aureus.[12]
In psychiatry, the spectrum approach uses the term spectrum to describe a range of linked conditions, sometimes also extending to include singular symptoms and traits. For example, the autism spectrum describes a range of conditions classified as neurodevelopmental disorders.
Mathematics
In mathematics, the spectrum of a matrix is the multiset of the eigenvalues of the matrix.
In functional analysis, the concept of the spectrum of a bounded operator is a generalization of the eigenvalue concept for matrices.
In algebraic topology, a spectrum is an object representing a generalized cohomology theory.
Social science

In social science, economic spectrum is used to indicate the range of social class along some indicator of wealth or income. In political science, the term political spectrum refers to a system of classifying political positions in one or more dimensions, for example in a range including right wing and left wing.
References
| Look up spectrum in Wiktionary, the free dictionary. |
- Dictionary.com Archived February 23, 2008, at the Wayback Machine. The American Heritage Dictionary of the English Language, Fourth Edition. Houghton Mifflin Company, 2004. (accessed: January 25, 2008).
-

- Newton, Isaac (1671). "A letter of Mr. Isaac Newton … containing his new theory about light and colours …". Philosophical Transactions of the Royal Society of London. 6 (80): 3075–3087. Bibcode:1671RSPT....6.3075N. doi:10.1098/rstl.1671.0072. The word "spectrum" to describe a band of colors that has been produced, by refraction or diffraction, from a beam of light first appears on p. 3076.
- "Electromagnetic spectrum". Imagine the Universe! Dictionary. NASA. Archived from the original on May 24, 2015. Retrieved June 3, 2015.
- Starr, Cecie (2005). Biology: Concepts and Applications. Thomson Brooks/Cole. p. 94. ISBN 0-534-46226-X.
- Pozar, David M. (1993). Microwave Engineering Addison–Wesley Publishing Company. ISBN 0-201-50418-9.
- Sorrentino, R. and Bianchi, Giovanni (2010) Microwave and RF Engineering Archived August 5, 2016, at the Wayback Machine, John Wiley & Sons, p. 4, ISBN 047066021X.
- IUPAC, Compendium of Chemical Terminology, 2nd ed. (the "Gold Book") (1997). Online corrected version: (2006–) "mass spectrum". doi:10.1351/goldbook.M03749
- "white noise definition". yourdictionary.com. Archived from the original on June 30, 2015.
- Clayton L. Thomas Editor, Taber's Cyclopedic Medical Dictionary 17th ed., 1993 (ISBN 0-8036-8313-8)
- S.J. Hopkins, Drugs and Pharmacology for Nurses 12th ed., 1997 (ISBN 0-443-05249 2)
- Miranda-Novales G, Leaños-Miranda BE, Vilchis-Pérez M, Solórzano-Santos F (2006). "In vitro activity effects of combinations of cephalothin, dicloxacillin, imipenem, vancomycin and amikacin against methicillin-resistant Staphylococcus spp. strains". Ann. Clin. Microbiol. Antimicrob. 5: 25. doi:10.1186/1476-0711-5-25. PMC 1617116. PMID 17034644.