Spectral energy distribution
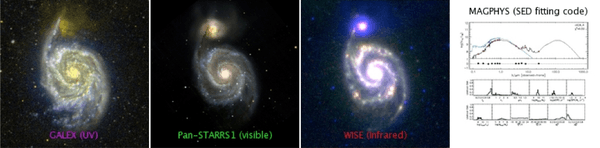
A spectral energy distribution (SED) is a plot of energy versus frequency or wavelength of light (not to be confused with a 'spectrum' of flux density vs frequency or wavelength).[1] It is used in many branches of astronomy to characterize astronomical sources. For example, in radio astronomy they are used to show the emission from synchrotron radiation, free-free emission and other emission mechanisms. In infrared astronomy, SEDs can be used to classify young stellar objects.
Detector for spectral energy distribution
The count rates observed from a given astronomical radiation source have no simple relationship to the flux from that source, such as might be incident at the top of the Earth’s atmosphere.[2] This lack of a simple relationship is due in no small part to the complex properties of radiation detectors.[2]
These detector properties can be divided into
- those that merely attenuate the beam, including
- residual atmosphere between source and detector,
- absorption in the detector window when present,
- quantum efficiency of the detecting medium,[2]
- those that redistribute the beam in detected energy, such as
- fluorescent photon escape phenomena,
- inherent energy resolution of the detector.[2]
See also
- Astronomical radio source
- Astronomical X-ray sources
- Background radiation
- Bremsstrahlung
- Cyclotron radiation
- Electromagnetic radiation
- Synchrotron radiation
- Wavelength dispersive X-ray spectroscopy
References
- "SED plots - CoolWiki". coolwiki.ipac.caltech.edu. Retrieved 27 February 2018.
- Dolan JF (Aug 1972). "The Direct Reduction of Astronomical X-Ray Spectra". Astrophys. Space Sci. 17 (2): 472–81. Bibcode:1972Ap&SS..17..472D. doi:10.1007/BF00642917.
Further reading
- Eberhard Haug & Werner Nakel (2004). The elementary process of Bremsstrahlung. River Edge NJ: World Scientific. p. Scientific lecture notes in physics, vol. 73. ISBN 978-981-238-578-9.
- Jakob Walcher; Brent Groves; Tamás Budavári; Daniel Dale. "Fitting the spectral energy distributions of galaxies". Archived from the original on 2014-08-14.
External links
- The High Energy Astrophysics Science Archive Research Center (HEASARC) at NASA
- The Science of Spectroscopy