Spectroscopy
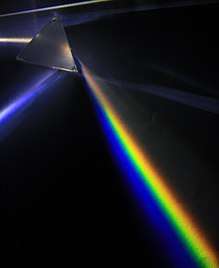
Spectroscopy /spɛkˈtrɒskəpi/ is the study of the interaction between matter and electromagnetic radiation (via electron spectroscopy, atomic spectroscopy, etc).[1][2][3][4][5][6] Historically, spectroscopy originated through the study of visible light dispersed according to its wavelength, by a prism. Later the concept was expanded greatly to include any interaction with radiative energy as a function of its wavelength or frequency, predominantly in the electromagnetic spectrum, although matter waves and acoustic waves can also be considered forms of radiative energy; recently, with tremendous difficulty, even gravitational waves have been associated with a spectral signature in the context of the Laser Interferometer Gravitational-Wave Observatory (LIGO) and laser interferometry. Spectroscopic data are often represented by an emission spectrum, a plot of the response of interest, as a function of wavelength or frequency.
Spectroscopy, primarily in the electromagnetic spectrum, is a fundamental exploratory tool in the fields of physics, chemistry, and astronomy, allowing the composition, physical structure and electronic structure of matter to be investigated at atomic scale, molecular scale, macro scale, and over astronomical distances. Important applications arise from biomedical spectroscopy in the areas of tissue analysis and medical imaging.
Introduction
Spectroscopy and spectrography are terms used to refer to the measurement of radiation intensity as a function of wavelength and are often used to describe experimental spectroscopic methods. Spectral measurement devices are referred to as spectrometers, spectrophotometers, spectrographs or spectral analyzers.
Daily observations of color can be related to spectroscopy. Neon lighting is a direct application of atomic spectroscopy. Neon and other noble gases have characteristic emission frequencies (colors). Neon lamps use collision of electrons with the gas to excite these emissions. Inks, dyes and paints include chemical compounds selected for their spectral characteristics in order to generate specific colors and hues. A commonly encountered molecular spectrum is that of nitrogen dioxide. Gaseous nitrogen dioxide has a characteristic red absorption feature, and this gives air polluted with nitrogen dioxide a reddish-brown color. Rayleigh scattering is a spectroscopic scattering phenomenon that accounts for the color of the sky.
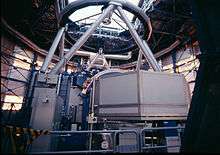
Spectroscopic studies were central to the development of quantum mechanics and included Max Planck's explanation of blackbody radiation, Albert Einstein's explanation of the photoelectric effect and Niels Bohr's explanation of atomic structure and spectra. Spectroscopy is used in physical and analytical chemistry because atoms and molecules have unique spectra. As a result, these spectra can be used to detect, identify and quantify information about the atoms and molecules. Spectroscopy is also used in astronomy and remote sensing on Earth. Most research telescopes have spectrographs. The measured spectra are used to determine the chemical composition and physical properties of astronomical objects (such as their temperature and velocity).
Theory
One of the central concepts in spectroscopy is a resonance and its corresponding resonant frequency. Resonances were first characterized in mechanical systems such as pendulums. Mechanical systems that vibrate or oscillate will experience large amplitude oscillations when they are driven at their resonant frequency. A plot of amplitude vs. excitation frequency will have a peak centered at the resonance frequency. This plot is one type of spectrum, with the peak often referred to as a spectral line, and most spectral lines have a similar appearance.
In quantum mechanical systems, the analogous resonance is a coupling of two quantum mechanical stationary states of one system, such as an atom, via an oscillatory source of energy such as a photon. The coupling of the two states is strongest when the energy of the source matches the energy difference between the two states. The energy of a photon is related to its frequency by where is Planck's constant, and so a spectrum of the system response vs. photon frequency will peak at the resonant frequency or energy. Particles such as electrons and neutrons have a comparable relationship, the de Broglie relations, between their kinetic energy and their wavelength and frequency and therefore can also excite resonant interactions.


Spectra of atoms and molecules often consist of a series of spectral lines, each one representing a resonance between two different quantum states. The explanation of these series, and the spectral patterns associated with them, were one of the experimental enigmas that drove the development and acceptance of quantum mechanics. The hydrogen spectral series in particular was first successfully explained by the Rutherford-Bohr quantum model of the hydrogen atom. In some cases spectral lines are well separated and distinguishable, but spectral lines can also overlap and appear to be a single transition if the density of energy states is high enough. Named series of lines include the principal, sharp, diffuse and fundamental series.
Classification of methods

Spectroscopy is a sufficiently broad field that many sub-disciplines exist, each with numerous implementations of specific spectroscopic techniques. The various implementations and techniques can be classified in several ways.
Type of radiative energy
The types of spectroscopy are distinguished by the type of radiative energy involved in the interaction. In many applications, the spectrum is determined by measuring changes in the intensity or frequency of this energy. The types of radiative energy studied include:
- Electromagnetic radiation was the first source of energy used for spectroscopic studies. Techniques that employ electromagnetic radiation are typically classified by the wavelength region of the spectrum and include microwave, terahertz, infrared, near-infrared, ultraviolet-visible, x-ray, and gamma spectroscopy.
- Particles, because of their de Broglie waves, can also be a source of radiative energy. Both electron and neutron spectroscopy are commonly used. For a particle, its kinetic energy determines its wavelength.
- Acoustic spectroscopy involves radiated pressure waves.
- Dynamic mechanical analysis can be employed to impart radiating energy, similar to acoustic waves, to solid materials.
Nature of the interaction
The types of spectroscopy also can be distinguished by the nature of the interaction between the energy and the material. These interactions include:[5]
- Absorption spectroscopy: Absorption occurs when energy from the radiative source is absorbed by the material. Absorption is often determined by measuring the fraction of energy transmitted through the material, with absorption decreasing the transmitted portion.
- Emission spectroscopy: Emission indicates that radiative energy is released by the material. A material's blackbody spectrum is a spontaneous emission spectrum determined by its temperature. This feature can be measured in the infrared by instruments such as the atmospheric emitted radiance interferometer.[8] Emission can also be induced by other sources of energy such as flames, sparks, electric arcs or electromagnetic radiation in the case of fluorescence.
- Elastic scattering and reflection spectroscopy determine how incident radiation is reflected or scattered by a material. Crystallography employs the scattering of high energy radiation, such as x-rays and electrons, to examine the arrangement of atoms in proteins and solid crystals.
- Impedance spectroscopy: Impedance is the ability of a medium to impede or slow the transmittance of energy. For optical applications, this is characterized by the index of refraction.
- Inelastic scattering phenomena involve an exchange of energy between the radiation and the matter that shifts the wavelength of the scattered radiation. These include Raman and Compton scattering.
- Coherent or resonance spectroscopy are techniques where the radiative energy couples two quantum states of the material in a coherent interaction that is sustained by the radiating field. The coherence can be disrupted by other interactions, such as particle collisions and energy transfer, and so often require high intensity radiation to be sustained. Nuclear magnetic resonance (NMR) spectroscopy is a widely used resonance method, and ultrafast laser spectroscopy is also possible in the infrared and visible spectral regions.
- Nuclear spectroscopy are methods that use the properties of specific nuclei to probe the local structure in matter, mainly condensed matter, molecules in liquids or frozen liquids and bio-molecules.
Type of material
Spectroscopic studies are designed so that the radiant energy interacts with specific types of matter.
Atoms
Atomic spectroscopy was the first application of spectroscopy developed. Atomic absorption spectroscopy and atomic emission spectroscopy involve visible and ultraviolet light. These absorptions and emissions, often referred to as atomic spectral lines, are due to electronic transitions of outer shell electrons as they rise and fall from one electron orbit to another. Atoms also have distinct x-ray spectra that are attributable to the excitation of inner shell electrons to excited states.
Atoms of different elements have distinct spectra and therefore atomic spectroscopy allows for the identification and quantitation of a sample's elemental composition. After inventing the spectroscope, Robert Bunsen and Gustav Kirchhoff discovered new elements by observing their emission spectra. Atomic absorption lines are observed in the solar spectrum and referred to as Fraunhofer lines after their discoverer. A comprehensive explanation of the hydrogen spectrum was an early success of quantum mechanics and explained the Lamb shift observed in the hydrogen spectrum, which further led to the development of quantum electrodynamics.
Modern implementations of atomic spectroscopy for studying visible and ultraviolet transitions include flame emission spectroscopy, inductively coupled plasma atomic emission spectroscopy, glow discharge spectroscopy, microwave induced plasma spectroscopy, and spark or arc emission spectroscopy. Techniques for studying x-ray spectra include X-ray spectroscopy and X-ray fluorescence.
Molecules
The combination of atoms into molecules leads to the creation of unique types of energetic states and therefore unique spectra of the transitions between these states. Molecular spectra can be obtained due to electron spin states (electron paramagnetic resonance), molecular rotations, molecular vibration, and electronic states. Rotations are collective motions of the atomic nuclei and typically lead to spectra in the microwave and millimeter-wave spectral regions. Rotational spectroscopy and microwave spectroscopy are synonymous. Vibrations are relative motions of the atomic nuclei and are studied by both infrared and Raman spectroscopy. Electronic excitations are studied using visible and ultraviolet spectroscopy as well as fluorescence spectroscopy.
Studies in molecular spectroscopy led to the development of the first maser and contributed to the subsequent development of the laser.
Crystals and extended materials
The combination of atoms or molecules into crystals or other extended forms leads to the creation of additional energetic states. These states are numerous and therefore have a high density of states. This high density often makes the spectra weaker and less distinct, i.e., broader. For instance, blackbody radiation is due to the thermal motions of atoms and molecules within a material. Acoustic and mechanical responses are due to collective motions as well. Pure crystals, though, can have distinct spectral transitions, and the crystal arrangement also has an effect on the observed molecular spectra. The regular lattice structure of crystals also scatters x-rays, electrons or neutrons allowing for crystallographic studies.
Nuclei
Nuclei also have distinct energy states that are widely separated and lead to gamma ray spectra. Distinct nuclear spin states can have their energy separated by a magnetic field, and this allows for nuclear magnetic resonance spectroscopy.
Other types
Other types of spectroscopy are distinguished by specific applications or implementations:
- Acoustic resonance spectroscopy is based on sound waves primarily in the audible and ultrasonic regions.
- Auger electron spectroscopy is a method used to study surfaces of materials on a micro-scale. It is often used in connection with electron microscopy.
- Cavity ring-down spectroscopy
- Circular Dichroism spectroscopy
- Coherent anti-Stokes Raman spectroscopy is a recent technique that has high sensitivity and powerful applications for in vivo spectroscopy and imaging.[9]
- Cold vapour atomic fluorescence spectroscopy
- Correlation spectroscopy encompasses several types of two-dimensional NMR spectroscopy.
- Deep-level transient spectroscopy measures concentration and analyzes parameters of electrically active defects in semiconducting materials.
- Dielectric spectroscopy
- Dual-polarization interferometry measures the real and imaginary components of the complex refractive index.
- Electron energy loss spectroscopy in transmission electron microscopy.
- Electron phenomenological spectroscopy measures the physicochemical properties and characteristics of the electronic structure of multicomponent and complex molecular systems.
- Electron paramagnetic resonance spectroscopy
- Force spectroscopy
- Fourier-transform spectroscopy is an efficient method for processing spectra data obtained using interferometers. Fourier-transform infrared spectroscopy is a common implementation of infrared spectroscopy. NMR also employs Fourier transforms.
- Hadron spectroscopy studies the energy/mass spectrum of hadrons according to spin, parity, and other particle properties. Baryon spectroscopy and meson spectroscopy are types of hadron spectroscopy.
- Hyperspectral imaging is a method to create a complete picture of the environment or various objects, each pixel containing a full visible, visible near infrared, near infrared, or infrared spectrum.
- Inelastic electron tunneling spectroscopy uses the changes in current due to inelastic electron-vibration interaction at specific energies that can also measure optically forbidden transitions.
- Inelastic neutron scattering is similar to Raman spectroscopy, but uses neutrons instead of photons.
- Laser-induced breakdown spectroscopy, also called laser-induced plasma spectrometry
- Laser spectroscopy uses tunable lasers[10] and other types of coherent emission sources, such as optical parametric oscillators,[11] for selective excitation of atomic or molecular species.
- Mass spectroscopy is a historical term used to refer to mass spectrometry. The current recommendation is to use the latter term.[12] The term "mass spectroscopy" originated in the use of phosphor screens to detect ions.
- Mössbauer spectroscopy probes the properties of specific isotopic nuclei in different atomic environments by analyzing the resonant absorption of gamma rays. See also Mössbauer effect.
- Multivariate optical computing is an all optical compressed sensing technique, generally used in harsh environments, that directly calculates chemical information from a spectrum as analogue output.
- Neutron spin echo spectroscopy measures internal dynamics in proteins and other soft matter systems.
- Perturbed angular correlation (PAC) uses radioactive nuclei as probe to study electric and magnetic fields (hyperfine interactions) in crystals (condensed matter) and bio-molecules.
- Photoacoustic spectroscopy measures the sound waves produced upon the absorption of radiation.
- Photoemission spectroscopy
- Photothermal spectroscopy measures heat evolved upon absorption of radiation.
- Pump-probe spectroscopy can use ultrafast laser pulses to measure reaction intermediates in the femtosecond timescale.
- Raman optical activity spectroscopy exploits Raman scattering and optical activity effects to reveal detailed information on chiral centers in molecules.
- Raman spectroscopy
- Saturated spectroscopy
- Scanning tunneling spectroscopy
- Spectrophotometry
- Spin noise spectroscopy traces spontaneous fluctuations of electronic and nuclear spins.[13]
- Time-resolved spectroscopy measures the decay rates of excited states using various spectroscopic methods.
- Time-stretch spectroscopy[14][15]
- Thermal infrared spectroscopy measures thermal radiation emitted from materials and surfaces and is used to determine the type of bonds present in a sample as well as their lattice environment. The techniques are widely used by organic chemists, mineralogists, and planetary scientists.
- Transient grating spectroscopy measures quasiparticle propagation. It can track changes in metallic materials as they are irradiated.
- Ultraviolet photoelectron spectroscopy
- Ultraviolet–visible spectroscopy
- Vibrational circular dichroism spectroscopy
- Video spectroscopy
- X-ray photoelectron spectroscopy
Applications
- Cure monitoring of composites using optical fibers.
- Estimate weathered wood exposure times using near infrared spectroscopy.[17]
- Measurement of different compounds in food samples by absorption spectroscopy both in visible and infrared spectrum.
- Measurement of toxic compounds in blood samples
- Non-destructive elemental analysis by X-ray fluorescence.
- Electronic structure research with various spectroscopes.
History
The history of spectroscopy began with Isaac Newton's optics experiments (1666–1672). Newton applied the word "spectrum" to describe the rainbow of colors that combine to form white light and that are revealed when the white light is passed through a prism. During the early 1800s, Joseph von Fraunhofer made experimental advances with dispersive spectrometers that enabled spectroscopy to become a more precise and quantitative scientific technique. Since then, spectroscopy has played and continues to play a significant role in chemistry, physics, and astronomy.
- "In 1672, in the first paper that he submitted to the Royal Society, Isaac Newton described an experiment in which he permitted sunlight to pass through a small hole and then through a prism. Newton found that sunlight, which looks white to us, is actually made up of a mixture of all the colors of the rainbow."[18]
- "In 1802, William Hyde Wollaston built an improved spectrometer that included a lens to focus the Sun’s spectrum on a screen. Upon use, Wollaston realized that the colors were not spread uniformly, but instead had missing patches of colors, which appeared as dark bands in the spectrum. Later, in 1815, German physicist Joseph Fraunhofer also examined the solar spectrum, and found about 600 such dark lines (missing colors), which are now known as Fraunhofer lines, or Absorption lines."[18]
See also
Notes
- H. W. Kroto, Molecular Rotation Spectra, Wiley, New York, 1975 (Reprinted by Dover 1992)
- Philip R. Bunker and Per Jensen, Molecular Symmetry and Spectroscopy, 2nd edition, NRC Research Press, Ottawa, 1998
- D. Papoušek and M. R. Aliev, Molecular Vibrational-Rotational Spectra Elsevier, Amsterdam, 1982
- E. B. Wilson, J. C. Decius, and P. C. Cross, Molecular Vibrations, McGraw-Hill, New York, 1955 (Reprinted by Dover 1980)
- Crouch, Stanley; Skoog, Douglas A. (2007). Principles of instrumental analysis. Australia: Thomson Brooks/Cole. ISBN 978-0-495-01201-6.
- Herrmann, R.; C. Onkelinx (1986). "Quantities and units in clinical chemistry: Nebulizer and flame properties in flame emission and absorption spectrometry (Recommendations 1986)". Pure and Applied Chemistry. 58 (12): 1737–1742. doi:10.1351/pac198658121737.
- "A Taste of ESPRESSO". Retrieved 15 September 2015.
- Mariani, Z.; Strong, K.; Wolff, M.; Rowe, P.; Walden, V.; Fogal, P. F.; Duck, T.; Lesins, G.; Turner, D. S.; Cox, C.; Eloranta, E.; Drummond, J. R.; Roy, C.; Turner, D. D.; Hudak, D.; Lindenmaier, I. A. (2012). "Infrared measurements in the Arctic using two Atmospheric Emitted Radiance Interferometers". Atmos. Meas. Tech. 5 (2): 329–344. Bibcode:2012AMT.....5..329M. doi:10.5194/amt-5-329-2012.
- Evans, C. L.; Xie, X. S. (2008). "Coherent Anti-Stokes Raman Scattering Microscopy: Chemical Imaging for Biology and Medicine". Annual Review of Analytical Chemistry. 1: 883–909. Bibcode:2008ARAC....1..883E. doi:10.1146/annurev.anchem.1.031207.112754. PMID 20636101.
- W. Demtröder, Laser Spectroscopy, 3rd Ed. (Springer, 2003).
- Brian Orr; J. G. Haub; Y. He; R. T. White (2016). "Spectroscopic Applications of Pulsed Tunable Optical Parametric Oscillators". In F. J. Duarte (ed.). Tunable Laser Applications (3rd ed.). Boca Raton: CRC Press. pp. 17–142. ISBN 978-1-4822-6106-6.
- Murray, Kermit K.; Boyd, Robert K.; Eberlin, Marcos N.; Langley, G. John; Li, Liang; Naito, Yasuhide (2013). "Definitions of terms relating to mass spectrometry (IUPAC Recommendations 2013)". Pure and Applied Chemistry. 85 (7): 1. doi:10.1351/PAC-REC-06-04-06. ISSN 0033-4545.
- N. A. Sinitsyn; Y. V. Pershin (2016). "The theory of spin noise spectroscopy: a review". Reports on Progress in Physics. 79 (10): 106501. arXiv:1603.06858. Bibcode:2016RPPh...79j6501S. doi:10.1088/0034-4885/79/10/106501. PMID 27615689.
- Solli, D. R.; Chou, J.; Jalali, B. (2008). "Amplified wavelength–time transformation for real-time spectroscopy". Nature Photonics. 2 (1): 48–51. Bibcode:2008NaPho...2...48S. doi:10.1038/nphoton.2007.253.
- Chou, Jason; Solli, Daniel R.; Jalali, Bahram (2008). "Real-time spectroscopy with subgigahertz resolution using amplified dispersive Fourier transformation". Applied Physics Letters. 92 (11): 111102. arXiv:0803.1654. Bibcode:2008ApPhL..92k1102C. doi:10.1063/1.2896652.
- "Media advisory: Press Conference to Announce Major Result from Brazilian Astronomers". ESO Announcement. Retrieved 21 August 2013.
- Wang, Xiping; Wacker, James P. (2006). "Using NIR Spectroscopy to Predict Weathered Wood Exposure Times" (PDF). WTCE 2006 – 9th World Conference on Timber Engineering.
- Andrew Fraknoi; David Morrison (October 13, 2016). "OpenStax Astronomy".
References
- John M. Chalmers; Peter Griffiths, eds. (2006). Handbook of Vibrational Spectroscopy. New York: Wiley. doi:10.1002/0470027320. ISBN 978-0-471-98847-2.
- Jerry Workman; Art Springsteen, eds. (1998). Applied Spectroscopy. Boston: Academic Press. ISBN 978-0-08-052749-9.
- Peter M. Skrabal (2012). Spectroscopy - An interdisciplinary integral description of spectroscopy from UV to NMR (e-book). ETH Zurich: vdf Hochschulverlag AG. doi:10.3218/3385-4. ISBN 978-3-7281-3385-4.
External links
| Wikiquote has quotations related to: Spectroscopy |
| Look up spectroscopy in Wiktionary, the free dictionary. |
| Wikimedia Commons has media related to Spectroscopy. |
- Spectroscopy links at Curlie
- Amateur spectroscopy links at Curlie
- NIST Atomic Spectroscopy Databases
- MIT Spectroscopy Lab's History of Spectroscopy
- Timeline of Spectroscopy
- Spectroscopy: Reading the Rainbow
| Instrumentation |
|
|---|---|
| Techniques |
|
| Sampling |
|
| Calibration | |
| Prominent publications | |
| |
Branches of chemistry | |
|---|---|
| |
| Physical | |
| Organic | |
| Inorganic |
|
| Analytical | |
| Others | |
| See also | |
| |
| Authority control |
|
|---|