South Down (Assembly constituency)
South Down (Irish: An Dún Theas, Ulster Scots: Sooth Doon) is an electoral constituency for the Northern Ireland Assembly. It lies in the southern portion of County Down.
| South Down | |
|---|---|
| Northern Ireland Assembly Parliamentary Constituency | |
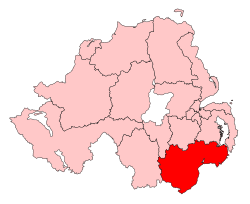 South Down shown within Northern Ireland | |
| Current constituency | |
| Created | 1973 |
| Seats | 6 (1996–2016) 5 (2017–) |
| MLAs |
|
| Districts | Newry, Mourne and Down District Council |
| EP constituency | Northern Ireland |
The seat was first used for a Northern Ireland-only election for the Northern Ireland Assembly in 1973. It usually shares the same boundaries as the South Down UK Parliament constituency, however the boundaries of the two constituencies were slightly different from 1983 to 1986 as the Assembly boundaries had not caught up with Parliamentary boundary changes and from 1996 to 1997 when members of the Northern Ireland Forum had been elected from the newly drawn Parliamentary constituencies but the 51st Parliament of the United Kingdom, elected in 1992 under the 1983–95 constituency boundaries, was still in session.
Members were then elected from the constituency to the 1975 Constitutional Convention, the 1982 Assembly, the 1996 Forum and then to the current Assembly from 1998.
Some of the most high-profile MLA's for the constituency have included Caitríona Ruane, Margaret Ritchie, and John McCallister.
For further details on the history and boundaries of the constituency, see South Down (UK Parliament constituency).
Members
| Election | MLA (Party) |
MLA (Party) |
MLA (Party) |
MLA (Party) |
MLA (Party) |
MLA (Party) |
MLA (Party) | |||||||
|---|---|---|---|---|---|---|---|---|---|---|---|---|---|---|
| 1973 | Patrick O'Donoghue (SDLP) |
Eddie McGrady (SDLP) |
Frank Feely (SDLP) |
Brian Faulkner (UUP/UPNI) |
Herbert Heslip (UUP) |
Ronald Broadhurst (UUP) |
Cecil Harvey (Vanguard) | |||||||
| 1975 | Peter Brush (UUP) | |||||||||||||
| 1982 | Raymond McCullough (UUP) |
William Brown (UUP) |
Jim Wells (DUP) |
George Graham (DUP) | ||||||||||
| 1985 by-election |
Jeffrey Donaldson (UUP) | |||||||||||||
| 1996 | Mick Murphy (Sinn Féin) |
Margaret Ritchie (SDLP) |
Hugh Carr (SDLP) |
Dermot Nesbitt (UUP) |
5 seats 1996–1998 | |||||||||
| 1998 | Eamon O'Neill (SDLP) |
P. J. Bradley (SDLP) |
Jim Wells (DUP) |
6 seats 1998–2017 | ||||||||||
| 2003 | Caitríona Ruane (Sinn Féin) |
Willie Clarke (Sinn Féin) |
Margaret Ritchie (SDLP) | |||||||||||
| 2007 | John McCallister (UUP/Independent) | |||||||||||||
| 2011 | Karen McKevitt (SDLP) | |||||||||||||
| April 2012 co-option |
Chris Hazzard (Sinn Féin) |
Seán Rogers (SDLP) | ||||||||||||
| 2016 | Colin McGrath (SDLP) |
Sinéad Bradley (SDLP) |
Harold McKee (UUP) | |||||||||||
| 2017 | Sinéad Ennis (Sinn Féin) |
5 seats 2017–present |
5 seats 2017–present | |||||||||||
| June 2017 co-option |
Emma Rogan (Sinn Féin) | |||||||||||||
Note: The columns in this table are used only for presentational purposes, and no significance should be attached to the order of columns. For details of the order in which seats were won at each election, see the detailed results of that election.
Elections
Northern Ireland Assembly
2017
| 2017 Assembly election: South Down – 5 Seats[1] | ||||||||||
|---|---|---|---|---|---|---|---|---|---|---|
| Party | Candidate | FPv% | Count 1 | Count 2 | Count 3 | Count 4 | Count 5 | Count 6 | ||
| Sinn Féin | Sinéad Ennis | 20.8 | 10,256 | |||||||
| Sinn Féin | Chris Hazzard | 17.9 | 8,827 | |||||||
| SDLP | Sinéad Bradley | 14.8 | 7,323 | 7,487 | 8,906.12 | |||||
| DUP | Jim Wells | 15.8 | 7,786 | 8,088 | 8,091.36 | 8,091.64 | 10,821.64 | |||
| SDLP | Colin McGrath | 10.3 | 5,110 | 5,202 | 5,512.80 | 6,043.68 | 6,632.42 | 7,228.42 | ||
| Alliance | Patrick Brown | 9.2 | 4,535 | 4,883 | 5,101.64 | 5,194.88 | 6,007.82 | 6,730.82 | ||
| UUP | Harold McKee | 8.4 | 4,172 | 4,509 | 4,522.44 | 4,527.76 | ||||
| TUV | Lyle Rea | 1.3 | 630 | |||||||
| Green (NI) | Hannah George | 1.0 | 483 | |||||||
| Independent | Patrick Clarke | 0.4 | 192 | |||||||
| NI Conservatives | Gary Hynds | 0.2 | 85 | |||||||
| Electorate: 75,415 Valid: 49,399 Spoilt: 535 (1.07%) Quota: 8,234 Turnout: 49,932 (66.21%) | ||||||||||
2016
| 2016 Assembly election: South Down – 6 Seats | ||||||||||||
|---|---|---|---|---|---|---|---|---|---|---|---|---|
| Party | Candidate | FPv% | Count 1 | Count 2 | Count 3 | Count 4 | Count 5 | Count 6 | Count 7 | Count 8 | ||
| DUP | Jim Wells | 12.3 | 5,033 | 5,183 | 6,470 | |||||||
| UUP | Harold McKee | 8.5 | 3,481 | 3,812 | 5,168 | 5,567 | 6,141 | |||||
| Sinn Féin | Chris Hazzard | 12.3 | 5,045 | 5,142 | 5,144 | 5,321 | 5,321.50 | 7,277.50 | ||||
| SDLP | Sinéad Bradley | 12.3 | 5,059 | 5,231 | 5,241 | 5,828 | 5,834 | 6,144 | ||||
| Sinn Féin | Caitríona Ruane | 10.2 | 4,191 | 4,240 | 4,244 | 4,335 | 4,335 | 5,415 | 6,664.50 | |||
| SDLP | Colin McGrath | 10.4 | 4,288 | 4,429 | 4,440 | 5,033 | 5,038 | 5,121 | 5,190 | 5,397 | ||
| SDLP | Seán Rogers | 8.7 | 3,564 | 3,699 | 3,721 | 4,076 | 4,086.50 | 4,227.50 | 4,309 | 4,595.75 | ||
| Sinn Féin | Michael Gray-Sloan | 8.6 | 3,520 | 3,571 | 3,572 | 3,665 | 3,665 | |||||
| Alliance | Patrick Brown | 5.4 | 2,200 | 2,841 | 2,869 | |||||||
| TUV | Henry Reilly | 6.6 | 2,718 | 2,800 | ||||||||
| Independent | John McCallister | 2.8 | 1,156 | |||||||||
| Green (NI) | John Hardy | 2.0 | 820 | |||||||||
| Electorate: 77,409 Valid: 41,075 Spoilt: 570 (1.37%) Quota: 5,868 Turnout: 53.80% | ||||||||||||
2011
| 2011 Assembly Election: South Down - 6 seats | |||||||||||||
|---|---|---|---|---|---|---|---|---|---|---|---|---|---|
| Party | Candidate | FPv% | Count 1 | Count 2 | Count 3 | Count 4 | Count 5 | Count 6 | Count 7 | Count 8 | Count 9 | ||
| SDLP | Margaret Ritchie | 20.4 | 8,506 | ||||||||||
| Sinn Féin | Caitríona Ruane | 14.3 | 5,955 | 6,192.15 | |||||||||
| DUP | Jim Wells | 12.5 | 5,200 | 5,284.84 | 5,354.56 | 5,404.28 | 6,543.28 | ||||||
| UUP | John McCallister | 10.6 | 4,409 | 4,480.92 | 4,624.88 | 4,714.77 | 5,679.90 | 6,329.60 | |||||
| Sinn Féin | Willie Clarke | 9.3 | 3,882 | 3,957.95 | 3,992.50 | 4,094.15 | 4,101.46 | 4,103.20 | 6,777.20 | ||||
| SDLP | Karen McKevitt | 9.0 | 3,758 | 4,318.79 | 4,432.71 | 4,675.33 | 4,702.43 | 4,707.27 | 4,842.93 | 5,277.28 | 5,347.46 | ||
| SDLP | Eamon O'Neill | 6.4 | 2,633 | 3,844.72 | 3,959.19 | 4,222.77 | 4,251.35 | 4,259.47 | 4,449.46 | 4,826.14 | 4,882.98 | ||
| Sinn Féin | Naomi Bailie | 7.3 | 3,050 | 3,150.44 | 3,161.06 | 3,305.46 | 3,306.77 | 3,308.51 | |||||
| UKIP | Henry Reilly | 5.6 | 2,322 | 2,353.29 | 2,373.70 | 2,398.94 | |||||||
| Green (NI) | Cadogan Enright | 2.7 | 1,107 | 1,227.28 | 1,238.75 | ||||||||
| Alliance | David Griffin | 2.1 | 864 | 915.15 | |||||||||
| Electorate: 73,240 Valid: 41,276 Spoilt: 825 (1.94%) Quota: 5,961 Turnout: 58.10% | |||||||||||||
2007
| 2007 Assembly Election: South Down - 6 seats | |||||||||||||||
|---|---|---|---|---|---|---|---|---|---|---|---|---|---|---|---|
| Party | Candidate | FPv% | Count 1 | Count 2 | Count 3 | Count 4 | Count 5 | Count 6 | Count 7 | Count 8 | Count 9 | Count 10 | Count 11 | ||
| Sinn Féin | Caitríona Ruane | 13.7 | 6,334 | 6,336 | 6,337 | 6,337 | 6,428 | 6,450 | 6,676 | ||||||
| Sinn Féin | Willie Clarke | 11.1 | 5,138 | 5,145 | 5,152 | 5,154 | 5,259 | 5,273 | 5,412 | 7,382 | |||||
| SDLP | Margaret Ritchie | 12.7 | 5,838 | 5,870 | 5,887 | 5,892 | 6,026 | 6,055 | 6,429 | 6,945 | |||||
| SDLP | P. J. Bradley | 12.3 | 5,652 | 5,662 | 5,682 | 5,684 | 5,772 | 5,829 | 6,190 | 6,286 | 6,650.32 | ||||
| DUP | Jim Wells | 12.0 | 5,542 | 5,546 | 5,605 | 5,763 | 5,792 | 6,188 | 6,240 | 6,248 | 6,250.97 | 8,462.97 | |||
| UUP | John McCallister | 9.6 | 4,447 | 4,448 | 4,553 | 4,637 | 4,819 | 5,230 | 5,370 | 5,377 | 5,384.92 | 6,046.91 | 7,720.91 | ||
| SDLP | Michael Carr | 6.4 | 2,972 | 2,976 | 2,986 | 2,989 | 3,062 | 3,093 | 3,354 | 3,422 | 3,830.87 | 3,853.87 | 3,882.87 | ||
| DUP | William Burns | 5.7 | 2,611 | 2,613 | 2,667 | 2,721 | 2,741 | 3,040 | 3,061 | 3,062 | 3,064.97 | ||||
| Sinn Féin | Eamonn McConvey | 5.8 | 2,662 | 2,678 | 2,679 | 2,679 | 2,703 | 2,703 | 2,778 | ||||||
| Green (NI) | Ciaran Mussen | 3.5 | 1,622 | 1,646 | 1,675 | 1,685 | 2,008 | 2,043 | |||||||
| UKIP | Henry Reilly | 2.7 | 1,229 | 1,229 | 1,239 | 1,326 | 1,354 | ||||||||
| Alliance | David Griffin | 1.5 | 691 | 700 | 743 | 755 | |||||||||
| Independent Republican | Martin Cunningham | 0.9 | 434 | 441 | 448 | 448 | |||||||||
| UK Unionist | Frederick Wharton | 0.9 | 424 | 424 | 443 | ||||||||||
| NI Conservatives | Peter Bowles | 0.8 | 391 | 391 | |||||||||||
| Labour Party NI | Malachi Curran | 0.3 | 123 | ||||||||||||
| Electorate: 71,704 Valid: 46,110 Spoilt: 513 (1.10%) Quota: 6,588 Turnout: 65.02% | |||||||||||||||
2003
| 2003 Assembly Election: South Down - 6 seats | |||||||||||||
|---|---|---|---|---|---|---|---|---|---|---|---|---|---|
| Party | Candidate | FPv% | Count 1 | Count 2 | Count 3 | Count 4 | Count 5 | Count 6 | Count 7 | Count 8 | Count 9 | ||
| DUP | Jim Wells | 15.0 | 6,789 | ||||||||||
| SDLP | P. J. Bradley | 11.8 | 5,337 | 5,337.36 | 5,355.36 | 5,682.96 | 7,136.96 | ||||||
| UUP | Dermot Nesbitt | 11.8 | 5,368 | 5,411 | 5,420 | 5,759.04 | 5,797.20 | 5,802.72 | 5,822.72 | 8,325.72 | |||
| Sinn Féin | Caitríona Ruane | 11.3 | 5,118 | 5,118 | 5,124 | 5,211.08 | 5,415.08 | 5,450.04 | 6,024.42 | 6,026.54 | 6,035.54 | ||
| Sinn Féin | Willie Clarke | 9.0 | 4,083 | 4,083.08 | 4,092.08 | 4,185.16 | 4,268.20 | 4,278.78 | 5,920.74 | 5,926.44 | 5,934.44 | ||
| SDLP | Margaret Ritchie | 9.4 | 4,261 | 4,261.76 | 4,313.76 | 4,665.32 | 4,848.36 | 4,921.50 | 5,419.96 | 5,477.96 | 5,733.96 | ||
| SDLP | Eamon O'Neill | 8.7 | 3,942 | 3,942.92 | 3,963.92 | 4,220.24 | 4,692.32 | 5,215.34 | 5,350.34 | 5,411.52 | 5,697.52 | ||
| UUP | Jim Donaldson | 6.4 | 2,885 | 2,984.52 | 2,989.52 | 3,254.96 | 3,264.12 | 3,265.96 | 3,269.42 | ||||
| Sinn Féin | Eamonn McConvey | 6.2 | 2,806 | 2,806.12 | 2,833.12 | 2,961.16 | 2,986.16 | 2,990.30 | |||||
| SDLP | Marion Fitzpatrick | 5.3 | 2,382 | 2,382.44 | 2,409.44 | 2,555.64 | |||||||
| Green (NI) | Raymond Blaney | 1.8 | 799 | 799.76 | 851.76 | ||||||||
| NI Women's Coalition | Trudy Miller | 1.2 | 565 | 565.60 | 589.60 | ||||||||
| Alliance | Neil Powell | 1.1 | 489 | 489.48 | 495.48 | ||||||||
| UK Unionist | Nelson Wharton | 0.5 | 245 | 360.64 | 362.72 | ||||||||
| Independent | Malachi Curran | 0.4 | 162 | 162.08 | |||||||||
| Workers' Party | Desmond O'Hagan | 0.3 | 115 | 115.08 | |||||||||
| Electorate: 70,149 Valid: 45,346 Spoilt: 666 Quota: 6,479 Turnout: 46,012 (65.6) | |||||||||||||
1998
| 1998 Assembly Election: South Down - 6 seats | |||||||||||||||
|---|---|---|---|---|---|---|---|---|---|---|---|---|---|---|---|
| Party | Candidate | FPv% | Count 1 | Count 2 | Count 3 | Count 4 | Count 5 | Count 6 | Count 7 | Count 8 | Count 9 | Count 10 | Count 11 | ||
| SDLP | Eddie McGrady | 20.2 | 10,373 | ||||||||||||
| Sinn Féin | Mick Murphy | 12.2 | 6,251 | 6,418.33 | 6,514.51 | 6,517.51 | 6,574.08 | 7,761.08 | |||||||
| UUP | Dermot Nesbitt | 10.7 | 5,480 | 5,507.84 | 5,524.03 | 5,788.90 | 6,133.54 | 6,137.99 | 6,137.99 | 7,770.99 | |||||
| SDLP | P. J. Bradley | 10.8 | 5,571 | 6,218.28 | 6,313.44 | 6,317.31 | 6,485.16 | 6,563.40 | 6,665.52 | 6,716.39 | 6,739.49 | 7,390.23 | |||
| DUP | Jim Wells | 9.4 | 4,826 | 4,830.06 | 4,840.35 | 5,261.35 | 5,270.35 | 5,272.35 | 5,273.27 | 5,631.85 | 5,792.85 | 5,849.34 | 8,170.34 | ||
| SDLP | Eamon O'Neill | 7.0 | 3,582 | 4,752.73 | 4,889.94 | 4,892.52 | 5,006.57 | 5,144.92 | 5,289.36 | 5,323.39 | 5,342.29 | 6,120.06 | 6,163.20 | ||
| SDLP | Hugh Carr | 7.3 | 3,731 | 4,132.36 | 4,230.24 | 4,232.24 | 4,379.71 | 4,438.47 | 4,501.03 | 4,517.90 | 4,528.40 | 5,114.14 | 5,186.72 | ||
| UK Unionist | Frederick Wharton | 5.0 | 2,576 | 2,577.16 | 2,581.16 | 2,886.45 | 2,904.74 | 2,905.74 | 2,906.20 | 3,125.36 | 3,271.66 | 3,313.71 | |||
| NI Women's Coalition | Anne Carr | 3.2 | 1,658 | 1,811.41 | 2,000.03 | 2,009.32 | 2,563.74 | 2,675.11 | 2,785.05 | 2,890.12 | 2,955.57 | ||||
| UUP | Norman Hanna | 3.8 | 1,939 | 1,946.83 | 1,962.28 | 2,481.15 | 2,642.73 | 2,646.73 | 2,647.65 | ||||||
| Sinn Féin | Garret O'Fachtna | 3.0 | 1,520 | 1,603.81 | 1,697.41 | 1,697.70 | 1,716.73 | ||||||||
| Alliance | Anne-Marie Cunningham | 2.9 | 1,502 | 1,586.39 | 1,675.63 | 1,697.50 | |||||||||
| Independent Unionist | George Graham | 3.0 | 1,562 | 1,567.51 | 1,578.51 | ||||||||||
| Labour Party NI | Malachi Curran | 1.0 | 498 | 634.01 | |||||||||||
| Workers' Party | Des O'Hagan | 0.2 | 130 | 151.17 | |||||||||||
| Independent Labour | Patrick O'Connor | 0.2 | 121 | 148.84 | |||||||||||
| Natural Law | Thomas Mullins | 0.1 | 33 | 38.51 | |||||||||||
| Electorate: 71,027 Valid: 51,353 Spoilt: 989 (1.89%) Quota: 7,337 Turnout: 73.69% | |||||||||||||||
1996 Forum
Successful candidates are shown in bold.[2]
| Party | Candidate(s) | Votes | Percentage | |
|---|---|---|---|---|
| SDLP | Eddie McGrady Hugh Carr Margaret Ritchie Marietta Farrell John Doris |
20,220 | 43.2 | |
| UUP | Dermot Nesbitt Frederick Wharton Gerry Douglas Albert Colmer William Martin |
10,379 | 22.2 | |
| Sinn Féin | Mick Murphy Frank McDowell Martin Gough Deidre Clark |
6,142 | 13.1 | |
| DUP | William Alexander John Finlay William Burns |
5,060 | 10.8 | |
| Alliance | Julian Crozier Michael Healy |
1,685 | 3.6 | |
| Labour coalition | Malachi Curran Patrick O'Connor Edna Furey James Masson Michael Kearney |
927 | 2.0 | |
| PUP | George Graham James McDonald |
497 | 1.1 | |
| NI Women's Coalition | Bronagh Lawson Claire Hannah Lynn Carvill Ursula Leahy |
464 | 1.0 | |
| Ulster Democratic | Norma Coulter Denis Paisley |
404 | 0.9 | |
| Green (NI) | Maggie Burch Eugene O'Shea Christopher Busby |
251 | 0.6 | |
| NI Conservatives | Paul Megarity Michael Henderson |
197 | 0.4 | |
| Workers' Party | Marie O'Hagan Eddie O'Hagan |
162 | 0.4 | |
| Ulster Independence | Samuel Pollock Stanley Watson James McElrath |
130 | 0.3 | |
| Democratic Partnership | William Leneghan Sean O'Baoill |
117 | 0.2 | |
| Democratic Left | Veronica McEneaney Jim Ryan |
65 | 0.1 | |
| Natural Law | Desmond Garrett William McCarthy |
30 | 0.1 | |
| Independent Chambers | George Chambers Doreen Larmour |
18 | 0.0 | |
1985 by-election
| 17 October 1985 by-election: South Down - 1 seat | |||||
|---|---|---|---|---|---|
| Party | Candidate | FPv% | Count 1 | ||
| UUP | Jeffrey Donaldson | 86.1% | 17,528 | ||
| Independent Unionist | Ethel Smyth | 13.9% | 2,838 | ||
| Electorate: 98,126 Valid: 20,366 Spoilt: 0 Quota: 10,184 Turnout: 20,366 (21.3%) | |||||
1982
| 1982 Assembly election: South Down - 7 seats | ||||||||||||||
|---|---|---|---|---|---|---|---|---|---|---|---|---|---|---|
| Party | Candidate | FPv% | Count 1 | Count 2 | Count 3 | Count 4 | Count 5 | Count 6 | Count 7 | Count 8 | Count 9 | Count 10 | ||
| SDLP | Frank Feely | 12.5% | 7,391 | |||||||||||
| SDLP | Eddie McGrady | 12.4% | 7,313 | 7,636 | ||||||||||
| UUP | William Brown | 8.8% | 5,220 | 5,227 | 5,234 | 5,441 | 7,593 | |||||||
| SDLP | Patrick O'Donoghue | 10.0% | 5,916 | 6,252 | 6,440 | 6,449 | 6,455 | 8,181 | ||||||
| UUP | Raymond McCullough | 9.8% | 5,802 | 5,808 | 5,809 | 5,903 | 6,451 | 6,458 | 6,471 | 6,497 | 9,553 | |||
| DUP | George Graham | 6.9% | 4,075 | 4,081 | 4,082 | 5,366 | 5,533 | 5,543 | 5,548 | 5,552 | 6,518 | 7,596 | ||
| DUP | Jim Wells | 6.4% | 3,779 | 3,783 | 3,783 | 5,361 | 5,474 | 5,488 | 5,503 | 5,505 | 5,663 | 5,937 | ||
| Alliance | Patrick Forde | 6.2% | 3,646 | 3,999 | 4,027 | 4,047 | 4,148 | 4,346 | 4,707 | 4,709 | 4,879 | 5,101 | ||
| UUP | William Coulter | 6.4% | 3,787 | 3,794 | 3,795 | 3,828 | 4,490 | 4,497 | 4,508 | 4,663 | ||||
| Sinn Féin | Cyril Toman | 5.7% | 3,393 | 3,772 | 3,795 | 3,805 | 3,806 | |||||||
| UUP | William Martin | 6.0% | 3,562 | 3,567 | 3,568 | 3,798 | ||||||||
| DUP | Ethel Smyth | 5.9% | 3,495 | 3,507 | 3,508 | |||||||||
| Workers' Party | Thomas Moore | 2.8% | 1,676 | |||||||||||
| Electorate: 93,261 Valid: 59,055 Spoilt: 2,137 (3.49%) Quota: 7,382 Turnout: 61,192 (65.6%) | ||||||||||||||
1975 Constitutional Convention
| 1975 Constitutional Convention: South Down - 7 seats | |||||||||||||
|---|---|---|---|---|---|---|---|---|---|---|---|---|---|
| Party | Candidate | FPv% | Count 1 | Count 2 | Count 3 | Count 4 | Count 5 | Count 6 | Count 7 | Count 8 | Count 9 | ||
| SDLP | Frank Feely | 16.0 | 9,730 | ||||||||||
| Vanguard | Cecil Harvey | 14.6 | 8,843 | ||||||||||
| SDLP | Eddy McGrady | 11.9 | 7,257 | 8,560.28 | |||||||||
| SDLP | Patrick O'Donoghue | 11.0 | 6,657 | 7,335.26 | 7,336.52 | 8,231.08 | |||||||
| Unionist Party NI | Brian Faulkner | 9.9 | 6,035 | 6,048.20 | 6,075.78 | 6,078.50 | 6,114.34 | 6,127.14 | 6,608.72 | 6,687.12 | 8,512.12 | ||
| UUP | Peter Brush | 10.4 | 6,293 | 6,294.32 | 6,520.56 | 6,520.46 | 6,520.46 | 6,520.56 | 6,813.24 | 6,891.16 | 6,995 | ||
| UUP | Herbert Heslip | 10.5 | 6,380 | 6,384.84 | 6,643.70 | 6,643.86 | 6,644.50 | 6,645.72 | 6,726.26 | 6,736.72 | 6,838.18 | ||
| DUP | David Herron | 6.2 | 3,752 | 3,757.28 | 4,464 | 4,464.16 | 4,464.16 | 4,465.16 | 4,536.28 | 4,552.50 | 4,624.66 | ||
| Alliance | Anthony Williamson | 2.7 | 1,612 | 1,659.96 | 1,660.24 | 1,676.08 | 1,882.80 | 1,931.02 | 1,937.46 | 2,136.46 | |||
| Alliance | Denys Rowan-Hamilton | 2.5 | 1,509 | 1,518.02 | 1,520.82 | 1,529.46 | 1,678.42 | 1,714.02 | 1,757.02 | 1,950.58 | |||
| Republican Clubs | Raymond Blaney | 1.6 | 1,002 | 1,018.50 | 1,018.64 | 1,022.16 | 1,056.72 | 1,672.28 | 1,673.50 | ||||
| Unionist Party NI | Ronald Broadhurst | 1.6 | 994 | 995.1 | 1,001.96 | 1,002.44 | 1,007.08 | 1,007.08 | |||||
| Republican Clubs | Gerard O'Hanlon | 1.1 | 680 | 706.18 | 706.18 | 721.38 | 843.30 | ||||||
| Electorate: 89,912 Valid: 60,744 Spoilt: 2,129 (3.39%) Quota: 7,594 Turnout: 62,873 (69.93%) | |||||||||||||
1973
| 1973 Assembly election: South Down - 7 seats | |||||||||||||||||||||
|---|---|---|---|---|---|---|---|---|---|---|---|---|---|---|---|---|---|---|---|---|---|
| Party | Candidate | FPv% | Count 1 | Count 2 | Count 3 | Count 4 | Count 5 | Count 6 | Count 7 | Count 8 | Count 9 | Count 10 | Count 11 | Count 12 | Count 13 | Count 14 | Count 15 | Count 16 | Count 17 | ||
| UUP | Brian Faulkner | 25.4 | 16,287 | ||||||||||||||||||
| SDLP | Eddy McGrady | 12.3 | 7,870 | 7,894.99 | 7,913.50 | 7,926.50 | 7,927.50 | 7,972.01 | 8,050.01 | ||||||||||||
| UUP | Ronald Broadhurst | 2.4 | 1,515 | 6,049.41 | 6,075.02 | 6,075.02 | 6,266.74 | 6,268.25 | 6,270.27 | 6,273.78 | 6,344.42 | 6,370.62 | 6,374.13 | 9,108.64 | |||||||
| SDLP | Frank Feely | 10.7 | 6,857 | 6,869.24 | 6,895.75 | 6,929.75 | 6,931.75 | 6,949.75 | 7,055.75 | 7,344.75 | 7,352.75 | 7,422.77 | 7,759.77 | 7,761.28 | 7,762.30 | 9,190.30 | |||||
| SDLP | Patrick O'Donoghue | 6.7 | 4,322 | 4,327.10 | 4,343.10 | 4,346.10 | 4,347.10 | 4,406.10 | 4,507.61 | 4,608.61 | 4,630.14 | 4,745.65 | 5,709.65 | 5,711.65 | 5,712.67 | 7,180.69 | 8,225.69 | ||||
| Vanguard | Cecil Harvey | 7.8 | 5,006 | 5,435.42 | 5,442.42 | 5,445.42 | 5,672.17 | 5,672.17 | 5,678.68 | 5,682.68 | 5,689.23 | 5,689.23 | 5,691.23 | 5,931.58 | 6,095.29 | 6,099.29 | 6,102.29 | 6,105.59 | 9,485.59 | ||
| UUP | Herbert Heslip | 6.0 | 3,838 | 4,709.08 | 4,715.61 | 4,715.61 | 4,758.81 | 4,760.81 | 4,765.81 | 4,768.83 | 4,776.87 | 4,779.89 | 4,780.89 | 5,360.47 | 5,960.23 | 5,967.27 | 5,969.27 | 5,971.25 | 7,177.36 | ||
| Alliance | Anthony Williamson | 2.3 | 1,489 | 1,519.09 | 1,543.09 | 1,546.09 | 1,548.09 | 1,550.09 | 1,590.09 | 1,598.09 | 2,283.30 | 4,155.98 | 4,261.49 | 4,296.77 | 4,398.26 | 4,664.77 | 4,711.77 | 4,923.63 | 4,954.50 | ||
| DUP | David Herron | 6.3 | 4,016 | 4,327.61 | 4,332.12 | 4,332.12 | 4,453.81 | 4,453.81 | 4,461.81 | 4,464.81 | 4,471.32 | 4,471.83 | 4,473.83 | 4,666.69 | 4,811.02 | 4,816.02 | 4,818.02 | 4,819.34 | |||
| Independent | Rory McShane | 4.3 | 2,785 | 2,790.10 | 2,799.61 | 2,827.61 | 2,827.61 | 2,881.61 | 2,979.61 | 3,312.12 | 3,325.63 | 3,340.14 | 4,059.14 | 4,061.14 | 4,061.14 | ||||||
| UUP | William Martin | 3.1 | 1,996 | 3,760.60 | 3,766.11 | 3,766.11 | 3,810.74 | 3,812.74 | 3,817.27 | 3,820.82 | 3,851.08 | 3,865.12 | 3,865.12 | ||||||||
| Independent Republican | James O'Reilly | 3.1 | 2,000 | 2,001.02 | 2,008.02 | 2,016.02 | 2,018.02 | 2,092.02 | 2,268.53 | 2,397.53 | 2,405.04 | 2,447.04 | |||||||||
| Alliance | Michael O'Shea | 2.3 | 1,475 | 1,503.05 | 1,557.09 | 1,558.09 | 1,561.09 | 1,565.09 | 1,588.60 | 1,605.60 | 2,209.04 | ||||||||||
| Alliance | Denys Rowan-Hamilton | 2.1 | 1,316 | 1,428.20 | 1,464.26 | 1,465.26 | 1,467.77 | 1,468.77 | 1,480.28 | 1,483.28 | |||||||||||
| Republican Clubs | Noel Collins | 1.0 | 648 | 652.08 | 652.08 | 959.08 | 965.08 | 1,378.08 | 1,402.10 | ||||||||||||
| Independent | Arthur Doran | 1.0 | 653 | 658.10 | 678.61 | 686.63 | 696.14 | 705.14 | |||||||||||||
| Republican Clubs | Edward O'Hagan | 1.0 | 612 | 613.02 | 614.02 | 695.02 | 695.53 | ||||||||||||||
| National Front | William Annett | 0.9 | 591 | 668.52 | 672.52 | 672.52 | |||||||||||||||
| Republican Clubs | Samuel Dowling | 0.8 | 499 | 499 | 502.02 | ||||||||||||||||
| Ulster Liberal | Berkley Farr | 0.4 | 263 | 279.32 | |||||||||||||||||
| Electorate: 89,234 Valid: 64,038 Spoilt: 1,359 Quota: 8,005 Turnout: 65,397 (73.2%) | |||||||||||||||||||||
References
- "Statement of Persons Nominated". EONI. Retrieved 8 February 2017.
- 1996 Candidates – South Down, Northern Ireland Elections
| Assembly |   | |
|---|---|---|
| Committees | ||
| Constituencies | ||
| Parties | Current:
| |
| Elections | ||
| Members |
| |
| Procedure | ||
| See also | ||