South Antrim (Assembly constituency)
South Antrim (Irish: Aontroim Theas, Ulster Scots: Sooth Anthrim) is a constituency in the Northern Ireland Assembly.
| South Antrim | |
|---|---|
| Northern Ireland Assembly Parliamentary Constituency | |
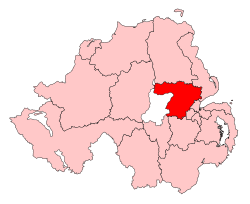 South Antrim shown within Northern Ireland | |
| Current constituency | |
| Created | 1973 |
| Seats | 6 (1996–2016) 5 (2017–) |
| MLAs |
|
| Districts | Antrim and Newtownabbey Borough Council Lisburn and Castlereagh City Council |
| EP constituency | Northern Ireland |
The seat was first used for a Northern Ireland-only election for the Northern Ireland Assembly, 1973. It usually shares boundaries with the South Antrim UK Parliament constituency, however the boundaries of the two constituencies were slightly different from 1983 to 1986 as the Assembly boundaries had not caught up with Parliamentary boundary changes and from 1996 to 1997 when members of the Northern Ireland Forum had been elected from the newly drawn Parliamentary constituencies but the 51st Parliament of the United Kingdom, elected in 1992 under the 1983–95 constituency boundaries, was still in session.
Members were then elected from the constituency to the 1975 Constitutional Convention, the 1982 Assembly, the 1996 Forum and then to the current Assembly from 1998.
For further details of the history and boundaries of the constituency, see South Antrim (UK Parliament constituency).
Members
Note: The columns in this table are used only for presentational purposes, and no significance should be attached to the order of columns. For details of the order in which seats were won at each election, see the detailed results of that election.
Elections
Northern Ireland Assembly
2017
| 2017 Assembly election: South Antrim - 5 seats[1] | ||||||||||||
|---|---|---|---|---|---|---|---|---|---|---|---|---|
| Party | Candidate | FPv% | Count 1 | Count 2 | Count 3 | Count 4 | Count 5 | Count 6 | Count 7 | Count 8 | ||
| Sinn Féin | Declan Kearney | 16.3 | 6,891 | 6,895 | 6,925 | 7,065 | ||||||
| UUP | Stephen Aiken | 14.8 | 6,287 | 6,326 | 6,368 | 6,494 | 8,808 | |||||
| Alliance | David Ford | 12.5 | 5,278 | 5,313 | 5,494 | 5,990 | 6,222 | 6,767.56 | 9,861.56 | |||
| DUP | Paul Girvan | 12.2 | 5,152 | 5,164 | 5,165 | 5,223 | 5,576 | 5,799.56 | 5,872.64 | 5,969.64 | ||
| DUP | Pam Cameron | 10.9 | 4,604 | 4,613 | 4,624 | 4,644 | 4,979 | 5,357.12 | 5,458.92 | 5,678.92 | ||
| DUP | Trevor Clarke | 10.7 | 4,522 | 4,540 | 4,545 | 4,559 | 4,995 | 5,358.40 | 5,445.40 | 5,527.40 | ||
| SDLP | Roisin Lynch | 9.5 | 4,024 | 4,035 | 4,069 | 4,229 | 4,360 | 4,595.52 | ||||
| UUP | Adrian Cochrane-Watson | 5.9 | 2,505 | 2,525 | 2,531 | 2,583 | ||||||
| TUV | Richard Cairns | 3.2 | 1,353 | 1,369 | 1,378 | 1,409 | ||||||
| People Before Profit | Ivanka Antova | 1.3 | 530 | 535 | 658 | |||||||
| Independent | David McMaster | 1.2 | 503 | 517 | 563 | |||||||
| Green (NI) | Eleanor Bailey | 1.2 | 501 | 504 | ||||||||
| NI Conservatives | Mark Logan | 0.5 | 194 | |||||||||
| Electorate: 68,475 Valid: 42,344 Spoilt: 382 (0.89%) Quota: 7,058 Turnout: 62.4% (42,726) | ||||||||||||
2016
| 2016 Assembly election: South Antrim - 6 seats | |||||||||||
|---|---|---|---|---|---|---|---|---|---|---|---|
| Party | Candidate | FPv% | Count 1 | Count 2 | Count 3 | Count 4 | Count 5 | Count 6 | Count 7 | ||
| DUP | Paul Girvan | 14.3 | 5,014 | 5,036 | |||||||
| DUP | Pam Cameron | 13.1 | 4,589 | 4,606 | 4,704 | 5,003 | 5,067 | ||||
| Sinn Féin | Declan Kearney | 13.2 | 4,632 | 4,654 | 4,737 | 4,737 | 4,739 | 6,207 | |||
| Alliance | David Ford | 8.9 | 3,119 | 3,249 | 3,639 | 3,671 | 3,764 | 5,056 | |||
| UUP | Stephen Aiken | 9.3 | 3,280 | 3,342 | 3,439 | 3,757 | 4,403 | 4,452 | 4,512 | ||
| DUP | Trevor Clarke | 10.2 | 3,585 | 3,598 | 3,668 | 3,978 | 4,212 | 4,286 | 4,338 | ||
| UUP | Paul Michael | 7.3 | 2,565 | 2,617 | 2,699 | 2,848 | 3,914 | 4,031 | 4,127 | ||
| SDLP | Roisin Lynch | 9.6 | 3,366 | 3,400 | 3,515 | 3,526 | 3,547 | ||||
| UUP | Adrian Cochrane-Watson | 5.5 | 1,947 | 1,964 | 2,001 | 2,200 | |||||
| TUV | Richard Cairns | 3.8 | 1,318 | 1,330 | 1,505 | ||||||
| Green (NI) | Helen Farley | 1.7 | 589 | 689 | |||||||
| UKIP | Robert Hill | 1.6 | 574 | 599 | |||||||
| Independent | David McMaster | 1.4 | 483 | ||||||||
| NI Conservatives | Mark Young | 0.2 | 72 | ||||||||
| Electorate: 69,680 Valid: 35,133 Spoilt: 411 (1.16%) Quota: 5,020 Turnout: 35,544 (51.01%) | |||||||||||
2011
| 2011 Assembly election: South Antrim - 6 seats | ||||||||
|---|---|---|---|---|---|---|---|---|
| Party | Candidate | FPv% | Count 1 | Count 2 | Count 3 | Count 4 | ||
| DUP | Paul Girvan | 15.1 | 4,844 | |||||
| Sinn Féin | Mitchel McLaughlin | 14.5 | 4,662 | |||||
| DUP | Trevor Clarke | 14.3 | 4,607 | |||||
| Alliance | David Ford | 14.5 | 4,544 | 4,660 | ||||
| UUP | Danny Kinahan | 10.7 | 3,445 | 3,826 | 5,585 | |||
| DUP | Pam Lewis | 8.9 | 2,866 | 3,329 | 3,797 | 4,668.24 | ||
| SDLP | Thomas Burns | 10.6 | 3,406 | 3,436 | 3,482 | 3,590.56 | ||
| UUP | Adrian Cochrane-Watson | 7.1 | 2,285 | 2,568 | ||||
| TUV | Mel Lucas | 3.4 | 1,091 | |||||
| BNP | Stephen Parkes | 1.3 | 404 | |||||
| Electorate: 65,231 Valid: 32,164 Spoilt: 488 (1.49%) Quota: 4,595 Turnout: 32,652 (50.06%) | ||||||||
2007
| 2007 Assembly election: South Antrim - 6 seats | ||||||||||||
|---|---|---|---|---|---|---|---|---|---|---|---|---|
| Party | Candidate | FPv% | Count 1 | Count 2 | Count 3 | Count 4 | Count 5 | Count 6 | Count 7 | Count 8 | ||
| Sinn Féin | Mitchel McLaughlin | 16.5 | 6,313 | |||||||||
| DUP | William McCrea | 15.8 | 6,023 | |||||||||
| Alliance | David Ford | 13.1 | 5,007 | 5,036.55 | 5,048.07 | 5,322.04 | 5,495.04 | |||||
| UUP | David Burnside | 11.8 | 4,507 | 4,508.20 | 4,539.07 | 4,587.40 | 5,108.97 | 5,134.41 | 6926.41 | |||
| DUP | Trevor Clarke | 11.3 | 4,302 | 4,302.75 | 4,497.42 | 4,527.02 | 4,762.07 | 4,768.31 | 5,087.71 | 5,543.71 | ||
| SDLP | Thomas Burns | 7.1 | 2,721 | 3,080.70 | 3,081.33 | 3,188.08 | 3,206.56 | 4,965.51 | 5,133.94 | 5,395.94 | ||
| DUP | Mel Lucas | 7.4 | 2,840 | 2,840.30 | 3,117.68 | 3,143.22 | 3,351.18 | 3,360.93 | 3,805.79 | 4,228.79 | ||
| UUP | Danny Kinahan | 6.3 | 2,391 | 2,392.95 | 2,400.15 | 2,451.24 | 3,107.04 | 3,130.48 | ||||
| SDLP | Noreen McClelland | 4.0 | 1,526 | 1,897.70 | 1,898.06 | 2,012.36 | 2,025.66 | |||||
| UUP | Stephen Nicholl | 2.4 | 927 | 928.20 | 933.42 | 969.72 | ||||||
| UK Unionist | Robert McCartney | 2.3 | 893 | 893.30 | 902.48 | 932.02 | ||||||
| Green (NI) | Pete Whitcroft | 1.3 | 507 | 559.65 | 561 | |||||||
| NI Conservatives | Stephen O'Brien | 0.3 | 129 | 132 | 132.36 | |||||||
| Workers' Party | Marcella Delaney | 0.2 | 89 | 101 | 101.09 | |||||||
| Electorate: 63,654 Valid: 38,175 Spoilt: 306 (0.80%) Quota: 5,454 Turnout: 38,481 (58.6%) | ||||||||||||
2003
| 2003 Assembly election: South Antrim - 6 seats | |||||||||||||||
|---|---|---|---|---|---|---|---|---|---|---|---|---|---|---|---|
| Party | Candidate | FPv% | Count 1 | Count 2 | Count 3 | Count 4 | Count 5 | Count 6 | Count 7 | Count 8 | Count 9 | Count 10 | Count 11 | ||
| UUP | David Burnside | 18.9 | 7,066 | ||||||||||||
| DUP | Wilson Clyde | 13.7 | 5,131 | 5,255.56 | 5,259.80 | 5,302 | 5,533 | ||||||||
| DUP | Paul Girvan | 12.9 | 4,820 | 4,900.40 | 4,914.12 | 4,976.32 | 5,176 | 6,414 | |||||||
| UUP | Jim Wilson | 8.4 | 3,135 | 3,519.96 | 3,555.44 | 3,667.80 | 3,772.48 | 3,878.32 | 4,146.32 | 4,214.32 | 5,606.32 | ||||
| SDLP | Thomas Burns | 7.3 | 2,732 | 2,748.56 | 2,751.56 | 2,816.56 | 2,855.48 | 2,864.20 | 2,875.20 | 2,876.20 | 2,961.36 | 2,992.36 | 4,979.24 | ||
| Alliance | David Ford | 9.1 | 3,393 | 3,456.60 | 3,504.04 | 3,754.64 | 3,821.48 | 3,872.36 | 3,954.36 | 3,969.36 | 4,488.84 | 4,696.84 | 4,966.20 | ||
| Sinn Féin | Martin Meehan | 11.5 | 4,295 | 4,296.20 | 4,298.20 | 4,311.20 | 4,312.20 | 4,313.20 | 4,314.20 | 4,314.20 | 4,317.92 | 4,318.92 | 4,785.64 | ||
| SDLP | Donovan McClelland | 7.1 | 2,671 | 2,677.24 | 2,678.24 | 2,723.72 | 2,726.96 | 2,732.20 | 2,738.20 | 2,739.20 | 2,783.40 | 2,802.40 | |||
| UUP | Adrian Cochrane-Watson | 2.5 | 953 | 1,853.72 | 1,889.68 | 1,964.80 | 2,119.48 | 2,263.16 | 2,612.16 | 2,696.16 | |||||
| DUP | John Smyth | 4.0 | 1,501 | 1,530.52 | 1,532.52 | 1,600.48 | 1,635.84 | ||||||||
| NI Unionist | Norman Boyd | 2.1 | 774 | 826.56 | 838.52 | 881 | |||||||||
| NI Women's Coalition | Joan Cosgrove | 1.2 | 465 | 474.36 | 484.36 | ||||||||||
| PUP | Kenneth Wilkinson | 0.8 | 311 | 323.24 | 327.48 | ||||||||||
| NI Conservatives | Jason Docherty | 0.5 | 174 | 179.52 | |||||||||||
| Electorate: 63,640 Valid: 37,421 Spoilt: 437 (1.15%) Quota: 5,346 Turnout: 37,858 (59.49%) | |||||||||||||||
1998
| 1998 Assembly election: South Antrim - 6 seats | ||||||||||||||
|---|---|---|---|---|---|---|---|---|---|---|---|---|---|---|
| Party | Candidate | FPv% | Count 1 | Count 2 | Count 3 | Count 4 | Count 5 | Count 6 | Count 7 | Count 8 | Count 9 | Count 10 | ||
| UUP | Jim Wilson | 15.2 | 6,691 | |||||||||||
| DUP | Wilson Clyde | 13.7 | 6,034 | 6,035 | 6,060 | 6,234 | 6,244.38 | 8,522.38 | ||||||
| UK Unionist | Norman Boyd | 9.9 | 4,360 | 4,364 | 4,404 | 4,521 | 4,534.68 | 4,822.88 | 6,380.88 | |||||
| SDLP | Donovan McClelland | 9.8 | 4,309 | 4,327 | 4,480 | 4,530 | 4,532.88 | 4,538 | 4,540 | 6,384 | ||||
| UUP | Duncan Shipley-Dalton | 9.4 | 4,147 | 4,150 | 4,264 | 4,571 | 4,700.36 | 4,836.38 | 5,012.38 | 5,016.38 | 6,965.38 | |||
| Alliance | David Ford | 8.6 | 3,778 | 3,810 | 4,233 | 4,456 | 4,483.60 | 4,497.96 | 4,506.96 | 4,566.96 | 5,074.32 | 5,655.32 | ||
| SDLP | Thomas Burns | 7.9 | 3,474 | 3,500 | 3,651 | 3,701 | 3,702.80 | 3,709.04 | 3,714.04 | 4,747.04 | 4,857.16 | 4,948.16 | ||
| UUP | John Hunter | 5.3 | 2,337 | 2,349 | 2,399 | 2,832 | 3,034.92 | 3,190.26 | 3,507.26 | 3,509.26 | ||||
| Sinn Féin | Martin Meehan | 7.3 | 3,226 | 3,239 | 3,273 | 3,275 | 3,275.12 | 3,278.12 | 3,278.12 | |||||
| DUP | Stuart Deignan | 6.4 | 2,816 | 2,819 | 2,836 | 2,971 | 2,977.30 | |||||||
| PUP | Kenneth Wilkinson | 3.5 | 1,546 | 1,559 | 1,637 | |||||||||
| NI Women's Coalition | Joan Cosgrove | 2.5 | 1,108 | 1,136 | ||||||||||
| Labour Party NI | Oliver Frawley | 0.3 | 137 | |||||||||||
| Natural Law | George Stidolph | 0.1 | 28 | |||||||||||
| Electorate: 69,426 Valid: 43,991 Spoilt: 608 Quota: 6,285 Turnout: 44,599 (64.24%) | ||||||||||||||
1996 Forum
Successful candidates are shown in bold.[2]
| Party | Candidate(s) | Votes | Percentage | |
|---|---|---|---|---|
| UUP | Peter King John Hunter Ivan Hunter Peter Walker Mervyn Rea |
12,001 | 30.2 | |
| DUP | Wilson Clyde Trevor Kirkland |
9,549 | 24.0 | |
| SDLP | Donovan McClelland Bobby Burns Tommy McTeague Bobby Loughran Oran Keenan |
6,025 | 15.1 | |
| Alliance | David Ford Jim Rooney Lynn Frazer |
3,332 | 8.4 | |
| Sinn Féin | Henry Cushinan Pauline Davey-Kennedy Laurence McKeown |
2,149 | 5.4 | |
| UK Unionist | Billy Boyd Stephen Nicholl |
2,111 | 5.3 | |
| PUP | Kenneth Wilkinson Mark Thompson |
1,697 | 4.3 | |
| Ulster Democratic | William Blair David Burgess |
1,000 | 2.5 | |
| NI Women's Coalition | Joan Cosgrove Rosaleen Pelen Sandra Walsh Anne McKenna |
435 | 1.1 | |
| Independent Templeton | Arthur Templeton Fraser Agnew |
250 | 0.7 | |
| NI Conservatives | Agnes Shirley Roger Lomas David Bustard |
246 | 0.6 | |
| Labour coalition | Eleanor Bailey Peter Ruddell Glen Simpson |
236 | 0.6 | |
| Green (NI) | Alan Warren John Spottiswoode |
197 | 0.5 | |
| Democratic Left | Paul Gupta Paddy McGlinley |
119 | 0.3 | |
| Democratic Partnership | Rodney Greene Paul Mullan |
105 | 0.3 | |
| Workers' Party | Eamon Gillen Bobby Owens |
104 | 0.3 | |
| Ulster Independence | Francis Ellison Samuel Parke |
89 | 0.2 | |
| Independent McMullan | John McDowell William Dunbar |
33 | 0.1 | |
| Natural Law | Margaret Adams Mark Griffiths |
16 | 0.0 | |
| Independent Chambers | William Larmour Greta Bunting |
3 | 0.0 | |
1982
| 1982 Assembly election: South Antrim - 10 seats | ||||||||||||||||||||||||||
|---|---|---|---|---|---|---|---|---|---|---|---|---|---|---|---|---|---|---|---|---|---|---|---|---|---|---|
| Party | Candidate | 1st Pref% | Count 1 | Count 2 | Count 3 | Count 4 | Count 5 | Count 6 | Count 7 | Count 8 | Count 9 | Count 10 | Count 11 | Count 12 | Count 13 | Count 14 | Count 15 | Count 16 | Count 17 | Count 18 | Count 19 | Count 20 | Count 21 | Count 22 | Count 23 | |
| UUP | Jim Molyneaux | 30.1 | 19,978 | |||||||||||||||||||||||
| DUP | William Beattie | 11.3 | 7,489 | |||||||||||||||||||||||
| UUP | Fraser Agnew | 5.0 | 3,302 | 6,201.70 | ||||||||||||||||||||||
| DUP | Ivan Davis | 8.1 | 5,394 | 6,170.30 | ||||||||||||||||||||||
| UUP | Clifford Forsythe | 2.4 | 1,612 | 4,243.60 | 4,283.69 | 4,306.36 | 4,319.20 | 4,325.10 | 4,327.10 | 4,376.74 | 4,408.67 | 4,559.92 | 4,563.62 | 4,563.62 | 4,642.81 | 4,654.91 | 5,437.30 | 5,500.63 | 5,501.33 | 6,249.33 | ||||||
| DUP | Roy Thompson | 4.0 | 2,646 | 3,035.50 | 3,165.27 | 3,165.90 | 3,171.54 | 3,172.23 | 3,175.23 | 3,192.98 | 3,194.36 | 3,254.72 | 3,256.72 | 3,257.42 | 3,793.33 | 3,803.43 | 3,845.90 | 3,868.20 | 3,872.98 | 3,999.38 | 6,419.89 | |||||
| SDLP | James McDonald | 3.1 | 2,071 | 2,073.10 | 2,073.29 | 2,073.29 | 2,073.41 | 2,074.41 | 2,091.11 | 2,091.11 | 2,115.11 | 2,115.11 | 2,157.11 | 2,652.11 | 2,653.11 | 2,853.11 | 2,853.11 | 2,873.11 | 4,397.11 | 4,400.81 | 4,402.51 | 4,402.51 | 4,402.51 | 7,460.93 | ||
| Alliance | Seamus Close | 4.4 | 2,916 | 2,968.80 | 2,975.21 | 2,976.51 | 2,977.19 | 2,979.31 | 2,990.31 | 2,992.01 | 3,034.41 | 3,044.51 | 3,090.51 | 3,139.51 | 3,140.21 | 3,417.21 | 3,422.38 | 4,166.38 | 4,240.38 | 4,274.41 | 4,284.82 | 4,286.37 | 4,289.37 | 4,750.61 | 5,806.12 | |
| UUP | Billy Bell | 1.5 | 979 | 2,906.10 | 3,039.72 | 3,116.18 | 3,166.10 | 3,198.69 | 3,200.39 | 3,284.60 | 3,331.61 | 3,413.74 | 3,413.93 | 3,417.63 | 3,495.47 | 3,506.76 | 4,049.33 | 4,128.68 | 4,129.68 | 4,898.09 | 5,269 | 5,541.50 | 5,678.91 | 5,683.91 | 5,683.91 | |
| Alliance | Gordon Mawhinney | 4.0 | 2,660 | 2,774.10 | 2,777.14 | 2,778.92 | 2,779.64 | 2,779.64 | 2,785.64 | 2,793.77 | 2,890.90 | 2,916.70 | 2,951.89 | 2,970.89 | 2,976.59 | 3,084.59 | 3,102.03 | 4,426.80 | 4,462.80 | 4,586.07 | 4,613.09 | 4,617.29 | 4,626.26 | 4,751.13 | 5,100.01 | |
| UUP | Frank Millar Jr | 0.8 | 526 | 3,407.50 | 3,429.16 | 3,435.58 | 3,449.46 | 3,459.99 | 3,460.99 | 3,507.72 | 3,524.94 | 3,606.37 | 3,609.18 | 3,611.18 | 3,675.39 | 3,682.49 | 3,947.31 | 3,995.42 | 3,997.61 | 4,332.52 | 4,510.33 | 4,589.38 | 4,647.38 | 4,649.38 | 4,652.38 | |
| SDLP | John Clenaghan | 4.2 | 2,802 | 2,806.20 | 2,808.10 | 2,808.25 | 2,809.09 | 2,809.09 | 2,830.09 | 2,830.09 | 2,850.09 | 2,851.09 | 2,887.09 | 3,083.09 | 3,083.09 | 3,297.09 | 3,299.29 | 3,318.48 | 4,174.51 | 4,178.59 | 4,189.07 | 4,190.82 | 4,191.82 | |||
| DUP | Trevor Kirkland | 1.9 | 1,265 | 1,364.70 | 2,142.13 | 2,143.06 | 2,157.34 | 2,165.88 | 2,165.88 | 2,220.02 | 2,242.39 | 2,325.50 | 2,327.69 | 2,328.69 | 3,044.91 | 3,051.31 | 3,120.22 | 3,141.73 | 3,141.92 | 3,468.33 | ||||||
| Independent Unionist | George Herron | 2.7 | 1,797 | 2,237.30 | 2,284.23 | 2,287.51 | 2,291.59 | 2,301.90 | 2,302.60 | 2,345.09 | 2,382.98 | 2,543.33 | 2,545.33 | 2,545.33 | 2,622.11 | 2,632 | 2,850.92 | 2,891.03 | 2,891.03 | |||||||
| SDLP | Patrick Ritchie | 3.1 | 2,081 | 2,083.10 | 2,083.48 | 2,083.48 | 2,083.48 | 2,084.67 | 2,097.67 | 2,097.67 | 2,111.67 | 2,115.67 | 2,136.67 | 2,438.67 | 2,441.26 | 2,633.29 | 2,633.29 | 2,672.29 | ||||||||
| Alliance | Joan Tomlin | 3.2 | 2,107 | 2,214.10 | 2,216.38 | 2,217.77 | 2,217.25 | 2,217.28 | 2,217.28 | 2,221.21 | 2,290.34 | 2,326.04 | 2,336.04 | 2,352.04 | 2,366.95 | 2,523.65 | 2,546.87 | |||||||||
| UUP | Ivan Hunter | 1.4 | 930 | 1,827.70 | 1,845.37 | 1,852.47 | 1,859.31 | 1,870.16 | 1,871.05 | 1,957.52 | 1,975.42 | 2,021.57 | 2,024.27 | 2,025.42 | 2,058.77 | 2,061.20 | ||||||||||
| Workers' Party | Kevin Smyth | 1.3 | 891 | 902.20 | 903.96 | 903.99 | 903.99 | 904.99 | 933.99 | 935.69 | 984.69 | 993.17 | 1,626.49 | 1,705.49 | 1,707.06 | |||||||||||
| DUP | Samuel Neill | 1.9 | 1,250 | 1,377.40 | 1,557.52 | 1,558.21 | 1,562.81 | 1,569.62 | 1,569.62 | 1,597.58 | 1,609.99 | 1,672.86 | 1,673.86 | 1,674.98 | ||||||||||||
| Independent Republican | William McDonnell | 1.8 | 1,180 | 1,182.10 | 1,182.10 | 1,182.13 | 1,182.37 | 1,182.37 | 1,189.37 | 1,189.37 | 1,203.37 | 1,206.37 | 1,236.37 | |||||||||||||
| Workers' Party | Austin Kelly | 1.2 | 775 | 779.20 | 780.34 | 780.40 | 781.52 | 781.52 | 822.71 | 822.41 | 890.11 | 906.81 | ||||||||||||||
| Independent Unionist | James Smith | 1.0 | 686 | 828.10 | 830.51 | 836.78 | 837.38 | 838.57 | 841.57 | 856.16 | 879.75 | |||||||||||||||
| NI Labour | Bob Kidd | 0.8 | 560 | 600.90 | 604.27 | 605.66 | 605.66 | 605.66 | 651.66 | 658.06 | ||||||||||||||||
| UUUP | Kennedy Lindsay | 0.2 | 160 | 360.50 | 365.44 | 366.95 | 366.39 | 473.30 | 473.30 | |||||||||||||||||
| Communist | Andrew Gibb | 0.4 | 247 | 250.80 | 250.37 | 250.37 | 250.37 | 251.07 | ||||||||||||||||||
| UUUP | Samuel Larmour | 0.2 | 139 | 196.70 | 205.44 | 205.71 | 208.83 | |||||||||||||||||||
| |Counts = 23 |Electorate = 131,734 |Valid = 66,443 |Spoilt = 2,076 |Quota = 6,041 |Turnout = 68,519 (52.01%) | ||||||||||||||||||||||||||
1975 Constitutional Convention
| 1975 Constitutional Convention: South Antrim - 8 seats | ||||||||||||||||
|---|---|---|---|---|---|---|---|---|---|---|---|---|---|---|---|---|
| Party | Candidate | FPv% | Count 1 | Count 2 | Count 3 | Count 4 | Count 5 | Count 6 | Count 7 | Count 8 | Count 9 | Count 10 | Count 11 | Count 12 | ||
| DUP | William Beattie | 17.2 | 11,834 | |||||||||||||
| UUP | Austin Ardill | 15.8 | 10,895 | |||||||||||||
| SDLP | Vincent McCloskey | 9.8 | 6,756 | 6,756.35 | 6,756.95 | 9,057.95 | ||||||||||
| Alliance | Charles Kinahan | 7.7 | 5,294 | 5,311.85 | 5,333.75 | 5,443.75 | 6,147.58 | 6,201.13 | 6,226.95 | 9,209.95 | ||||||
| Unionist Party NI | Anne Dickson | 8.3 | 5,723 | 5,910.95 | 6,251.15 | 6,278.45 | 6,325.43 | 6,533.60 | 6,676.77 | 7,021.31 | 7,943.19 | |||||
| DUP | Stewart Dunlop | 3.6 | 2,461 | 4,177.75 | 5,242.75 | 5,268.80 | 5,271.41 | 5,581.91 | 7,361.06 | 7,414.25 | 7,451.49 | 7,463.25 | 8,612.25 | |||
| Vanguard | Kennedy Lindsay | 6.6 | 4,529 | 5,091.10 | 5,574.70 | 5,601.10 | 5,603.71 | 5,915.31 | 6,660.71 | 6,684.83 | 6,706.11 | 6,709.47 | 7,966.47 | |||
| Vanguard | George Morrison | 4.3 | 2,943 | 3,600.65 | 3,691.55 | 3,700.80 | 3,701.67 | 4,668.97 | 5,203.51 | 5,219.87 | 5,247.99 | 5,250.79 | 6,855.08 | 7,723.64 | ||
| Unionist Party NI | Peter McLachlan | 5.7 | 3,919 | 3,968 | 4,006.10 | 4,032.40 | 4,081.99 | 4,275.84 | 4,352.76 | 4,509.44 | 5,002.68 | 5,269.80 | 5,812.34 | 5,905.40 | ||
| UUP | John Logan | 3.8 | 2,595 | 2,745.85 | 3,519.25 | 3,522.90 | 3,524.64 | 4,625.61 | 4,929.78 | 4,943.94 | 4,999.42 | 5,010.34 | ||||
| Alliance | John Cousins | 4.7 | 3,228 | 3,265.10 | 3,339.80 | 3,453.10 | 4,042.09 | 4,061.39 | 4,078.33 | |||||||
| DUP | James Smith | 4.3 | 2,970 | 3,336.45 | 3,468.15 | 3,490.20 | 3,498.90 | 3,685.87 | ||||||||
| UUP | Samuel Semple | 4.1 | 2,813 | 3,174.90 | 3,394.50 | 3,400.15 | 3,402.76 | |||||||||
| SDLP | James McDonald | 2.7 | 1,888 | 1,889.05 | 1,889.35 | |||||||||||
| Republican Clubs | Kevin Smith | 1.0 | 710 | 714.20 | 717.50 | |||||||||||
| Communist Party | William Somerset | 0.4 | 248 | 249.40 | 249.40 | |||||||||||
| Electorate: 119,723 Valid: 68,806 Spoilt: 1,323 (1.89%) Quota: 7,646 Turnout: 70,129 (58.58%) | ||||||||||||||||
1973
| 1973 Assembly election: South Antrim - 8 seats | ||||||||||||||||||||||
|---|---|---|---|---|---|---|---|---|---|---|---|---|---|---|---|---|---|---|---|---|---|---|
| Party | Candidate | FPv% | Count 1 | Count 2 | Count 3 | Count 4 | Count 5 | Count 6 | Count 7 | Count 8 | Count 9 | Count 10 | Count 11 | Count 12 | Count 13 | Count 14 | Count 15 | Count 16 | Count 17 | Count 18 | ||
| DUP | William Beattie | 13.5 | 10,126 | |||||||||||||||||||
| Independent Unionist | Anne Dickson | 12.0 | 9,033 | |||||||||||||||||||
| SDLP | Vincent McCloskey | 10.5 | 7,899 | 7,899.54 | 7,900.52 | 7,914.59 | 7,976.59 | 7,978.73 | 8,059.73 | 8,177.73 | 8,551.73 | |||||||||||
| Alliance | Derrick Crothers | 8.0 | 5,975 | 5,982.92 | 6,020.16 | 6,038.30 | 6,165.66 | 6,175.93 | 6,298.70 | 6,928.36 | 7,435.26 | 7,536.27 | 7,597.12 | 7,600.44 | 10,234.44 | |||||||
| UUP | Nat Minford | 7.0 | 5,289 | 5,323.56 | 5,451.87 | 5,453.01 | 5,454.08 | 5,498.90 | 5,524.71 | 5,538.62 | 5,594.82 | 5,597.55 | 5,836.35 | 5,877.31 | 5,933.97 | 6,265.97 | 6,886.39 | 7,016.28 | 9,076.28 | |||
| UUP | Austin Ardill | 7.0 | 5,234 | 5,336.78 | 5,397.12 | 5,400.12 | 5,401.12 | 5,495.88 | 5,499.95 | 5,510.27 | 5,533.80 | 5,535.62 | 6,367.54 | 6,431.08 | 6,466.69 | 6,627.69 | 7,823.44 | 8,127.68 | 8,644.68 | |||
| Vanguard | Kennedy Lindsay | 4.0 | 3,005 | 3,148.42 | 3,154.51 | 3,156.69 | 3,156.87 | 3,181.33 | 3,186.40 | 3,186.61 | 3,207.11 | 3,207.11 | 3,304.76 | 5,037.28 | 5,047.09 | 5,066.09 | 5,208.76 | 7,828.69 | 8,011.22 | 8,033.58 | ||
| UUP | Peter McLachlan | 5.3 | 3,983 | 4,002.08 | 4,106.87 | 4,109.01 | 4,110.01 | 4,144.35 | 4,155.84 | 4,162.58 | 4,202.14 | 4,202.14 | 4,313.39 | 4,327 | 4,365.75 | 4,533.75 | 5,456.28 | 5,517.33 | 7,324.17 | 7,997.55 | ||
| DUP | Allen Annesley | 5.6 | 4,232 | 5,321.36 | 5,331.93 | 5,332.93 | 5,333.93 | 5,356.75 | 5,364.93 | 5,369.93 | 5,397.36 | 5,397.36 | 5,503.78 | 5,684.56 | 5,697.67 | 5,732.67 | 5,942.87 | 6,487.80 | 6,621.46 | 6,663.17 | ||
| UUP | George Swann | 5.0 | 3,742 | 3,753.88 | 3,815.55 | 3,816.55 | 3,816.62 | 3,856.48 | 3,864.08 | 3,895.15 | 3,919.89 | 3,922.62 | 4,225.59 | 4,266.20 | 4,315.99 | 4,627.99 | 4,948.51 | 5,011.61 | ||||
| Vanguard | Robert Bradford | 3.4 | 2,587 | 2,883.28 | 2,890.21 | 2,891.28 | 2,894.28 | 2,906.93 | 2,917.43 | 2,921.50 | 2,942.78 | 2,942.78 | 3,080.23 | 3,739.95 | 3,752 | 3,774 | 3,891.25 | |||||
| UUP | Alexander McGowan | 3.1 | 2,327 | 2,343.38 | 2,388.53 | 2,389.74 | 2,391.88 | 2,686.09 | 2,693.55 | 2,699.90 | 2,745.92 | 2,746.83 | 3,382.17 | 3,435.88 | 3,487.29 | 3,659.29 | ||||||
| Alliance | William Gawn | 2.3 | 1,709 | 1,710.62 | 1,731.13 | 1,741.27 | 1,782.95 | 1,787.44 | 1,827.76 | 2,590.89 | 2,917.94 | 3,018.04 | 3,059.08 | 3,069.36 | ||||||||
| Vanguard | William Snoddy | 3.6 | 2,706 | 2,731.02 | 2,735.01 | 2,736.01 | 2,736.01 | 2,747.55 | 2,756.91 | 2,765.12 | 2,789.55 | 2,789.55 | 2,809.48 | |||||||||
| UUP | John Blakeley | 3.2 | 2,375 | 2,438 | 2,493.37 | 2,496.44 | 2,499.51 | 2,654.87 | 2,659.22 | 2,663.50 | 2,697.17 | 2,699.90 | ||||||||||
| NI Labour | Bob Kidd | 1.0 | 740 | 742.34 | 747.45 | 921.23 | 1,203.58 | 1,206.97 | 1,733.78 | 1,791.48 | ||||||||||||
| Alliance | Joan Tomlin | 2.1 | 1,572 | 1,572.54 | 1,584.93 | 1,596.14 | 1,608.35 | 1,612.56 | 1,684.86 | |||||||||||||
| NI Labour | Sandy Scott | 1.1 | 854 | 856.52 | 861.35 | 908.78 | 968.85 | 971.06 | ||||||||||||||
| UUP | William King | 0.9 | 694 | 707.50 | 767.49 | 770.63 | 770.99 | |||||||||||||||
| NI Labour | Deirdre Byrne | 0.7 | 559 | 560.62 | 561.67 | 607.81 | ||||||||||||||||
| NI Labour | Robert Johnston | 0.5 | 342 | 343.08 | 345.04 | |||||||||||||||||
| Electorate: 114,240 Valid: 75,033 Spoilt: 1,486 Quota: 8,338 Turnout: 76,519 (67.0%) | ||||||||||||||||||||||
References
- "Statement of Persons Nominated". EONI. Retrieved 8 February 2017.
- 1996 Candidates – South Antrim, Northern Ireland Elections
| Assembly |   | |
|---|---|---|
| Committees | ||
| Constituencies | ||
| Parties | Current:
| |
| Elections | ||
| Members |
| |
| Procedure | ||
| See also | ||