Results of the 2018 Taiwanese magistrate/mayor elections
The 2018 Taiwanese municipal elections for both mayoral and magisterial candidates were held on 24 November 2018, as part of the larger local elections in Taiwan.
2018 municipal election candidate nominations
| Date | Party/wave | Nominations and details |
|---|---|---|
| 20 August 2017 | Kuomintang ( | |
| 24 September 2017 | DPP | The Democratic Progressive Party ( DPP) held its national congress, mainly to gain support in the upcoming local and municipal elections, giving the incumbent a priority to be nominated.[2] |
| 29 November 2017 | DPP/01 |
|
| 20 December 2017 |
| |
| 27 December 2017 | DPP/02 |
|
| 31 January 2018 |
| |
| 7 February 2018 | Hsieh Li-kung (Keelung City) after negotiation due to opinion poll error[7] | |
| 21 February 2018 | Lu Shiow-yen (Taichung City)[8] | |
| 27 February 2018 | Huang Min-hui (Chiayi City)[9] | |
| 14 March 2018 | DPP/03 |
|
| 21 March 2018 | Lai Feng-wei (Penghu County)[11] | |
| 11 April 2018 |
| |
| 25 April 2018 |
| |
| 25 April 2018 | DPP/04 |
|
| 9 May 2018 |
| |
| 23 May 2018 |
| |
| 30 May 2018 | DPP/05 | Pasuya Yao (Taipei City) |
| 13 June 2018 | Yang Wen-ke (Hsinchu County) |
Results summary
Bold represents incumbent re-elected.
| County/City | Elected candidate | Party |
|---|---|---|
| Keelung City | Lin Yu-chang | DPP |
| New Taipei | Hou You-yi | |
| Taipei | Ko Wen-je | |
| Taoyuan | Cheng Wen-tsan | DPP |
| Hsinchu County | Yang Wen-ke | |
| Hsinchu City | Lin Chih-chien | DPP |
| Miaoli | Hsu Yao-chang | |
| Taichung | Lu Shiow-yen | |
| Nantou | Lin Ming-chen | |
| Changhua | Wang Huei-mei | |
| Yunlin | Chang Li-shan | |
| Chiayi | Weng Chang-liang | DPP |
| Chiayi City | Huang Min-hui | |
| Tainan | Huang Wei-cher | DPP |
| Kaohsiung | Han Kuo-yu | |
| Pingtung | Pan Men-an | DPP |
| Yilan | Lin Zi-miao | |
| Hualien | Hsu Chen-wei | |
| Taitung | Rao Ching-ling | |
| Penghu | Lai Feng-wei | |
| Kinmen | Yang Cheng-wu | |
| Lienchiang | Liu Cheng-ying |
| Party | Seats in 2018 | Seats in 2014 | Change |
|---|---|---|---|
| DPP | 6 | 13 | |
| 15 | 6 | ||
| 1 | 3 |
| County/City | Previous control | New Control |
|---|---|---|
| Taipei | Ko Wen-je | |
| Keelung City | Lin Yu-chang | DPP |
| Taoyuan | Cheng Wen-tsan | DPP |
| Hsinchu City | Lin Chih-chien | DPP |
| Miaoli | Hsu Yao-chang | |
| Nantou | Lin Ming-chen | |
| Pingtung | Pan Men-an | DPP |
| Lienchiang | Liu Cheng-ying |
| County/City | Previous control | New Control |
|---|---|---|
| Taichung | DPP | |
| Kaohsiung | DPP | |
| Changhua | DPP | |
| Yunlin | DPP | |
| Chiayi City | DPP | |
| Yilan | DPP | |
| Hualien | ||
| Penghu | DPP | |
| Kinmen |
Special municipality
Taipei
Political context prior to the elections
|
As the capital of Taiwan, Taipei functions as the economic and political center of Taiwan, and is currently its largest city. Taipei's mayoral race has been hotly contested between Kuomintang and the Democratic Progressive Party since the 1994 local election. This seat has notably been held by former presidents Lee Teng Hui, Chen Shui Bian, and Ma Ying-jeou. The position has been widely speculated to be a "first-step" towards the presidential office.[16] In 2014 DPP-supported independent candidate Doctor Ko Wen-je received a 57% majority of the votes over Kuomintang's Sean Lien, ending the 16-year Kuomintang administration of Taipei. |
| |||||||||||||||||||||||||||||||
.svg.png)
| Party | Year | Vote share % |
|---|---|---|
| Democratic Progressive Party | 2016 presidential election | 52% |
| 2002 local elections | 64% |
| Party | Presidential % | Legislative seats | Legislative % |
|---|---|---|---|
| Democratic Progressive Party | 51.96% | 2 | 14.14% |
| 37.49% | 5 | 39.66% | |
| - | 1 | 6.60% | |
| Taiwan Solidarity Union | - | 0 | 0.95% |
| 10.55% | 0 | 5.95% | |
| - | 0 | 32.71% |
Results of the primary
| 2018 Kuomintang Taipei City mayoral primary results | |||||
|---|---|---|---|---|---|
| Candidates | Place | TVBS | Apollo Survey & Research | UDN | Aggregated Result |
| Ting Shou-chung | Nominated | 48.395% | 46.778% | 47.741% | 47.634% |
| Sun Ta-chien | 2nd | 17.891% | 18.845% | 17.878% | 18.205% |
| Chang Hsien-yao | 3rd | 17.073% | 17.909% | 16.723% | 17.235% |
| Chung Siao Ping | 4th | 16.651% | 16.468% | 17.658% | 16.926% |
| 2018 Democratic Progressive Party Taipei City mayoral primary results | ||||
|---|---|---|---|---|
| Candidates | Place | Results | ||
| Pasuya Yao | Called in | Results not released | ||
| Annette Lu | Results not released | |||
Opinion polls
| Poll organization | Date of completion | Pasuya Yao | Lead | |||
|---|---|---|---|---|---|---|
| TVBS | May 4, 2017 | 40% | 39% | 9% | 12% | 1% |
| TVBS | May 4, 2017 | 46% | 41% | – | 13% | 5% |
| Real Survey | May 23, 2017 | 39.9% | 43.1% | - | 17% | 3.2% |
| TISR | June 21, 2017 | 43.3% | 32.2% | – | 24.5% | 11.1% |
| Formosa | July 13, 2017 | 47.2% | 31.3% | – | 21.5% | 15.9% |
| Sanli | July 17, 2017 | 32.1% | 31.8% | 15.7% | 20.4% | 0.3% |
| ETtoday | September 20, 2017 | 72.5% | 17.5% | – | 10% | 55% |
| TCF | November 23, 2017 | 42.7% | 36.9% | – | 20.4% | 5.8% |
| Formosa | December 12, 2017 | 46.0% | 32.7% | – | 21.3% | 15.3% |
| Formosa | December 12, 2017 | 43.1% | 28.2% | 11.4% | 17.3% | 14.9% |
| TISR1 | December 14, 2017 | 36.6% | 15.7% | 6.8% | 22% | 20.9% |
| Real Survey | February 9, 2018 | 44.2% | 26.6% | 16.1% | 13.1% | 17.6% |
| Sanli | February 12, 2018 | 39.8% | 30.3% | 13.9% | 16% | 9.5% |
| Sanli | February 12, 2018 | 47.0% | 39.1% | – | 13.9% | 7.9% |
| Focus Survey Research | February 25, 2018 | 47.6% | 25.6% | 15.2% | 11.6% | 22% |
| Focus Survey Research | February 25, 2018 | 54.7% | 31.1% | – | 14.2% | 23.6% |
| ETtoday | February 26, 2018 | 44.0% | 39.2% | – | 16.8% | 4.8% |
| GSSC | March 7, 2018 | 47.5% | 40.7% | – | 11.8% | 6.8% |
| GSSC | March 7, 2018 | 42.4% | 30.9% | 13.5% | 13.2% | 11.5% |
| Evidence-Based Survey and Research | April 25, 2018 | 35.0% | 25.6% | 21.5% | 17.9% | 9.4% |
| Apollo | May 2, 2018 | 33.0% | 33.6% | - | 33.4% | 0.6% |
| TVBS | May 2, 2018 | 31% | 38% | - | 31% | 7% |
| Liberty Times Net | May 2, 2018 | 30.69% | 37.47% | - | 31.84% | 6.78% |
| ETtoday | May 3, 2018 | 48.5% | 32.1% | 4.0% | 15.4% | 16.4% |
| DPP | May 3, 2018 | 35% | 30% | 25% | 10% | 5% |
| Green Party | May 3, 2018 | 31% | 35% | 25% | 9% | 4% |
| China Times | May 13, 2018 | 36.5% | 42.7% | - | 31% | 6.2% |
| Formosa | May 14, 2018 | 41.0% | 40.9% | - | 18.1% | 0.1% |
| Formosa | May 14, 2018 | 35.2% | 33.1% | 15.0% | 16.7% | 2.1% |
| ETtoday | May 17, 2018 | 36.4% | 37.5% | 13.4% | 12.7% | 1.1% |
| Liberty Times Net | May 21, 2018 | 39% | 41% | - | 19% | 2% |
| Liberty Times Net | May 21, 2018 | 38% | 39% | 8% | 16% | 1% |
| Taiwan Brain Trust | May 22, 2018 | 41.3% | 36.1% | - | 22.6% | 5.2% |
| Taiwan Brain Trust | May 22, 2018 | 39.4% | 33.6% | 13.8% | 13.2% | 5.8% |
| Hsih Shin University | May 28, 2018 | 29.0% | 29.1% | 13.5% | 28.4% | 0.1% |
| TVBS | June 1, 2018 | 31% | 33% | 13% | 23% | 2% |
| China Times | June 4, 2018 | 34.7% | 40.2% | 12.2% | 12.9% | 5.5% |
| CM Media | July 11, 2018 | 38.9% | 27.5% | 11.0% | 22.6% | 9.4% |
| Formosa2 | July 12, 2018 | 38.7% | 30.5% | 16.4% | 6.2% | 8.2% |
| Polls3 | July 16, 2018 | 43.4% | 31.8% | 8.9% | 15.9% | 11.6% |
| TVBS | July 24, 2018 | 40.0% | 30.0% | 11.0% | 19.0% | 10% |
| ETtoday | July 30, 2018 | 42.4% | 30.9% | 5.4% | 21.3% | 11.5% |
| Liberty Times Net4 | September 1, 2018 | 33.43% | 24.71% | 14.90% | 26.96% | 8.72% |
| ETtoday5 | September 9, 2018 | 41.7% | 29.9% | 8.4% | 13.3% | 11.8% |
| Shih Hsin University6 | September 12, 2018 | 34.9% | 30.8% | 10.4% | 21.9% | 4.1% |
| TVBS7 | September 16, 2018 | 37% | 32% | 11% | 20% | 5% |
| Formosa8 | September 18, 2018 | 34.6% | 23.5% | 11.1% | 23.6% | 11.1% |
| UDN9 | September 19, 2018 | 37% | 29% | 8% | 25% | 8% |
| Sanli10 | September 29, 2018 | 36.1% | 25.8% | 11.1% | 25.2% | 10.3% |
| Apollo | October 5, 2018 | 41.6% | 27.2% | 15.2% | 16% | 14.4% |
| Formosa11 | October 12, 2018 | 37.5% | 25.0% | 11.3% | 14.7% | 12.5% |
| Taiwan Public Opinion Foundation12 | October 16, 2018 | 42.1% | 28.5% | 11.6% | 15.2% | 13.6% |
| TVBS13 | October 25, 2018 | 40% | 33% | 12% | 13% | 7% |
| TVBS14 | October 25, 2018 | 34% | 29% | 11% | 12% | 5% |
| Taiwan Competitiveness Forum 15 | October 29, 2018 | 36.6% | 34.3% | 12.7% | 15.7% | 2.3% |
| UDN16 | October 30, 2018 | 38% | 35% | 8% | 18% | 3% |
| Democratic Progressive Party17 | October 31, 2018 | 35.9% | 24.4% | 19.7% | 17.1% | 11.5% |
| Shih Shin University18 | November 7, 2018 | 34.1% | 31.4% | 7.1% | 25.9% | 2.7% |
| Formosa19 | November 7, 2018 | 38.6% | 27.1% | 8.3% | 18.0% | 11.5% |
| ETtoday | November 8, 2018 | 38.4% | 36.8% | 7.6% | 17.2% | 1.6% |
| China Times | November 11, 2018 | 33.6% | 32.8% | 14.6% | 17.1% | 0.8% |
| TVBS | November 11, 2018 | 39% | 36% | 12% | 13% | 3% |
Notes – results for independent candidates:
1: | ||||||
Predictions
| Poll organization | Date of completion | Turnout | Pasuya Yao | |||
|---|---|---|---|---|---|---|
| Formosa | September 20, 2018 | >70% | 47.4%-49.6% | 30.7%-33.1% | 16.9%-19.0% | 1.3%-1.7% |
| TVBS | October 25, 2018 | 71% | 44% | 40% | 15% | - |
| Formosa | November 7, 2018 | >70% | 49.1% ~ 52.7% | 30.2% ~ 34.4% | 14.1% ~ 16.1% | - |
| TVBS | November 11, 2018 | 73% | 46% | 40% | 13% | - |
Results
According to Civil Servants Election And Recall Act article 69, because Independent Ko Wen-je and Kuomintang's Ting Shou-chung vote percentages are within 0.30 margin, Kuomintang's Ting Shou-chung was entitled to, and did, call for a recount.[17][18][19]
| District | Pasuya Yao | |||||||||
|---|---|---|---|---|---|---|---|---|---|---|
| Votes | % | Votes | % | Votes | % | Votes | % | Votes | % | |
| Songshan District (松山區) | 428 | 0.40 | 46,381 | 43.36 | 17,387 | 16.25 | 42,356 | 39.60 | 420 | 0.39 |
| Xinyi District (信義區) | 502 | 0.41 | 53,955 | 43.99 | 19,934 | 16.25 | 47,762 | 38.94 | 512 | 0.42 |
| Daan District (大安區) | 585 | 0.37 | 72,325 | 45.73 | 23,651 | 14.95 | 60,939 | 38.53 | 662 | 0.42 |
| Zhongshan District (中山區) | 476 | 0.39 | 46,746 | 38.38 | 23,483 | 19.28 | 50,604 | 41.55 | 491 | 0.40 |
| Zhongzheng District (中正區) | 370 | 0.46 | 33,897 | 41.83 | 12,633 | 15.59 | 33,752 | 41.65 | 378 | 0.47 |
| Datong District (大同區) | 266 | 0.38 | 20,763 | 29.69 | 16,896 | 24.16 | 31,679 | 45.29 | 339 | 0.48 |
| Wanhua District (萬華區) | 427 | 0.41 | 38,666 | 37.05 | 21,400 | 20.50 | 43,411 | 41.59 | 464 | 0.44 |
| Wenshan District (文山區) | 707 | 0.49 | 68,586 | 47.15 | 18,985 | 13.05 | 56,479 | 38.83 | 713 | 0.49 |
| Nangang District (南港區) | 287 | 0.43 | 26,282 | 39.45 | 10,830 | 16.26 | 28,896 | 43.37 | 325 | 0.49 |
| Neihu District (内湖區) | 548 | 0.37 | 61,566 | 41.02 | 21,746 | 14.49 | 65,599 | 43.70 | 639 | 0.43 |
| Shilin District (士林區) | 522 | 0.34 | 55,954 | 36.46 | 33,110 | 21.57 | 63,247 | 41.21 | 651 | 0.42 |
| Beitou District (北投區) | 499 | 0.37 | 52,445 | 39.08 | 24,586 | 18.32 | 56,096 | 41.80 | 578 | 0.43 |
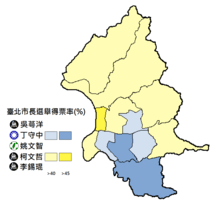
| 2018 Taipei City mayoral results[20] | |||||
|---|---|---|---|---|---|
| No. | Candidate | Party | Votes | Percentage | |
| 1 | Wu E-yang (吳蕚洋) | 5,617 | 0.40% | ||
| 2 | Ting Shou-chung (丁守中) | 577,566 | 40.82% | ||
| 3 | Pasuya Yao (姚文智) | Democratic Progressive Party | 244,641 | 17.29% | |
| 4 | Ko Wen-je (柯文哲) | 580,820 | 41.05% | ||
| 5 | Lee Si-kuen (李錫錕) | 6,172 | 0.44% | ||
| Total voters | 2,164,155 | ||||
| Valid votes | 1,414,816 | ||||
| Invalid votes | |||||
| Voter turnout | 65.37% | ||||
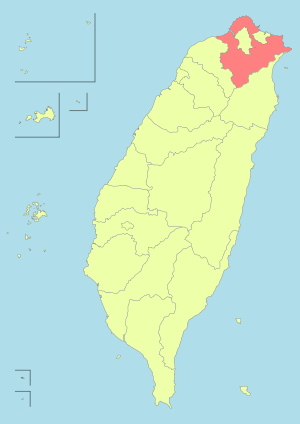
New Taipei
Political context prior to the elections
|
New Taipei City is located in the northernmost region of Taiwan and is the ROC's most populous city. New Taipei was upgraded to Special Municipality status in 2010.[21][22] Due to the vast territory, the number of voters has surpassed 3 million, becoming a Pan blue coalition and Pan green coalition camps battleground.[23][24] Before upgrading to special municipality status, the then Taipei County was controlled by the Kuomintang until the 1989 local election, with the then newly formed Democratic Progressive Party winning the seat for four straight terms in 16 years until Kuomintang's Chou Hsi-wei[25] won power in 2005. After the upgrade to special municipality status in 2010, Kuomintang's Eric Chu[26] won the seat for two consecutive terms, including the 2014 local election. |
| ||||||||||||||||||||||||||||||||||
| Party | Year | Vote share % |
|---|---|---|
| Democratic Progressive Party | 2016 presidential election | 55% |
| 2008 presidential election | 61% |
| Party | Presidential % | Legislative seats | Legislative % |
|---|---|---|---|
| Democratic Progressive Party | 54.79% | 9 | 46.74% |
| 33.34% | 2 | 40.12% | |
| - | 1 | 4.13% | |
| Taiwan Solidarity Union | - | 0 | - |
| 11.87% | 0 | 0.84% | |
| - | 0 | 8.17% |
Results of the primary
| 2018 Kuomintang New Taipei City mayoral primary results | ||||
|---|---|---|---|---|
| Candidates | Place | Results | ||
| Hou You-yi | Nominated | 55.596% | ||
| Chou Hsi-wei | 2nd | 34.210% | ||
| Jin Jie-shou | 3rd | 10.194% | ||
| 2018 Democratic Progressive Party New Taipei City mayoral primary results | ||||
|---|---|---|---|---|
| Candidates | Place | Result | ||
| Su Tseng-chang | Called In | Walkover | ||
Opinion polls
| Poll organization | Date of completion | Su Tseng-chang | Lead | ||
|---|---|---|---|---|---|
| TVBS | December 6, 2017 | 39.0% | 48.0% | 13.0% | 9% |
| Formosa | January 12, 2018 | 41.7% | 41.5% | 17.8% | 0.2% |
| China Times | February 26, 2018 | 33.6% | 53.8% | 12.6% | 20.6% |
| ETtoday | March 1, 2018 | 27.4% | 51.4% | 21.2% | 24% |
| DPP | March 24, 2018 | 39.0% | 39.1% | 21.9% | 0.1% |
| Apollo | April 1, 2018 | 26.4% | 54.3% | 19.3% | 26.9% |
| Apple Daily | April 7, 2018 | 27.54% | 61.37% | 11.09% | 33.83% |
| Taiwan Nextgen Foundation | April 11, 2018 | 42.6% | 41.7% | 15.7% | 0.9% |
| ETtoday | April 11, 2018 | 22.7% | 46.4% | 30.9% | 23.9% |
| TVBS | April 12, 2018 | 32.0% | 40.0% | 28.0% | 8% |
| UDN | May 1, 2018 | 26.0% | 45.0% | 29.0% | 19% |
| China Times | May 1, 2018 | 27.1% | 50.6% | 22.3% | 23.5% |
| Taiwan Brain Trust | May 22, 2018 | 30.7% | 44.3% | 25% | 13.6% |
| Formosa | June 15, 2018 | 23.6% | 41.7% | 34.7% | 18.1% |
| TVBS | June 25, 2018 | 31.0% | 48.0% | 21.0% | 17% |
| Taiwan Nextgen Foundation | June 29, 2018 | 38.3% | 41.0% | 20.7% | 2.7% |
| TVBS | July 17, 2018 | 29.0% | 48.0% | 23.0% | 19% |
| CM Media | July 26, 2018 | 31.1% | 46.3% | 22.6% | 15.2% |
| Taiwan Brain Trust | July 27, 2018 | 40.6% | 42.6% | 16.8% | 2% |
| ETtoday | August 10, 2018 | 24.2% | 45.2% | 30.6% | 11% |
| Taiwan Think Tank | August 31, 2018 | 43.2% | 43.9% | 12.9% | 0.7% |
| Liberty Times Net | September 7, 2018 | 30.89% | 39.86% | 29.25% | 8.97% |
| Shih Hsin University | September 14, 2018 | 29.4% | 40.2% | 30.4% | 10.8% |
| Formosa | September 14, 2018 | 28.2% | 41.7% | 18.1% | 13.5% |
| TVBS | September 16, 2018 | 32% | 48% | 20% | 16% |
| UDN | September 17, 2018 | 24% | 48% | 28% | 24% |
| Taiwan Think Tank | September 22, 2018 | 40.9% | 44.3% | 14.8% | 4.6% |
| Apollo | October 7, 2018 | 32.8% | 49.4% | 15.6% | 16.6% |
| DPP | October 14, 2018 | 39.1% | 39.3% | 21.6% | 0.2% |
| Apollo | October 16, 2018 | 31% | 49.1% | 19% | 18.1% |
| TVBS | October 18, 2018 | 30% | 50% | 21% | 20% |
| Formosa | October 26, 2018 | 22.5% | 44.4% | 19% | 21.9% |
| UDN | November 2, 2018 | 26% | 54% | 20% | 29% |
| Sanli | November 3, 2018 | 39.2% | 40.2% | 20.6% | 1% |
| Shih Shin University | November 8, 2018 | 30.7% | 36.4% | 32.9% | 5.7% |
| ETtoday | November 8, 2018 | 34% | 39.9% | 26.1% | 5.9% |
| Sanli | November 12, 2018 | 43.7% | 44% | 12.3% | 0.3% |
| TVBS | November 12, 2018 | 34% | 48% | 18% | 14% |
Predictions
| Poll organization | Date of completion | Turnout | Su Tseng-chang | |
|---|---|---|---|---|
| Formosa | September 20, 2018 | 51.5% ~ 53% | 47% ~ 48.5% | |
| TVBS | October 19, 2018 | 62% | 56% | 44% |
| TVBS | November 12, 2018 | 70% | 55% | 45% |
Results

| District | Su Tseng-chang | |||
|---|---|---|---|---|
| Votes | % | Votes | % | |
| Banqiao District (板橋區) | 131,905 | 46.03 | 154,687 | 53.97 |
| Sanchong District (三重區) | 100,823 | 50.22 | 99,925 | 49.78 |
| Zhonghe District (中和區) | 80,552 | 36.69 | 139,022 | 63.31 |
| Yonghe District (永和區) | 38,286 | 32.54 | 79,362 | 67.46 |
| Xingzhuang District (新莊區) | 101,046 | 48.28 | 108,240 | 51.72 |
| Xindian District (新店區) | 49,933 | 31.27 | 109,759 | 68.73 |
| Shulin District (樹林區) | 41,600 | 45.87 | 49,090 | 54.13 |
| Yingge District (鶯歌區) | 20,360 | 46.51 | 23,419 | 53.49 |
| Sanxia District (三峽區) | 23,653 | 42.64 | 31,822 | 57.36 |
| Danshui District (淡水區) | 33,763 | 39.67 | 51,336 | 60.33 |
| Xizhi District (汐止區) | 38,639 | 38.72 | 61,139 | 61.28 |
| Ruifang District (瑞芳區) | 8,038 | 37.51 | 13,393 | 62.49 |
| Tucheng District (土城區) | 51,932 | 43.85 | 66,487 | 56.15 |
| Luzhou District (蘆洲區) | 48,350 | 50.56 | 47,271 | 49.44 |
| Wugu District (五股區) | 20,372 | 47.77 | 22,276 | 52.23 |
| Taishan District (泰山區) | 17,627 | 45.77 | 20,885 | 54.23 |
| Linkou District (林口區) | 20,883 | 40.92 | 30,150 | 59.08 |
| Shenkeng District (深坑區) | 5,153 | 40.03 | 7,720 | 59.97 |
| Shiding District (石碇區) | 2,488 | 52.27 | 2,272 | 47.73 |
| Pinglin District (坪林區) | 2,255 | 55.46 | 1,811 | 44.54 |
| Sanzhi District (三芝區) | 4,915 | 40.60 | 7,191 | 59.40 |
| Shimen District (石門區) | 2,928 | 41.30 | 4,162 | 58.70 |
| Bali District (八里區) | 8,982 | 46.00 | 10,545 | 54.00 |
| Pingxi District (平溪區) | 1,417 | 46.72 | 1,616 | 53.28 |
| Shuangxi District (雙溪區) | 2,423 | 44.18 | 3,062 | 55.82 |
| Gongliao District (貢寮區) | 3,698 | 54.21 | 3,123 | 45.79 |
| Jinshan District (金山區) | 5,344 | 46.11 | 6,246 | 53.89 |
| Wanli District (萬里區) | 4,928 | 42.95 | 6,547 | 57.05 |
| Wulai District (烏來區) | 1,399 | 35.23 | 2,572 | 64.77 |
| 2018 New Taipei City mayoral results[27] | |||||
|---|---|---|---|---|---|
| No. | Candidate | Party | Votes | Percentage | |
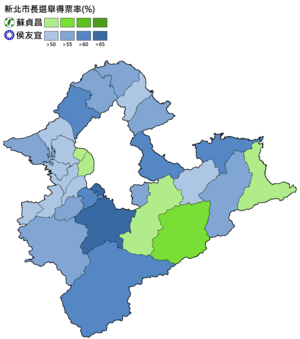
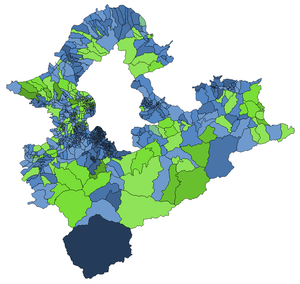
| 1 | Su Tseng-chang (蘇貞昌) | Democratic Progressive Party | 873,692 | 42.85% | |
| 2 | Hou You-yi (侯友宜) | 1,165,130 | 57.15% | ||
| Total voters | 3,264,128 | ||||
| Valid votes | 2,038,822 | ||||
| Invalid votes | 50,305 | ||||
| Voter turnout | 62.46% | ||||
Taoyuan
Political context prior to the elections
|
In late 2014, Taoyuan City was upgraded to special municipality status from Taoyuan County.[28] Taoyuan is known for its diversity, mostly migrants from South East Asia region. Before the 1990s, Taoyuan County has been long held by Kuomintang except 1977-1979, 1997-2001 and 2014 until present. In the 1997 by-election, the Democratic Progressive Party nominated Annette Lu, winning the seat over the Kuomintang and subsequently won it until the 2001 local election. In 2001 local election, Kuomintang won the seat back from the DPP for three straight terms in 13 years until 2014 local election, losing to the Democratic Progressive Party-nominated candidate Cheng Wen-tsan by 30,000 votes.[29] |
| ||||||||||||||||||||||||||

| Party | Year | Vote share % |
|---|---|---|
| Democratic Progressive Party | 1997 local election | 56% |
| 2008 presidential election | 65% |
| Party | Presidential % | Legislative seats | Legislative % |
|---|---|---|---|
| Democratic Progressive Party | 51.03% | 3 | 39.48% |
| 34.39% | 2 | 45.20% | |
| - | 0 | 0.78% | |
| Taiwan Solidarity Union | - | 0 | - |
| 14.59% | 0 | - | |
| - | 1 | 14.54% |
Results of the primary
| 2018 Democratic Progressive Party Taichung City mayoral primary results | ||||
|---|---|---|---|---|
| Candidates | Place | Result | ||
| Cheng Wen-tsan | Nominated | Walkover | ||
| 2018 Kuomintang Taoyuan City mayoral primary results | ||||
|---|---|---|---|---|
| Candidates | Place | Results | ||
| Apollo Chen | Nominated | 35.689% | ||
| Lu Ming-zhe | 2nd | 33.067% | ||
| Yang Li-huan | 3rd | 31.245% | ||
Opinion polls
| Poll organization | Date of completion | Cheng Wen-tsan | Lead | |||
|---|---|---|---|---|---|---|
| TVBS | June 24, 2017 | 61% | 21% | - | 18% | 40% |
| Yam News | October 24, 2017 | 48.82% | 51.18% | - | 0% | 2.36% |
| GSSC | November 1, 2017 | 54.3% | 25.1% | - | 20.6% | 29.2% |
| TISR | December 13, 2017 | 53.6% | 20.2% | - | 26.2% | 33.4% |
| ETtoday | April 2, 2018 | 46.7% | 31.7% | - | 21.6% | 15% |
| Taiwan Brain Trust | May 22, 2018 | 61.4% | 17.8% | - | 20.8% | 43.6% |
| China Times | June 12, 2018 | 51.5% | 24.9% | - | 21.5% | 26.6% |
| I'm Taiwanese | June 23, 2018 | 59.3% | 29.6% | - | 11.1% | 29.7% |
| TVBS | July 20, 2018 | 56% | 20% | - | 24% | 36% |
| Liberty Times Net | August 10, 2018 | 56.2% | 16.0% | - | 27.8% | 40.2% |
| ETtoday1 | August 20, 2018 | 50.7% | 23.8% | – | 25.5% | 26.9% |
| TVBS2 | September 16, 2018 | 56% | 17% | 6% | 25.5% | 39% |
| Shih Hsin University3 | September 4, 2018 | 42.3% | 18.5% | 5.4% | 33.7% | 23.8% |
| UDN4 | September 25, 2018 | 51% | 16% | 6% | 26% | 35% |
| Shih Hsin University5 | November 20, 2018 | 36.9% | 26.8% | 2.4% | 32.9% | 10.1% |
| Sanli6 | November 7, 2018 | 58.1% | 16.9% | 4.5% | 18.0% | 41.2% |
| ETtoday | November 8, 2018 | 45.9% | 27.6% | -% | 26.5% | 18.3% |
Note:* Opinion polls includes independent candidates.
1: | ||||||
Results
| District | Cheng Wen-tsan | |||||||||
|---|---|---|---|---|---|---|---|---|---|---|
| Votes | % | Votes | % | Votes | % | Votes | % | Votes | % | |
| Taoyuan District (桃園區) | 4,084 | 2.10 | 73,799 | 37.98 | 14,752 | 7.59 | 424 | 0.22 | 101,241 | 52.11 |
| Zhongli District (中壢區) | 3,250 | 1.68 | 88,154 | 45.69 | 6,829 | 3.54 | 561 | 0.29 | 94,164 | 48.80 |
| Daxi District (大溪區) | 610 | 1.28 | 16,271 | 34.10 | 1,897 | 3.98 | 190 | 0.40 | 28,746 | 60.25 |
| Yangmei District (楊梅區) | 1,204 | 1.55 | 32,538 | 41.85 | 3,387 | 4.36 | 348 | 0.45 | 40,272 | 51.80 |
| Luzhu District (蘆竹區) | 1,610 | 2.23 | 24,164 | 33.50 | 4,197 | 5.82 | 214 | 0.30 | 41,938 | 58.15 |
| Dayuan District (大園區) | 795 | 1.77 | 13,865 | 30.80 | 2,508 | 5.57 | 201 | 0.45 | 27,652 | 61.42 |
| Guishan District (龜山區) | 1,372 | 1.89 | 26,791 | 36.96 | 4,071 | 5.62 | 256 | 0.35 | 39,998 | 55.18 |
| Bade District (八德區) | 1,633 | 1.74 | 36,314 | 38.61 | 4,174 | 4.44 | 273 | 0.29 | 51,667 | 54.93 |
| Longtan District (龍潭區) | 979 | 1.64 | 27,385 | 45.77 | 2,296 | 3.84 | 568 | 0.95 | 28,610 | 47.81 |
| Pingzhen District (平鎮區) | 1,694 | 1.58 | 45,697 | 42.62 | 3,846 | 3.59 | 483 | 0.45 | 55,507 | 51.77 |
| Xinwu District (新屋區) | 370 | 1.29 | 9,164 | 31.94 | 1,434 | 5.00 | 141 | 0.49 | 17,581 | 61.28 |
| Guanyin District (觀音區) | 556 | 1.64 | 10,126 | 29.80 | 1,833 | 5.39 | 176 | 0.52 | 21,285 | 62.65 |
| Fuxing District (復興區) | 43 | 0.61 | 2,966 | 42.35 | 294 | 4.20 | 32 | 0.46 | 3,669 | 52.38 |
| 2018 Taoyuan City mayoral results[30] | |||||
|---|---|---|---|---|---|
| No. | Candidate | Party | Votes | Percentage | |
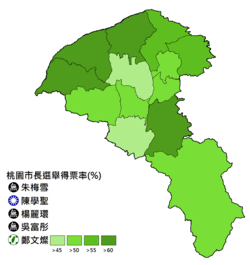
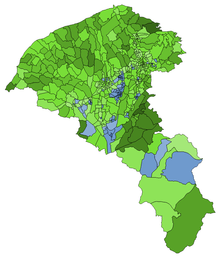
| 1 | Chu Mei-sheue (朱梅雪) | 18,200 | 1.76% | ||
| 2 | Apollo Chen (陳學聖) | 407,234 | 39.42% | ||
| 3 | Yang Li-huan (楊麗環) | 51,518 | 4.99% | ||
| 4 | Wu Fu-tun (吳富彤) | 3,867 | 0.37% | ||
| 5 | Cheng Wen-tsan (鄭文燦) | Democratic Progressive Party | 552,330 | 53.46% | |
| Total voters | 1,732,591 | ||||
| Valid votes | 1,033,149 | ||||
| Invalid votes | |||||
| Voter turnout | 59.63% | ||||
Taichung
Political context prior to the elections
|
| |||||||||||||||||||||||||||||||||||||||||||||||||||||||||||||
Taichung City is the second largest metropolis in Taiwan, serves as the economic, cultural and transportation hub in the central part of Taiwan. It was merged and reorganized at the end of 2010 by Taichung County and Taichung City forming Taichung City.[31] The former Taichung County was controlled by the Kuomintang except in 1997, the Democratic Progressive Party's Liao Yung-lai was elected as the county mayor.
Taichung City before in the 1980s are held by Independent or Kuomintang's Zhang and Lai factions. In the 1980s, the Kuomintang changed its nomination strategy to regain its power, by choosing non-faction candidates defeated Tzeng Wen-po (曾文坡), who is seeking for re-election in 1981, starting a four straight terms in 16 years. In 1997, the Democratic Progressive Party's Chang Wen-ying was elected for Taichung City mayor due to the Pan blue coalition split.[32]
In 2001, Kuomintang's Jason Hu was elected as Taichung City mayor until 2010's merger and won the third term as the first mayor of the newly formed Taichung City with 36,351 votes.[33] In 2014, Democratic Progressive Party's candidate Lin Chia-lung won 57% of the votes, elected as the Taichung City mayor due to unhappiness towards the Kuomintang government.
.svg.png)
| Party | Year | Vote share % |
|---|---|---|
| Democratic Progressive Party | 2014 local election | 57% |
| 2008 presidential election | 60% |
| Party | Presidential % | Legislative seats | Legislative % |
|---|---|---|---|
| Democratic Progressive Party | 55.01% | 4 | 39.26% |
| 29.82% | 3 | 43.03% | |
| - | 1 | 6.58% | |
| Taiwan Solidarity Union | - | 0 | 5.92% |
| 15.1731% | 0 | - | |
| - | 0 | 5.21% |
Results of the primary
| 2018 Democratic Progressive Party Taichung City mayoral primary results | ||||
|---|---|---|---|---|
| Candidates | Place | Result | ||
| Lin Chia-lung | Nominated | Walkover | ||
| 2018 Kuomintang Taichung City mayoral primary results | ||||
|---|---|---|---|---|
| Candidates | Place | Results | ||
| Lu Shiow-yen | Nominated | 50.308% | ||
| Johnny Chiang | 2nd | 49.692% | ||
Opinion polls
| Poll organization | Dates conducted | Lin Chia-lung | Lead | |||
|---|---|---|---|---|---|---|
| TISR | July 20, 2017 | 40.1% | 28.8% | 31.1% | 11.3% | |
| Apollo | August 3, 2017 | 44.2% | 32.2% | 23.4% | 12% | |
| TVBS | August 29, 2017 | 52% | 32.0% | 16.0% | 20% | |
| Sanli | September 5, 2017 | 49.5% | 23.8% | 26.7% | 15.7% | |
| China Times | November 1, 2017 | 44.4% | 29.3% | 26.3% | 15.1% | |
| ETtoday | November 3, 2017 | 37.0% | 34.1% | 28.9% | 2.9% | |
| Formosa | November 7, 2017 | 37.4% | 33.1% | 29.5% | 4.3% | |
| GSSC | November 28, 2017 | 52.1% | 28.0% | 19.9% | 24.1% | |
| Sanli | December 6, 2017 | 47.7% | 25.3% | 27.0% | 22.4% | |
| TISR | December 6, 2017 | 40.1% | 17.2% | 42.7% | 22.9% | |
| Era Com | December 28, 2017 | 36.1% | 35.1% | 28.8% | 1% | |
| Formosa | February 9, 2018 | 35.8% | 37.6% | 26.6% | 1.8% | |
| China Times | February 12, 2018 | 36.4% | 30.6% | 33.0% | 5.8% | |
| ETtoday | March 5, 2018 | 32.6% | 32.0% | 35.4% | 0.6% | |
| ETtoday | March 14, 2018 | 47.1% | 33.7% | 19.2% | 13.4% | |
| TISR | April 21, 2018 | 31.9% | 23.7% | 44.4% | 8.2% | |
| Apollo | May 3, 2018 | 33.0% | 35.7% | 31.3% | 2.7% | |
| Taiwan Brain Trust | May 22, 2018 | 43.0% | 32.2% | 24.8% | 10.8% | |
| UDN | May 28, 2018 | 32.0% | 39.0% | 29.0% | 7% | |
| Kuomintang | May 28, 2018 | 33.0% | 39.7% | 27.3% | 6.7% | |
| TVBS | July 20, 2018 | 33.0% | 39.0% | 28.0% | 6% | |
| Taiwan Brain Trust | July 31, 2018 | 37.8% | 35.6% | 26.6% | 2.2% | |
| CM Media | July 31, 2018 | 43.9% | 31.1% | 25.0% | 12.8% | |
| Cross Strait Association | July 31, 2018 | 43.2% | 24.4% | 32.4% | 18.8% | |
| Taiwan Competitiveness Forum | August 10, 2018 | 35.8% | 38.0% | 28.0% | 2.2% | |
| ETtoday | August 14, 2018 | 31.0% | 35.6% | 23.7% | 4.6% | |
| Liberty News Net | August 24, 2018 | 38.52% | 32.41% | 29.07% | 6.11% | |
| Taiwan Brain Trust | August 27, 2018 | 42% | 33.5% | 24.5% | 8.5% | |
| UDN | September 13, 2018 | 33% | 34% | 32% | 1% | |
| TISR | September 15, 2018 | 26.8% | 28.6% | 32.8% | 1.8% | |
| Shih Shin University3 | September 15, 2018 | 30.3% | 30.9% | 38.7% | 0.6% | |
| TVBS4 | September 16, 2018 | 35% | 38% | 27% | 3% | |
| China Times5 | September 26, 2018 | 38.1% | 40.2% | 15.9% | 2.1% | |
| Kuomintang | September 30, 2018 | 33.6% | 40.1% | 24.6% | 6.5% | |
| CM Media6 | October 4, 2018 | 40% | 34.6% | 22.3% | 5.4% | |
| Taiwan Next Gen Foundation | October 14, 2018 | 41.4% | 31.1% | 27.5% | 10.3% | |
| Formosa7 | October 17, 2018 | 25.6% | 31% | 29.3% | 5.4% | |
| TVBS8 | October 22, 2018 | 36% | 44% | 19% | 8% | |
| Taiwan Competitiveness Forum9 | October 27, 2018 | 27.1% | 34.4% | 30.3% | 7.3% | |
| Formosa10 | November 1, 2018 | 28.7% | 35.7% | 21.7% | 7% | |
| CM Media10 | November 3, 2018 | 39.2% | 33.4% | 23% | 5.8% | |
| ETtoday12 | November 4, 2018 | 31.8% | 42.6% | 19.6% | 10.8% | |
| UDN13 | November 5, 2018 | 30% | 43% | 25% | 13% | |
| Sanli14 | November 6, 2018 | 45.1% | 34% | 18.3% | 11.1% | |
| ETtoday | November 8, 2018 | 31.7% | 45.4% | 22.9% | 13.7% | |
| Shih Shin University15 | November 10, 2018 | 32.0% | 34.4% | 32.8% | 2.4% | |
| Taiwan Next Gen Foundation | November 11, 2018 | 41.4% | 35.6% | 23% | 5.8% | |
| TVBS16 | November 12, 2018 | 39% | 41% | 19% | 2% | |
Note:* Opinion polls includes independent candidates.
1: | ||||||
Predictions
| Poll organization | Date of completion | Turnout | Lin Chia-lung | ||
|---|---|---|---|---|---|
| TVBS | October 22, 2018 | 71% | 50% | 49% | 1% |
| Formosa | October 26, 2018 | 83.9% | 49% ~ 51.4% | 45% ~ 47.2% | 2.9% ~ 4.3% |
Results
| District | Lin Chia-lung | |||||
|---|---|---|---|---|---|---|
| Votes | % | Votes | % | Votes | % | |
| Central District (中區) | 86 | 0.94 | 4,173 | 45.77 | 4,859 | 53.29 |
| East District (東區) | 458 | 1.10 | 19,078 | 45.87 | 22,055 | 53.03 |
| South District (南區) | 658 | 0.99 | 28,330 | 42.77 | 37,250 | 56.24 |
| West District (西區) | 618 | 1.03 | 25,616 | 42.86 | 33,534 | 56.11 |
| North District (北區) | 745 | 0.97 | 30,187 | 39.36 | 45,769 | 59.67 |
| Xitun District (西屯區) | 1,083 | 0.97 | 43,307 | 38.73 | 67,437 | 60.30 |
| Nantun District (南屯區) | 914 | 1.08 | 34,396 | 40.73 | 49,134 | 58.19 |
| Beitun District (北屯區) | 1,268 | 0.91 | 53,504 | 38.42 | 84,485 | 60.67 |
| Fengyuan District (豐原區) | 986 | 1.10 | 42,504 | 47.27 | 46,436 | 51.64 |
| Dongshi District (東勢區) | 330 | 1.13 | 10,727 | 36.64 | 18,216 | 62.23 |
| Dajia District (大甲區) | 484 | 1.15 | 18,523 | 44.14 | 22,958 | 54.71 |
| Qingshui District (清水區) | 525 | 1.07 | 22,912 | 46.80 | 25,523 | 52.13 |
| Shalu District (沙鹿區) | 530 | 1.10 | 20,835 | 43.27 | 26,784 | 55.63 |
| Wuqi District (梧棲區) | 365 | 1.19 | 14,663 | 47.67 | 15,729 | 51.14 |
| Houli District (后里區) | 420 | 1.36 | 12,815 | 41.46 | 17,677 | 57.18 |
| Shengang District (神崗區) | 424 | 1.16 | 18,095 | 49.65 | 17,928 | 49.19 |
| Tanzi District (潭子區) | 581 | 1.01 | 24,836 | 43.30 | 31,938 | 55.68 |
| Daya District (大雅區) | 592 | 1.21 | 20,342 | 41.74 | 27,797 | 57.04 |
| Xinshe District (新社區) | 209 | 1.39 | 6,009 | 40.10 | 8,767 | 58.51 |
| Shigang District (石岡區) | 110 | 1.21 | 3,571 | 39.35 | 5,393 | 59.43 |
| Waipu District (外埔區) | 215 | 1.17 | 7,124 | 38.76 | 11,040 | 60.07 |
| Da'an District (大安區) | 148 | 1.24 | 5,009 | 42.13 | 6,732 | 56.62 |
| Wuri District (烏日區) | 465 | 1.15 | 16,911 | 41.93 | 22,951 | 56.91 |
| Dadu District (大肚區) | 388 | 1.22 | 13,558 | 42.68 | 17,821 | 56.10 |
| Longjing District (龍井區) | 572 | 1.38 | 18,048 | 43.62 | 22,757 | 55.00 |
| Wufeng District (霧峰區) | 415 | 1.11 | 16,151 | 43.07 | 20,936 | 55.83 |
| Taiping District (太平區) | 1,057 | 1.12 | 40,025 | 42.27 | 53,613 | 56.62 |
| Dali District (大里區) | 1,202 | 1.14 | 46,571 | 44.23 | 57,527 | 54.63 |
| Heping District (和平區) | 71 | 1.01 | 2,035 | 28.84 | 4,950 | 70.15 |
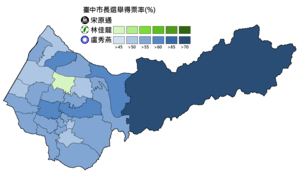
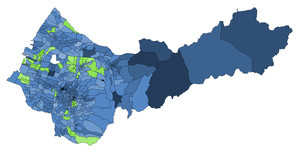
| 2018 Taichung City mayoral results | |||||
|---|---|---|---|---|---|
| No. | Candidate | Party | Votes | Percentage | |
| 1 | Sung Antony (宋原通) | 15,919 | 1.09% | ||
| 2 | Lin Chia-lung (林佳龍) | Democratic Progressive Party | 619,855 | 42.35% | |
| 3 | Lu Shiow-yen (盧秀燕) | 827,996 | 56.57% | ||
| Total voters | 2,213,789 | ||||
| Valid votes | 1,463,770 | ||||
| Invalid votes | |||||
| Voter turnout | 66.12% | ||||
Tainan
Political context prior to the elections
|
| |||||||||||||||||||||||||||||||||||||||||||||||||||||||||||||
Tainan City is located in Taiwan's Chia-Nan Plain, is a cultural capital for its history. Tainan City was merged and reorganized at the end of 2010, merging with Tainan County of Taiwan Province.[34]
The original Tainan County in the 1990s, Kuomintang local faction took turns taking control. However, Tainan County turned blue to green until Democratic Progressive Party's candidate Mark Chen became the mayor in 1993 until the merger between the county and the city was since led by the Democratic Progressive Party.[35]
The original Tainan City was dominated by Independents and the Kuomintang government for many years before the 1990s. Since 1997, the Democratic Progressive Party candidate Helen Chang was elected mayor, the former Tainan City since had been governed by the Democratic Progressive Party at the county level. After the merger of counties and cities in 2010, the DPP's William Lai was also elected as mayor.[36]
.svg.png)
| Party | Year | Vote share % |
|---|---|---|
| Democratic Progressive Party | 2014 local election | 73% |
| 2008 presidential election | 46% |
| Party | Presidential % | Legislative seats | Legislative % |
|---|---|---|---|
| Democratic Progressive Party | 67.52% | 5 | 69.95% |
| 22.07% | 0 | 24.80% | |
| - | 0 | 0.69% | |
| Taiwan Solidarity Union | - | 0 | - |
| 10.41% | 0 | - | |
| - | 0 | 4.56% |
Results of the primary
| 2018 Democratic Progressive Party Tainan City mayoral primary results | ||||
|---|---|---|---|---|
| Candidates | Place | Results | ||
| Huang Wei-cher | Nominated | 41.58% | ||
| Chen Ting-fei | 2nd | 28.17% | ||
| Yen Chun-zuo | 3rd | 6.72% | ||
| Wang Ding-yu | 4th | 5.13% | ||
| Li Jun-yi | 5th | 2.11% | ||
| Yeh Yi-jin | 6th | 0.76% | ||
| 2018 Kuomintang Tainan City mayoral primary results | ||||
|---|---|---|---|---|
| Candidates | Place | Result | ||
| Kao Su-po | Nominated | Results not released | ||
| Huang Hsiu-shuang | 2nd | Results not released | ||
Opinion polls
| Poll organization | Dates conducted | Huang Wei-cher | Lead | |||
|---|---|---|---|---|---|---|
| Taiwan Brain Trust1 | May 22, 2018 | 42.3% | 18.7% | - | 30.6% | 23.6% |
| ETtoday | May 24, 2018 | 31.2% | 18.5% | 2.9% | 30.2% | 12.7% |
| China Times2 | June 11, 2018 | 40.3% | 17.3% | - | 29.7% | 23% |
| Evidence-Based3 | June 25, 2018 | 37.8% | 8.0% | 4.7% | 41.7% | 29.8% |
| TVBS4 | July 6, 2018 | 41% | 15% | 7% | 20% | 26% |
| Taiwan Competitiveness Forum5 | July 13, 2018 | 31.7% | 16.1% | 6.6% | 32.3% | 15.6% |
| Era Com6 | July 14, 2018 | 36.66% | 13.09% | 8.21% | 28.99% | 23.57% |
| Evidence Based7 | August 3, 2018 | 40.0% | 12.1% | 11.9% | 25.6% | 27.9% |
| Liberty News Net8 | August 17, 2018 | 40.6% | 11.6% | 9.7% | 32% | 29% |
| ETtoday | August 27, 2018 | 31.3% | 15.9% | 14.1% | 26.7% | 15.4% |
| Real Survey9 | September 6, 2018 | 24.5% | 16.4% | 12.0% | 39% | 8.1% |
| Evidence Based10 | September 11, 2018 | 35.8% | 14.1% | 14.3% | 24.7% | 11.7% |
| Kao Su-po Campaign Team11 | September 13, 2018 | 22.9% | 19.0% | 13.9% | 33.8% | 3.9% |
| DPP | September 13, 2018 | 39.9% | 14.7% | 14.6% | 26.5% | 25.2% |
| Shih Shin University12 | September 13, 2018 | 23.9% | 13.8% | 5.9% | 48.1% | 10.1% |
| TVBS13 | September 16, 2018 | 33% | 14% | 13% | 40% | 19% |
| UDN14 | September 25, 2018 | 31% | 12% | 14% | 35% | 17% |
| Kao Su-po Campaign Team15 | October 3, 2018 | 28.1% | 20.1% | 11.8% | 28.5% | 8% |
| ETtoday | October 7, 2018 | 30.8% | 19.1% | 14.2% | 22.1% | 11.7% |
| Evidence Based16 | October 9, 2018 | 34.5% | 13.6% | 15.3% | 28.1% | 19.2% |
| Taiwan Competitiveness Forum17 | October 19. 2018 | 27.5% | 20.3% | 10.9% | 31.6% | 7.2% |
| Evidence Based18 | October 26. 2018 | 31.7% | 15.5% | 12.9% | 32.5% | 16.2% |
| China Times19 | October 28. 2018 | 24.6% | 17.6% | 15.7% | 35.7% | 7% |
| Taiwan Competitiveness Forum20 | November 4, 2018 | 29.1% | 25.9% | 12.6% | 18.9% | 3.2% |
| Shih Shin University21 | November 5, 2018 | 25.6% | 21.1% | 6.5% | 40.7% | 4.5% |
| ETtoday | November 8, 2018 | 30.5% | 19.1% | 17.6% | 33.2% | 11.4% |
| Taiwan Competitiveness Forum22 | November 9, 2018 | 30.4% | 31.6% | 10.6% | 16.7% | 1.2% |
Note:* Opinion polls includes independent candidates.
1: | ||||||
Results


| District | Huang Wei-cher | |||||||||||
|---|---|---|---|---|---|---|---|---|---|---|---|---|
| Votes | % | Votes | % | Votes | % | Votes | % | Votes | % | Votes | % | |
| Sinying District (新營區) | 13,462 | 35.26 | 14,120 | 36.98 | 4,359 | 11.42 | 1,616 | 4.23 | 3,176 | 8.32 | 1,448 | 3.79 |
| Yanshuei District (鹽水區) | 6,555 | 45.92 | 3,981 | 27.89 | 1,618 | 11.33 | 566 | 3.96 | 862 | 6.04 | 694 | 4.86 |
| Baihe District (白河區) | 7,130 | 46.44 | 4,715 | 30.71 | 1,371 | 8.93 | 562 | 3.66 | 705 | 4.59 | 871 | 5.67 |
| Liouying District (柳營區) | 5,212 | 42.68 | 3,630 | 29.72 | 1,578 | 12.92 | 506 | 4.14 | 777 | 6.36 | 510 | 4.18 |
| Houbi District (後壁區) | 6,345 | 45.95 | 3,940 | 28.53 | 1,458 | 10.56 | 552 | 4.00 | 662 | 4.79 | 852 | 6.17 |
| Dongshan District (東山區) | 4,627 | 42.01 | 3,742 | 33.97 | 1,111 | 10.09 | 495 | 4.49 | 475 | 4.30 | 565 | 5.13 |
| Madou District (麻豆區) | 11,716 | 48.58 | 5,630 | 23.34 | 2,086 | 8.65 | 1,402 | 5.81 | 2,343 | 9.71 | 941 | 3.90 |
| Xiaying District (下營區) | 5,492 | 42.59 | 3,767 | 29.21 | 1,449 | 11.24 | 664 | 5.15 | 1,031 | 8.00 | 492 | 3.82 |
| Lioujia District (六甲區) | 5,309 | 43.24 | 3,260 | 26.55 | 1,381 | 11.25 | 674 | 5.49 | 1,022 | 8.32 | 633 | 5.16 |
| Guantian District (官田區) | 5,514 | 45.37 | 3,107 | 25.56 | 1,265 | 10.41 | 678 | 5.58 | 1,025 | 8.43 | 565 | 4.65 |
| Danei District (大內區) | 2,271 | 39.13 | 1,687 | 29.07 | 673 | 11.60 | 397 | 6.84 | 481 | 8.29 | 295 | 5.08 |
| Jiali District (佳里區) | 12,783 | 40.53 | 9,178 | 29.10 | 3,005 | 9.53 | 2,001 | 6.34 | 3,366 | 10.67 | 1,205 | 3.82 |
| Syuejia District (學甲區) | 6,509 | 47.08 | 3,860 | 27.92 | 1,228 | 8.88 | 570 | 4.12 | 1,107 | 8.01 | 552 | 3.99 |
| Sigang District (西港區) | 6,041 | 43.79 | 3,593 | 26.05 | 1,387 | 10.06 | 722 | 5.23 | 1,536 | 11.14 | 515 | 3.73 |
| Cigu District (七股區) | 5,670 | 43.39 | 3,251 | 24.88 | 1,347 | 10.31 | 960 | 7.35 | 1,144 | 8.75 | 695 | 5.32 |
| Jiangjyun District (將軍區) | 5,438 | 45.68 | 3,109 | 26.12 | 1,115 | 9.37 | 873 | 7.33 | 912 | 7.66 | 457 | 3.84 |
| Beimen District (北門區) | 2,757 | 42.63 | 1,877 | 29.02 | 652 | 10.08 | 395 | 6.11 | 448 | 6.93 | 339 | 5.24 |
| Sinhua District (新化區) | 9,154 | 38.46 | 7,591 | 31.89 | 2,223 | 9.34 | 1,102 | 4.63 | 2,822 | 11.86 | 911 | 3.83 |
| Shanhua District (善化區) | 9,435 | 39.40 | 6,948 | 29.02 | 2,001 | 8.36 | 1,583 | 6.61 | 2,878 | 12.02 | 1,099 | 4.59 |
| Sinshih District (新市區) | 7,027 | 37.42 | 5,034 | 26.81 | 1,605 | 8.55 | 2,012 | 10.71 | 2,340 | 12.46 | 762 | 4.06 |
| Anding District (安定區) | 6,643 | 40.09 | 4,752 | 28.67 | 1,576 | 9.51 | 899 | 5.42 | 1,997 | 12.05 | 705 | 4.25 |
| Shanshang District (山上區) | 1,521 | 37.37 | 1,244 | 30.57 | 467 | 11.47 | 217 | 5.33 | 423 | 10.39 | 198 | 4.86 |
| Yujing District (玉井區) | 2,656 | 32.54 | 3,442 | 42.17 | 665 | 8.15 | 302 | 3.70 | 632 | 7.74 | 465 | 7.74 |
| Nansi District (楠西區) | 1,576 | 28.48 | 2,687 | 48.56 | 400 | 7.23 | 218 | 3.94 | 353 | 6.38 | 299 | 5.40 |
| Nanhua District (南化區) | 1,792 | 33.17 | 2,229 | 41.26 | 474 | 8.77 | 173 | 3.20 | 402 | 7.44 | 332 | 6.15 |
| Zuojhen District (左鎮區) | 1,233 | 41.80 | 939 | 31.83 | 195 | 6.61 | 211 | 7.15 | 221 | 7.49 | 151 | 5.12 |
| Rende District (仁德區) | 14,717 | 36.41 | 12,883 | 31.88 | 3,522 | 8.71 | 1,537 | 3.80 | 5,911 | 14.63 | 1,846 | 4.57 |
| Gueiren District (歸仁區) | 13,413 | 37.57 | 9,264 | 25.95 | 2,942 | 8.24 | 1,292 | 3.62 | 7,202 | 20.17 | 1,588 | 4.45 |
| Guanmiao District (關廟區) | 7,670 | 37.11 | 5,323 | 25.76 | 1,580 | 7.65 | 573 | 2.77 | 4,778 | 23.12 | 742 | 3.59 |
| Longci District (龍崎區) | 814 | 29.24 | 676 | 24.28 | 180 | 6.47 | 82 | 2.95 | 917 | 32.94 | 115 | 4.13 |
| Yongkang District (永康區) | 38,762 | 34.70 | 38,892 | 34.81 | 9,587 | 8.58 | 4,676 | 4.19 | 15,007 | 13.43 | 4,787 | 4.29 |
| East District (東區) | 28,636 | 32.27 | 36,041 | 40.61 | 5,457 | 6.15 | 3,522 | 3.97 | 11,681 | 13.16 | 3,410 | 3.84 |
| South District (南區) | 25,068 | 39.35 | 21,036 | 33.02 | 5,430 | 8.52 | 2,585 | 4.06 | 7,661 | 12.03 | 1,925 | 3.02 |
| North District (北區) | 22,694 | 34.49 | 24,690 | 37.52 | 4,510 | 6.85 | 2,851 | 4.33 | 8,547 | 12.99 | 2,515 | 3.82 |
| Annan District (安南區) | 36,754 | 38.42 | 27,865 | 29.13 | 9,225 | 9.64 | 4,807 | 5.02 | 13,357 | 13.96 | 3,655 | 3.82 |
| Anping District (安平區) | 10,276 | 34.24 | 11,056 | 36.84 | 2,479 | 8.26 | 1,034 | 3.45 | 4,075 | 13.58 | 1,088 | 3.63 |
| West Central District (中西區) | 14,846 | 37.54 | 13,835 | 34.98 | 2,552 | 6.45 | 1,859 | 4.70 | 4,904 | 12.40 | 1,556 | 3.93 |
| 2018 Tainan City mayoral results[37] | |||||
|---|---|---|---|---|---|
| No. | Candidate | Party | Votes | Percentage | |
| 1 | Huang Wei-cher (黃偉哲) | Democratic Progressive Party | 367,518 | 38.02% | |
| 2 | Kao Su-po (高思博) | 312,874 | 32.37% | ||
| 3 | Lin Yi-feng (林義豐) | 84,153 | 8.71% | ||
| 4 | Hsu Chun-hsin (許忠信) | 45,168 | 4.67% | ||
| 5 | Chen Yung-ho (陳永和) | 117,179 | 12.12% | ||
| 6 | Su Huan-chih (蘇煥智) | 39,778 | 4.11% | ||
| Total voters | 1,546,862 | ||||
| Valid votes | 966,670 | ||||
| Invalid votes | |||||
| Voter turnout | 62.49% | ||||
Kaohsiung
Political context prior to the elections
|
| |||||||||||||||||||||||||||||||||||||||||||||||||||||||||||

Kaohsiung is the third largest city in Taiwan and capital of the political and economic center of the southern region. The special municipality city is merged in 2010 with Kaohsiung County from Taiwan Province.[38] The former Kaohsiung County before the 1980s is led by the Kuomintang, and the independents until 1985 where Democratic Progressive Party has led the county until the merger of the county and city.
Since the implementation of local autonomy in 1950, the former Kaohsiung City has been led by the KMT except the 6th mayor Yang Jinhu, who was a non-KMT candidate. After Kaohsiung was elevated into a municipality in 1979, the mayor was appointed by the Central Government and opened up first election in 1994 where Kuomintang's Wu Den-yih was first elected mayor of the city. In 1998, the Democratic Progressive Party's Frank Hsieh won the mayoral election by a slim margin over the incumbent mayor Wu Den-yih, starting the DPP's straight 4 terms, 16 years rule until the merger.
.svg.png)
| Party | Year | Vote share % |
|---|---|---|
| Democratic Progressive Party | 2014 local election | 68% |
| 2008 legislative election | 51% |
| Party | Presidential % | Legislative seats | Legislative % |
|---|---|---|---|
| Democratic Progressive Party | 63.39% | 9 | 61% |
| 26.00% | 0 | 34.86% | |
| - | 0 | 1.06% | |
| Taiwan Solidarity Union | - | 0 | - |
| 10.60% | 0 | - | |
| - | 0 | 3.08% |
Results of the primary
| 2018 Democratic Progressive Party Kaohsiung City mayoral primary results | |||||
|---|---|---|---|---|---|
| Candidates | Place | DPP | Focus Survey Research | Statinc | Aggregated Result |
| Chen Chi-mai | Nominated | 38.64% | 32.61% | 36.45% | 35.90% |
| None of the candidates | 32.71% | 31.76% | 34.74% | 33.07% | |
| Chao Tien-lin | 2nd | 12.63% | 17.95% | 12.77% | 14.45% |
| Lin Tai-hua | 3rd | 10.69% | 12.06% | 10.92% | 11.22% |
| Kuan Bi-ling | 4th | 5.33% | 5.61% | 5.12% | 5.35% |
| 2018 Kuomintang Kaohsiung City mayoral primary results | ||||
|---|---|---|---|---|
| Candidates | Place | Result | ||
| Han Kuo-yu | Nominated | 64.898% | ||
| Arthur Chen | 2nd | 35.102% | ||
Opinion polls
| Poll organization | Dates conducted | Chen Chi-mai | Lead | |||
|---|---|---|---|---|---|---|
| TVBS | August 15, 2017 | 59% | 31% | 10% | 28% | |
| Taiwan Brain Trust | May 22, 2018 | 52% | 21% | 27% | 31% | |
| China Times | May 29, 2018 | 39.5% | 33.1% | - | 6.4% | |
| All Opinions | June 20, 2018 | 37.6% | 26.2% | 36.2% | 11.4% | |
| GSSC | June 27, 2018 | 46.9% | 23.9% | 29.2% | 23% | |
| ETtoday1 | June 27, 2018 | 32.0% | 30.4% | 24.7% | 1.6% | |
| TVBS | July 4, 2018 | 40% | 32% | 28% | 8% | |
| GSSC | July 27, 2018 | 45.7% | 27.3% | 21.7% | 18.4% | |
| Liberty Times Net | August 3, 2018 | 38.46% | 26.42% | 35.22% | 12.04% | |
| Formosa | August 13, 2018 | 38.9% | 27.8% | 33.3% | 11.1% | |
| Wu Yi-zheng Campaign Team | August 17, 2018 | 33.5% | 25.7% | 34% | 7.8% | |
| ETtoday2 | September 3, 2018 | 36.7% | 31% | 32.3% | 5.7% | |
| TVBS3 | September 16, 2018 | 39% | 35% | 26% | 4% | |
| Shih Shin University4 | September 16, 2018 | 33.8% | 31.2% | 35% | 2.6% | |
| CM Media | September 18, 2018 | 41.2% | 35.5% | 22.9% | 5.7% | |
| TISR5 | September 19, 2018 | 41% | 30.2% | 25.9% | 10.8% | |
| UDN6 | September 20, 2018 | 34% | 32% | 31% | 2% | |
| TVBS8 | October 16, 2018 | 35% | 42% | 21% | 7% | |
| Taiwan Next Gen Foundation9 | October 19, 2018 | 39.8% | 32.5% | 24.7% | 7.3% | |
| Taiwan Competitiveness Forum10 | October 22, 2018 | 32.7% | 39% | 26.3% | 6.3% | |
| Taiwan Competitiveness Forum11 | October 31, 2018 | 32.3% | 43.1% | 22.7% | 10.8% | |
| Apollo12 | November 2, 2018 | 36.2% | 45.3% | 14.6% | 9.3% | |
| Sanli13 | November 4, 2018 | 44.3% | 43.2% | 11.1% | 1.1% | |
| TVBS14 | November 6, 2018 | 38% | 48% | 14% | 10% | |
| Apollo15 | November 7, 2018 | 37.6% | 40.4% | 10% | 2.8% | |
| CM Media16 | November 8, 2018 | 39.1% | 39.3% | 20.3% | 0.2% | |
| ETtoday | November 8, 2018 | 36.6% | 42.6% | 20.8% | 6% | |
| Taiwan Competitiveness Forum17 | November 8, 2018 | 27.1% | 44.1% | 23.8% | 17% | |
| UDN18 | November 12, 2018 | 32% | 49% | 16% | 17% | |
| Shih Shin University19 | November 12, 2018 | 32.6% | 35.4% | 29.9% | 2.8% | |
| Apollo | November 12, 2018 | 38.9% | 42.5% | 14.9% | 3.6% | |
| Sanli20 | November 12, 2018 | 43.6% | 40.5% | 13.9% | 3.1% | |
Note:* Opinion polls includes independent candidates.
1: | ||||||
Predictions
| Poll organization | Date of completion | Turnout | Chen Chi-mai | |
|---|---|---|---|---|
| TVBS | October 16, 2018 | 67% | 49% | 49% |
| TVBS | November 6, 2018 | 72% | 47% | 52% |
Results
.png)
| District | Chen Chi-mai | |||||||
|---|---|---|---|---|---|---|---|---|
| Votes | % | Votes | % | Votes | % | Votes | % | |
| Yancheng District (鹽埕區) | 7,633 | 48.28 | 7,992 | 50.55 | 71 | 0.45 | 113 | 0.71 |
| Gushan District (鼓山區) | 45,816 | 57.04 | 33,547 | 41.77 | 267 | 0.33 | 691 | 0.86 |
| Zuoying District (左營區) | 68,255 | 61.99 | 40,526 | 36.81 | 346 | 0.31 | 978 | 0.89 |
| Nanzih District (楠梓區) | 59,478 | 56.58 | 44,288 | 42.13 | 379 | 0.36 | 973 | 0.93 |
| Sanmin District (三民區) | 105,406 | 52.79 | 91,617 | 45.88 | 772 | 0.39 | 1,872 | 0.94 |
| Sinsing District (新興區) | 16,776 | 53.34 | 14,237 | 45.26 | 107 | 0.34 | 334 | 1.06 |
| Cianjin District (前金區) | 9,120 | 53.83 | 7,608 | 44.91 | 53 | 0.31 | 161 | 0.95 |
| Lingya District (苓雅區) | 57,171 | 54.60 | 46,041 | 43.97 | 401 | 0.38 | 1,098 | 1.05 |
| Cianjhen District (前鎮區) | 59,572 | 52.53 | 52,376 | 46.19 | 472 | 0.42 | 982 | 0.87 |
| Cijin District (旗津區) | 7,993 | 45.49 | 9,360 | 53.27 | 95 | 0.54 | 124 | 0.71 |
| Siaogang District (小港區) | 47,806 | 51.70 | 43,464 | 47.00 | 433 | 0.47 | 764 | 0.83 |
| Fongshan District (鳳山區) | 118,466 | 56.54 | 88,437 | 42.21 | 881 | 0.42 | 1,739 | 0.83 |
| Linyuan District (林園區) | 20,149 | 47.40 | 21,847 | 51.40 | 219 | 0.52 | 293 | 0.69 |
| Daliao District (大寮區) | 35,636 | 52.17 | 31,773 | 46.51 | 372 | 0.54 | 533 | 0.78 |
| Dashu District (大樹區) | 12,945 | 48.33 | 13,493 | 50.38 | 174 | 0.65 | 173 | 0.65 |
| Dashe District (大社區) | 10,378 | 48.89 | 10,512 | 49.52 | 142 | 0.67 | 197 | 0.93 |
| Renwu District (仁武區) | 26,659 | 51.40 | 24,543 | 47.32 | 250 | 0.48 | 412 | 0.79 |
| Niaosong District (鳥松區) | 14,410 | 52.23 | 12,806 | 46.42 | 115 | 0.42 | 258 | 0.94 |
| Gangshan District (岡山區) | 32,410 | 54.93 | 25,829 | 43.78 | 313 | 0.53 | 446 | 0.76 |
| Ciaotou District (橋頭區) | 10,888 | 44.45 | 13,256 | 54.11 | 146 | 0.60 | 207 | 0.85 |
| Yanchao District (燕巢區) | 9,448 | 50.88 | 8,871 | 47.77 | 120 | 0.65 | 130 | 0.70 |
| Tianliao District (田寮區) | 2,252 | 43.58 | 2,768 | 53.56 | 135 | 2.61 | 13 | 0.25 |
| Alian District (阿蓮區) | 8,322 | 47.12 | 8,958 | 50.72 | 254 | 1.44 | 126 | 0.71 |
| Lujhu District (路竹區) | 16,545 | 52.43 | 14,407 | 45.66 | 319 | 1.01 | 284 | 0.90 |
| Hunei District (湖內區) | 9,133 | 49.67 | 8,903 | 48.42 | 187 | 1.02 | 164 | 0.89 |
| Qieding District (茄萣區) | 8,662 | 47.72 | 9,209 | 50.74 | 152 | 0.84 | 127 | 0.70 |
| Yong'an District (永安區) | 4,545 | 49.62 | 4,478 | 48.89 | 61 | 0.67 | 76 | 0.83 |
| Mituo District (彌陀區) | 6,756 | 52.77 | 5,871 | 45.86 | 86 | 0.67 | 89 | 0.70 |
| Ziguan District (梓官區) | 10,509 | 46.81 | 11,646 | 51.87 | 129 | 0.57 | 168 | 0.75 |
| Cishan District (旗山區) | 12,379 | 52.34 | 10,940 | 46.26 | 155 | 0.66 | 177 | 0.75 |
| Meinong District (美濃區) | 15,478 | 61.09 | 9,546 | 37.68 | 125 | 0.49 | 186 | 0.73 |
| Liouguei District (六龜區) | 4,084 | 54.29 | 3,315 | 37.68 | 64 | 0.85 | 59 | 0.78 |
| Jiasian District (六龜區) | 2,339 | 60.17 | 1,483 | 38.15 | 35 | 0.90 | 30 | 0.77 |
| Shanlin District (杉林區) | 4,129 | 56.45 | 3,076 | 42.05 | 53 | 0.72 | 57 | 0.78 |
| Neimen District (內門區) | 5,446 | 53.81 | 4,510 | 44.57 | 85 | 0.84 | 79 | 0.78 |
| Maolin District (茂林區) | 1,281 | 91.83 | 107 | 7.67 | 6 | 0.43 | 1 | 0.07 |
| Taoyuan District (桃源區) | 2,519 | 88.51 | 304 | 10.68 | 14 | 0.49 | 9 | 0.32 |
| Namasia District (那瑪夏區) | 1,751 | 85.08 | 295 | 14.33 | 10 | 0.49 | 2 | 0.10 |
| 2018 Kaohsiung City mayoral results[39] | |||||
|---|---|---|---|---|---|
| No. | Candidate | Party | Votes | Percentage | |
| 1 | Han Kuo-yu (韓國瑜) | 892,545 | 53.87% | ||
| 2 | Chen Chi-mai (陳其邁) | Democratic Progressive Party | 742,239 | 44.80% | |
| 3 | Chu Mei-feng (璩美鳳) | 7,998 | 0.48% | ||
| 4 | Su Ying-guei (蘇盈貴) | 14,125 | 0.85% | ||
| Total voters | 2,281,338 | ||||
| Valid votes | 1,656,907 | ||||
| Invalid votes | 20,743 | ||||
| Voter turnout | 72.63% | ||||
Taiwan Province
Keelung
Political context prior to the elections
| Results of Past Keelung City Mayoral Elections | ||||
| Year | Winning Candidate | Political Party | ||
| 1997 | Lee Chin-yung | Democratic Progressive Party | ||
| 2001 | Hsu Tsai-li | |||
| 2005 | Hsu Tsai-li | |||
| 2009 | Chang Tong-rong | |||
| 2014 | Lin Yu-chang | Democratic Progressive Party | ||

| Party | Year | Vote share % |
|---|---|---|
| Democratic Progressive Party | 2014 local election | 53% |
| 2008 legislative election | 68% |
| Party | Presidential % | Legislative seat | Legislative % |
|---|---|---|---|
| Democratic Progressive Party | 48.22% | 1 | 41.45% |
| 35.29% | 0 | 36.15% | |
| - | 0 | - | |
| Taiwan Solidarity Union | - | 0 | - |
| 16.50% | 0 | 12.37% | |
| - | 0 | 10.03% |
Results of the primary
| 2018 Democratic Progressive Party Keelung City mayoral primary results | ||||
|---|---|---|---|---|
| Candidates | Place | Result | ||
| Lin Yu-chang | Nominated | Walkover | ||
| 2018 Kuomintang Keelung City mayoral primary results | ||||
|---|---|---|---|---|
| Candidates | Place | Results | ||
| Hsieh Li-kung | Nominated after negotiation | 39.92% | ||
| Song Wei-li | 1st but withdrew after negotiation | 41.49% | ||
| Wen-Chieh Dale Jieh | 3rd | 18.59% | ||
Opinion polls
| Poll organization | Dates conducted | Lin Yu-chang | Lead | ||
|---|---|---|---|---|---|
| Sanli | January 16, 2018 | 58% | 15.2% | 26.8% | 42.8% |
| ETtoday | March 30, 2018 | 44.1% | 24.0% | 31.9% | 20.1% |
| Apollo | July 5, 2018 | 50% | 15.9% | 34.1% | 34.1% |
| Evidence Based | October 20, 2018 | 54.1% | 19.8% | 26.1% | 34.3% |
| Real Survey | October 29, 2018 | 42.4% | 29.7% | 20.6% | 12.7% |
Results

| District | Lin Yu-chang | |||
|---|---|---|---|---|
| Votes | % | Votes | % | |
| Zhongzheng District (中正區) | 12,009 | 47.21 | 13,431 | 52.79 |
| Qidu District (七堵區) | 11,745 | 42.50 | 15,891 | 57.50 |
| Nuannuan District (暖暖區) | 9,222 | 46.76 | 10,500 | 53.24 |
| Ren'ai District (仁愛區) | 9,877 | 55.87 | 12,507 | 55.87 |
| Zhongshan District (中山區) | 11,424 | 45.51 | 13,678 | 54.49 |
| Anle District (安樂區) | 18,580 | 45.04 | 22,676 | 54.96 |
| Xinyi District (信義區) | 13,672 | 50.35 | 13,484 | 49.65 |
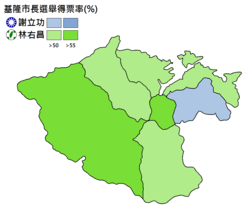
| 2018 Keelung City mayoral results[40] | |||||
|---|---|---|---|---|---|
| No. | Candidate | Party | Votes | Percentage | |
| 1 | Hsieh Li-kung (謝立功) | 86,529 | 45.86% | ||
| 2 | Lin Yu-chang (林右昌) | Democratic Progressive Party | 102,167 | 54.14% | |
| Total voters | 309,428 | ||||
| Valid votes | 188,696 | ||||
| Invalid votes | |||||
| Voter turnout | 60.98% | ||||
Yilan County
Political context prior to the elections
| Results of Past Yilan County Magistrate Elections | ||||
| Year | Winning Candidate | Political Party | ||
| 1997 | Liu Shou-ch'eng | Democratic Progressive Party | ||
| 2001 | Liu Shou-ch'eng | Democratic Progressive Party | ||
| 2005 | Lu Kuo-hua | |||
| 2009 | Lin Tsung-hsien | Democratic Progressive Party | ||
| 2014 | Lin Tsung-hsien | Democratic Progressive Party | ||

| Party | Year | Vote share % |
|---|---|---|
| Democratic Progressive Party | 2014 local election | 64% |
| 2008 legislative election | 53% |
| Party | Presidential % | Legislative seat | Legislative % |
|---|---|---|---|
| Democratic Progressive Party | 62.06% | 1 | 53.68% |
| 25.38% | 0 | 28.25% | |
| - | 0 | - | |
| Taiwan Solidarity Union | - | 0 | - |
| 12.55% | 0 | - | |
| - | 0 | 18.07% |
Results of the primary
| 2018 Democratic Progressive Party Yilan County magistrate primary results | ||||
|---|---|---|---|---|
| Candidates | Place | Result | ||
| Chen Ou-po | Nominated | Walkover | ||
| 2018 Kuomintang Yilan County magistrate primary results | |||||
|---|---|---|---|---|---|
| Candidates | Place | Result | |||
| Lin Zi-miao | Called In | Walkover | |||
Opinion polls
| Poll organization | Dates conducted | Chen Ou-po | Lead | |||
|---|---|---|---|---|---|---|
| Apollo | April 14, 2017 | 18.2% | 28.6% | 53.2% | 10.4% | |
| TVBS1 | July 21, 2017 | 23% | 57% | 20% | 34% | |
| Era Com | December 27, 2017 | 23.37% | 45.89% | 30.74% | 21.52% | |
| ETtoday2 | June 11, 2018 | 15.8% | 41.2% | 39.1% | 25.4% | |
| ETtoday3 | September 9, 2018 | 23.1% | 35.6% | 25.6% | 12.5% | |
| Liberty Times Net4 | September 21, 2018 | 23.38% | 37.61% | 34.03% | 14.23% | |
| CM Media5 | September 26, 2018 | 26.5% | 40.1% | 25.5% | 13.6% | |
| UDN6 | October 5, 2018 | 13% | 42% | 45% | 29% | |
| TVBS7 | October 7, 2018 | 19% | 47% | 28% | 28% | |
| China Times8 | October 27, 2018 | 14.3% | 44.6% | 36.2% | 30.3% | |
| TISR9 | November 11, 2018 | 24.3% | 42% | 25.9% | 17.7% | |
| Chen Ou-po Campaign Team10 | November 11, 2018 | 28.7% | 26.6% | 28.9% | 2.1% | |
Note:* Opinion polls includes independent candidates.
1: | ||||||
Results
| District | Chen Ou-po | |||||||||
|---|---|---|---|---|---|---|---|---|---|---|
| Votes | % | Votes | % | Votes | % | Votes | % | Votes | % | |
| Yilan City (宜蘭市) | 6,736 | 13.66 | 23,891 | 48.45 | 18,033 | 36.57 | 379 | 0.76 | 270 | 0.54 |
| Luodong Township (羅東鎮) | 3,872 | 11.05 | 18,457 | 52.71 | 18,033 | 35.39 | 163 | 0.46 | 128 | 0.36 |
| Su'ao Township (蘇澳鎮) | 2,266 | 9.87 | 11,341 | 49.43 | 8,995 | 39.20 | 185 | 0.80 | 154 | 0.67 |
| Toucheng Township (頭城鎮) | 1,415 | 8.25 | 9,405 | 54.90 | 5,973 | 34.86 | 167 | 0.97 | 171 | 0.99 |
| Jiaoxi Township (礁溪鄉) | 2,314 | 10.95 | 9,698 | 45.91 | 8,797 | 41.65 | 194 | 0.92 | 120 | 0.57 |
| Zhuangwei Township (壯圍鄉) | 1,581 | 10.34 | 6,978 | 45.66 | 6,509 | 42.59 | 125 | 0.82 | 90 | 0.59 |
| Yuanshan Township (員山鄉) | 1,974 | 10.77 | 7,844 | 42.78 | 8,154 | 44.47 | 264 | 1.44 | 101 | 0.55 |
| Dongshan Township (冬山鄉) | 3,138 | 10.94 | 13,141 | 45.83 | 12,023 | 41.93 | 206 | 0.72 | 168 | 0.59 |
| Wujie Township (五結鄉) | 1,415 | 11.84 | 10,354 | 47.07 | 8,782 | 39.93 | 142 | 0.65 | 112 | 0.51 |
| Sanxing Township (三星鄉) | 1,235 | 9.69 | 6,053 | 47.48 | 5,314 | 41.68 | 74 | 0.58 | 72 | 0.56 |
| Datong Township (大同鄉) | 149 | 3.81 | 3,360 | 86.02 | 374 | 9.58 | 9 | 0.23 | 14 | 0.36 |
| Nan'ao Township (南澳鄉) | 114 | 3.12 | 3,245 | 88.73 | 260 | 7.11 | 14 | 0.38 | 24 | 0.66 |
| 2018 Yilan County mayoral results[41] | |||||
|---|---|---|---|---|---|
| No. | Candidate | Party | Votes | Percentage | |
| 1 | Lin Hsin-hua (林信華) | 27,399 | 10.95% | ||
| 2 | Lin Zi-miao (林姿妙) | 123,767 | 49.48% | ||
| 3 | Chen Ou-po (陳歐珀) | Democratic Progressive Party | 95,609 | 38.23% | |
| 4 | Lin Jin-kun (林錦坤) | 1,922 | 0.77% | ||
| 5 | Chen Qiu-jing (陳秋境) | 1,424 | 0.57% | ||
| Total voters | 373,510 | ||||
| Valid votes | 250,121 | ||||
| Invalid votes | |||||
| Voter turnout | 66.97% | ||||
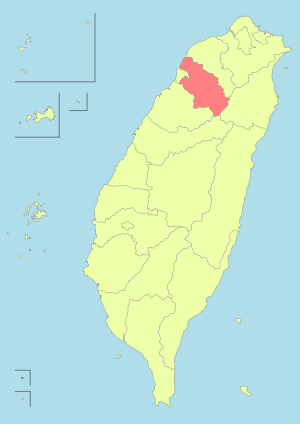
Hsinchu County
Political context prior to the elections
| Results of Past Hsinchu County Magistrate Elections | ||||
| Year | Winning Candidate | Political Party | ||
| 1997 | Lin Kuang-hua | Democratic Progressive Party | ||
| 2001 | Cheng Yung-chin | |||
| 2005 | Cheng Yung-chin | |||
| 2009 | Chiu Ching-chun | |||
| 2014 | Chiu Ching-chun | |||
| Party | Year | Vote share % |
|---|---|---|
| Democratic Progressive Party | 2010 legislative by-election | 56% |
| 2008 presidential election | 74% |
| Party | Presidential % | Legislative seat | Legislative % |
|---|---|---|---|
| Democratic Progressive Party | 42.52% | 0 | - |
| 35.28% | 1 | 36.75% | |
| - | 0 | - | |
| Taiwan Solidarity Union | - | 0 | - |
| 22.19% | 0 | - | |
| - | 0 | 63.25% |
Results of the primary
| 2018 Minkuotang Hsinchu County magistrate primary results | ||||
|---|---|---|---|---|
| Candidates | Place | Result | ||
| Hsu Hsin-ying | Nominated | Walkover | ||
| 2018 Kuomintang Hsinchu County magistrate primary results | ||||
|---|---|---|---|---|
| Candidates | Place | Results | ||
| Yang Wen-ke | Called In | Walkover | ||
| Lin Wei-chou | Failure to get party's nomination | - | ||
| 2018 Democratic Progressive Party Hsinchu County magistrate primary results | ||||
|---|---|---|---|---|
| Candidates | Place | Result | ||
| Cheng Chao-fang | Called In | Walkover | ||
Opinion polls
| Poll organization | Dates conducted | Cheng Chao-fang | Lead | ||||
|---|---|---|---|---|---|---|---|
| Era Com | January 4, 2018 | 32.18% | 23.59% | - | 24.85% | 8.59% | |
| China Times | January 26, 2018 | 17.1% | 12.1% | - | - | 5% | |
| Apollo | June 16, 2018 | 20.1% | 27% | 4.7% | 39.8% | 6.9% | |
| Apollo | June 21, 2018 | 18.3% | 21.3% | 4.5% | 38.4% | 3% | |
| Era Com | June 22, 2018 | 40.2% | 23.3% | 8.82% | 18.39% | 16.9% | |
| TVBS | June 29, 2018 | 31% | 27% | 9% | 32% | 4% | |
| ETtoday | July 11, 2018 | 19.7% | 26.3% | 9.7% | 44.2% | 6.6% | |
| ETtodayNote | July 27, 2018 | 27.5% | 23.6% | 6.5% | 17.1% | 3.9% | |
| ApolloNote | August 1, 2018 | 30.5% | 25.9% | 7.2% | 19.2% | 4.6% | |
| Daily ViewNote | August 19, 2018 | 34.8% | 24.47% | 21.74% | - | 10.33% | |
| Focus Survey Research | August 24, 2018 | 37.2% | 26.7% | 12.0% | 23.1% | 10.5% | |
| ApolloNote | August 25, 2018 | 20.4% | 16.9% | 6.2% | 31.1% | 3.5% | |
| TVBS | August 31, 2018 | 28% | 25% | 13% | 34% | 3% | |
| Era Com | September 10, 2018 | 32.56% | 23.25% | 9.11% | 35.08% | 9.29% | |
| Taiwan Competitiveness Forum1 | September 16, 2018 | 27.8% | 23.4% | 12.6% | 34.8% | 4.4% | |
| UDN2 | October 2, 2018 | 31% | 25% | 11% | 32% | 6% | |
| TISR3c | October 2, 2018 | 25.9% | 23.3% | 9.1% | 31.5% | 2.6% | |
| Apollo4 | October 22, 2018 | 24.8% | 27.5% | 10.2% | 28.7% | 2.7% | |
| Taiwan Competitiveness Forum5 | October 29, 2018 | 24.8% | 26% | 10.4% | 31.4% | 1.2% | |
| UDN6 | November 2, 2018 | 36% | 29% | 11% | 23% | 7% | |
| Taiwan Competitiveness Forum7 | November 7, 2018 | 25.4% | 31.7% | 11.7% | 26.3% | 6.3% | |
| China Times8 | November 9, 2018 | 26.3% | 28.7% | 10.5% | 25.7% | 2.4% | |
| Era Com | November 11, 2018 | 27.56% | 33.41% | 12.21% | 26.82% | 5.85% | |
| Trend Survey | November 11, 2018 | 28.8% | 33% | 14.8% | 23.4% | 4.2% | |
| Cheng Chao-fang Campaign Team | November 11, 2018 | 30% | 27% | 23% | 20% | 3% | |
Note:* Opinion polls includes independent candidates.
1: | |||||||
| Note: Poll conducted before Lin was withdraw race | |||||||
Results
| District | Cheng Chao-fang | |||||||
|---|---|---|---|---|---|---|---|---|
| Votes | % | Votes | % | Votes | % | Votes | % | |
| Zhubei City (竹北市) | 27,664 | 33.50 | 1,901 | 2.30 | 21,725 | 26.31 | 31,292 | 37.89 |
| Zhudong Township (竹東鎮) | 19,629 | 42.05 | 792 | 1.70 | 13,531 | 28.99 | 12,724 | 27.26 |
| Xinpu Township (新埔鎮) | 35.99 | 42.05 | 317 | 1.63 | 6,239 | 32.16 | 5,861 | 30.21 |
| Guanxi Township (關西鎮) | 6,017 | 35.70 | 217 | 1.29 | 4,905 | 29.10 | 5,715 | 33.91 |
| Hukou Township (湖口鎮) | 15,866 | 39.87 | 702 | 1.76 | 10,043 | 25.24 | 13,182 | 33.13 |
| Zhubei City (新豐鄉) | 9,826 | 33.97 | 475 | 1.64 | 7,930 | 27.42 | 10,694 | 36.97 |
| Qionglin Township (芎林鄉) | 4,876 | 40.07 | 216 | 1.78 | 3,702 | 30.42 | 3,374 | 27.73 |
| Hengshan Township (橫山鄉) | 3,624 | 44.23 | 152 | 1.86 | 2,278 | 27.80 | 2,140 | 26.12 |
| Beipu Township (北埔鄉) | 2,769 | 46.27 | 115 | 1.92 | 1,741 | 29.09 | 1,359 | 22.71 |
| Baoshan Township (寶山鄉) | 4,172 | 45.93 | 133 | 1.46 | 2,465 | 27.14 | 2,313 | 25.47 |
| Emei Township (峨眉鄉) | 4,876 | 53.52 | 57 | 1.38 | 1,123 | 27.10 | 746 | 18.00 |
| Jianshi Township (尖石鄉) | 2,836 | 51.39 | 68 | 1.23 | 1,525 | 27.63 | 1,090 | 19.75 |
| Wufeng Township (五峰鄉) | 1,398 | 45.33 | 23 | 0.75 | 963 | 31.23 | 700 | 22.70 |
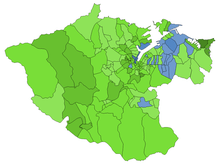
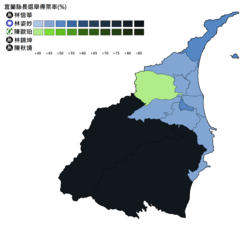
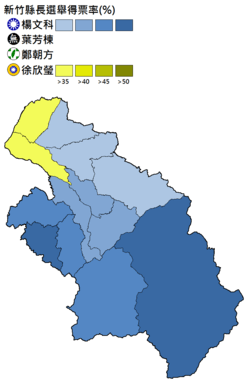
| 2018 Hsinchu County mayoral results[42] | |||||
|---|---|---|---|---|---|
| No. | Candidate | Party | Votes | Percentage | |
| 1 | Yang Wen-ke (楊文科) | 107,877 | 38.20% | ||
| 2 | Yeh Fang-tung (葉芳棟) | 5,168 | 1.83% | ||
| 3 | Cheng Chao-fang (鄭朝方) | Democratic Progressive Party | 78,170 | 27.68% | |
| 4 | Hsu Hsin-ying (徐欣瑩) | 91,190 | 32.29% | ||
| Total voters | 427,652 | ||||
| Valid votes | 282,405 | ||||
| Invalid votes | 8,195 | ||||
| Voter turnout | 66.03% | ||||
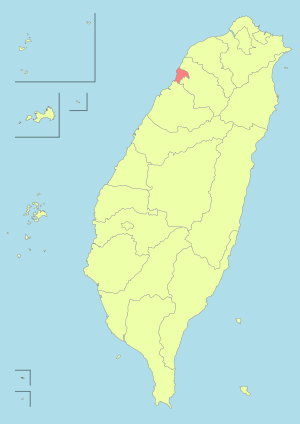
Hsinchu
Political context prior to the elections
| Results of Past Hsinchu City Mayoral Elections | ||||
| Year | Winning Candidate | Political Party | ||
| 1997 | James Tsai | Democratic Progressive Party | ||
| 2001 | Lin Junq-tzer | |||
| 2005 | Lin Junq-tzer | |||
| 2009 | Hsu Ming-tsai | |||
| 2014 | Lin Chih-chien | Democratic Progressive Party | ||
| Party | Year | Vote share % |
|---|---|---|
| Democratic Progressive Party | 1997 local election | 56% |
| 2005 local election | 69% |
| Party | Presidential % | Legislative seat | Legislative % |
|---|---|---|---|
| Democratic Progressive Party | 51.22% | 1 | 41.33% |
| 32.42% | 0 | 36.46% | |
| - | 0 | 16.56% | |
| Taiwan Solidarity Union | - | 0 | - |
| 16.35% | 0 | 1.91% | |
| - | 0 | 3.74% |
Results of the primary
| 2018 Democratic Progressive Party Hsinchu City mayoral primary results | ||||
|---|---|---|---|---|
| Candidates | Place | Result | ||
| Lin Chih-chien | Nominated | Walkover | ||
| 2018 Kuomintang Hsinchu City mayoral primary results | |||||
|---|---|---|---|---|---|
| Candidates | Place | UDN | Apollo Survey & Research | TVBS | Aggregated Result |
| Hsu Ming-tsai | Nominated | 40.55% | 42.89% | 42.63% | 42.02% |
| Lin Geng-ren | 2nd | 36.15% | 34.63% | 34.62% | 35.13% |
| Li Guo-zhang | 3rd | 23.30% | 22.48% | 22.75% | 22.84% |
Opinion polls
| Poll organization | Dates conducted | Lin Chih-chien | Lead | |||
|---|---|---|---|---|---|---|
| Trend | November 14, 2017 | 59.9% | 19.8% | - | 20.3% | 40.1% |
| Sanli | January 26, 2018 | 56.4% | 23.4% | - | 20.2% | 33% |
| ETtoday | March 27, 2018 | 51.4% | 12.0% | - | 36.6% | 39.4% |
| GVM | May 30, 2018 | 59.7% | 23.3% | - | 20% | 36.4% |
| Green Party | June 20, 2018 | 40.9% | 15.9% | - | 20% | 25% |
| Sanli | June 21, 2018 | 55.5% | 15.5% | - | 29% | 40% |
| China Times | July 7, 2018 | 48.4% | 15.3% | 9.5% | 26.8% | 33.1% |
| ETtoday | July 16, 2018 | 38.5% | 16.9% | 6.2% | 27.1% | 21.6% |
| Taiwan Green Party | August 24, 2018 | 48.5% | 13.6% | 7.9% | 30% | 34.9% |
| Democratic Progressive Party | September 3, 2018 | 45.6% | 13.2% | 9.9% | 31.3% | 32.4% |
| Focus Survey Research | October 21, 2018 | 40.6% | 17.1% | 14.5% | 27.8% | 23.5% |
| Focus Survey Research | November 6, 2018 | 40.6% | 17.6% | 13% | 28.8% | 23% |
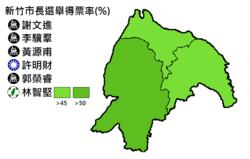
Results
| District | Lin Chih-chien | |||||||||||
|---|---|---|---|---|---|---|---|---|---|---|---|---|
| Votes | % | Votes | % | Votes | % | Votes | % | Votes | % | Votes | % | |
| East District (東區) | 19,364 | 19.45 | 323 | 0.32 | 2,165 | 2.17 | 29,097 | 29.23 | 261 | 0.26 | 48,346 | 48.56 |
| North District (北區) | 17,017 | 22.39 | 236 | 0.31 | 1,053 | 1.39 | 20,850 | 27.43 | 195 | 0.26 | 36,655 | 48.23 |
| Xiangshan District (香山區) | 7,720 | 18.58 | 146 | 0.35 | 385 | 0.93 | 10,561 | 25.42 | 118 | 0.28 | 22,611 | 54.43 |
| 2018 Hsinchu City mayoral results[43] | |||||
|---|---|---|---|---|---|
| No. | Candidate | Party | Votes | Percentage | |
| 1 | Hsieh Wen-chin (謝文進) | 44,101 | 20.31% | ||
| 2 | Li Chi-qun (李驥羣) | 705 | 0.32% | ||
| 3 | Huang Yuan-fu (黃源甫) | 3,603 | 1.66% | ||
| 4 | Hsu Ming-tsai (許明財) | 60,508 | 27.87% | ||
| 5 | Kuo Jung-jui (郭榮睿) | 574 | 0.26% | ||
| 6 | Lin Chih-chien (林智堅) | Democratic Progressive Party | 107,612 | 49.57% | |
| Total voters | 338,323 | ||||
| Valid votes | 217,103 | ||||
| Invalid votes | 4,299 | ||||
| Voter turnout | 64.17% | ||||
Miaoli County
Political context prior to the elections
| Results of Past Miaoli County Magistrate Elections | ||||
| Year | Winning Candidate | Political Party | ||
| 1997 | Fu Hsueh-peng | |||
| 2001 | Fu Hsueh-peng | |||
| 2005 | Liu Cheng-hung | |||
| 2009 | Liu Cheng-hung | |||
| 2014 | Hsu Yao-chang | |||

| Party | Presidential % | Legislative seats | Legislative % |
|---|---|---|---|
| Democratic Progressive Party | 45.45% | 0 | 40.44% |
| 37.55% | 2 | 46.26% | |
| - | 0 | - | |
| Taiwan Solidarity Union | - | 0 | - |
| 17.00% | 0 | - | |
| - | 0 | 13.30% |
Results of the primary
| 2018 Kuomintang Miaoli County magistrate primary results | ||||
|---|---|---|---|---|
| Candidates | Place | Result | ||
| Hsu Yao-chang | Nominated | Walkover | ||
| 2018 Democratic Progressive Party Miaoli County magistrate primary results | ||||
|---|---|---|---|---|
| Candidates | Place | Results | ||
| Hsu Ting-chen | Supported by DPP | |||
Opinion polls
| Poll organization | Dates conducted | Lead | |||||
|---|---|---|---|---|---|---|---|
| GSSC | January 26, 2018 | 46.5% | 21.1% | 32.4% | 25.4% | ||
| China Times | June 13, 2018 | 56.9% | 17.6% | 25.5% | 39.3% | ||
| ETtoday | July 2, 2018 | 35.9% | 16.5% | 29.7% | 19.4% | ||
| China Times1 | November 5, 2018 | 47.6% | 13.2% | 37.7% | 34.4% | ||
Note:* Opinion polls includes independent candidates.
1: | |||||||
Results

| District | ||||||||
|---|---|---|---|---|---|---|---|---|
| Votes | % | Votes | % | Votes | % | Votes | % | |
| Miaoli City (苗栗市) | 1,070 | 2.31 | 15,711 | 33.92 | 1,158 | 2.50 | 28,376 | 61.27 |
| Yuanli Township (苑裡鎮) | 732 | 2.81 | 10,002 | 38.35 | 1,023 | 3.92 | 14,322 | 54.92 |
| Tongxiao Township (通霄鎮) | 567 | 2.73 | 10,375 | 49.99 | 841 | 4.05 | 8,970 | 43.22 |
| Zhunan Township (竹南鎮) | 1,138 | 2.70 | 16,806 | 39.95 | 1,342 | 3.19 | 22,785 | 54.16 |
| Toufen City (頭份市) | 816 | 1.57 | 17,558 | 33.81 | 1,421 | 2.74 | 32,143 | 61.89 |
| Houlong Township (後龍鎮) | 489 | 2.29 | 10,631 | 49.69 | 717 | 3.35 | 9,556 | 44.67 |
| Zhuolan Township (卓蘭鎮) | 435 | 4.01 | 3,315 | 30.57 | 378 | 3.49 | 6,717 | 61.94 |
| Dahu Township (大湖鄉) | 305 | 3.50 | 2,791 | 32.07 | 225 | 2.59 | 5,382 | 61.84 |
| Gongguan Township (公館鄉) | 362 | 1.93 | 6,446 | 34.28 | 449 | 2.39 | 11,545 | 61.40 |
| Tongluo Township (銅鑼鄉) | 180 | 1.68 | 3,894 | 36.42 | 286 | 2.68 | 6,331 | 59.22 |
| Nanzhuang Township (南庄鄉) | 91 | 1.51 | 1,814 | 30.02 | 124 | 2.05 | 4,014 | 66.42 |
| Touwu Township (頭屋鄉) | 108 | 1.45 | 2,307 | 31.05 | 151 | 2.03 | 4,863 | 65.46 |
| Sanyi Township (三義鄉) | 178 | 1.80 | 3,540 | 35.78 | 330 | 3.34 | 5,845 | 59.08 |
| Xihu Township (西湖鄉) | 72 | 1.54 | 1,685 | 35.95 | 113 | 2.41 | 2,817 | 60.10 |
| Zaoqiao Township (造橋鄉) | 145 | 1.97 | 2,561 | 34.87 | 194 | 2.64 | 4,444 | 60.51 |
| Sanwan Township (三灣鄉) | 62 | 1.51 | 1,192 | 28.97 | 93 | 2.26 | 2,767 | 67.26 |
| Shitan Township (獅潭鄉) | 51 | 1.74 | 758 | 25.85 | 73 | 2.49 | 2,050 | 69.92 |
| Tai'an Township (泰安鄉) | 79 | 1.82 | 1,318 | 30.38 | 112 | 2.58 | 2,829 | 65.21 |
| 2018 Miaoli County mayoral results | |||||
|---|---|---|---|---|---|
| No. | Candidate | Party | Votes | Percentage | |
| 1 | Zhu Tai-ping (朱泰平) | 6,880 | 2.26% | ||
| 2 | Hsu Ting-zhen (徐定禎) | 112,704 | 37.03% | ||
| 3 | Huang Yu-yen (黃玉燕) | 9,030 | 2.97% | ||
| 4 | Hsu Yao-chang (徐耀昌) | 175,756 | 57.74% | ||
| Total voters | 446,507 | ||||
| Valid votes | 304,370 | ||||
| Invalid votes | |||||
| Voter turnout | 68.17% | ||||
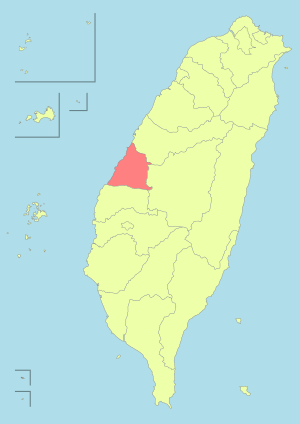
Changhua County
Political context prior to the elections
| Results of Past Changhua County Magistrate Elections | ||||
| Year | Winning Candidate | Political Party | ||
| 1997 | Juan Kang-meng | |||
| 2001 | Wong Chin-chu | Democratic Progressive Party | ||
| 2005 | Cho Po-yuan | |||
| 2009 | Cho Po-yuan | |||
| 2014 | Wei Ming-ku | Democratic Progressive Party | ||
| Party | Year | Vote share % |
|---|---|---|
| Democratic Progressive Party | 2016 presidential election | 56% |
| 2008 presidential election | 58% |
| Party | Presidential % | Legislative seats | Legislative % |
|---|---|---|---|
| Democratic Progressive Party | 56.47% | 3 | 47.69% |
| 28.80% | 1 | 44.96% | |
| - | 0 | 0.49% | |
| Taiwan Solidarity Union | - | 0 | - |
| 14.73% | 0 | 2.91% | |
| - | 0 | 3.95% |
Results of the primary
| 2018 Democratic Progressive Party Changhua County magistrate primary results | ||||
|---|---|---|---|---|
| Candidates | Place | Result | ||
| Wei Ming-ku | Called In | Walkover | ||
| 2018 Kuomintang Changhua County magistrate primary results | |||||
|---|---|---|---|---|---|
| Candidates | Place | TVBS | Apollo Survey & Research | UDN | Aggregated Result |
| Wang Huei-mei | Nominated | 56.66% | 59.78% | 55.59% | 57.34% |
| Wu Mingzhe | 2nd | 22.49% | 20.99% | 26.35% | 23.28% |
| Yang Fu-di | 3rd | 20.85% | 19.23% | 18.06% | 19.38% |
Opinion polls
| Poll organization | Dates conducted | Wei Ming-ku | Lead | |||
|---|---|---|---|---|---|---|
| China Times | April 10, 2017 | 39.9% | 25.7% | 34.4% | 14.2% | |
| Era Com | January 9, 2018 | 26.3% | 35.9% | 33.06% | 9.6% | |
| China Times | February 13, 2018 | 33.6% | 28% | 38.4% | 5.6% | |
| ETtoday | March 13, 2018 | 31.9% | 28.3% | 39.8% | 3.6% | |
| GSSC | May 24, 2018 | 25.1% | 35.0% | 39.9% | 9.9% | |
| ETtoday | September 2. 2018 | 29.6% | 29% | 26.3% | 0.6% | |
| Chienkuo Technology1 | September 15. 2018 | 13.2% | 19.9% | 33.6% | 6.7% | |
| Liberty Times Net2 | September 14, 2018 | 31.3% | 30.5% | 35.4% | 0.8% | |
| UDN3 | September 28, 2018 | 24% | 34% | 38% | 10% | |
| Taiwan Next Gen Foundation4 | October 3, 2018 | 32.3% | 31.7% | 30% | 0.4% | |
| China Times5 | October 14, 2018 | 28.8% | 37.7% | 26.4% | 8.9% | |
| CM Media6 | October 16, 2018 | 34.5% | 33.3% | 26.2% | 1.2% | |
| Taiwan Competitiveness Forum7 | October 25, 2018 | 23.9% | 33.4% | 35.5% | 9.5% | |
| ETtoday8 | October 28, 2018 | 23.2% | 38.1% | 27.7% | 14.9% | |
| UDN9 | November 6, 2018 | 24% | 41% | 31% | 17% | |
| Cross Straits Research Foundation10 | November 6, 2018 | 34.2% | 30.9% | 28.8% | 3.3% | |
| Sanli11 | November 6, 2018 | 35.4% | 33.4% | 25.3% | 2% | |
Note:* Opinion polls includes independent candidates.
1: | ||||||
Results
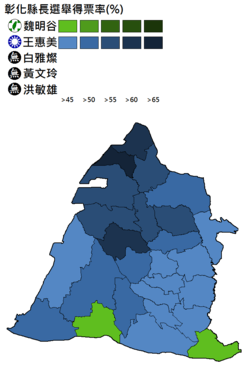
| District | Wei Ming-ku | |||||||||
|---|---|---|---|---|---|---|---|---|---|---|
| Votes | % | Votes | % | Votes | % | Votes | % | Votes | % | |
| Changhua City (彰化市) | 47,148 | 38.02 | 65,874 | 53.12 | 1,375 | 1.11 | 8,206 | 6.62 | 1,407 | 1.13 |
| Lugang Township (鹿港鎮) | 18,379 | 38.77 | 27,397 | 57.80 | 266 | 0.56 | 1,147 | 2.42 | 212 | 0.45 |
| Hemei Township (和美鎮) | 17,596 | 35.81 | 29,004 | 59.03 | 421 | 0.85 | 1,745 | 3.55 | 363 | 0.73 |
| Xianxi Township (線西鄉) | 2,818 | 28.46 | 6,615 | 66.82 | 90 | 0.91 | 314 | 3.17 | 63 | 0.64 |
| Shengang Township (伸港鄉) | 6,883 | 33.55 | 12,781 | 62.30 | 135 | 0.66 | 615 | 3.00 | 101 | 0.49 |
| Fuxing Township (福興鄉) | 9,992 | 38.08 | 15,125 | 57.65 | 220 | 0.84 | 752 | 2.87 | 148 | 0.56 |
| Xiushui Township (秀水鄉) | 7,953 | 35.67 | 13,132 | 58.90 | 173 | 0.78 | 836 | 3.75 | 203 | 0.91 |
| Huatan Township (花壇鄉) | 9,629 | 36.90 | 14,443 | 55.34 | 387 | 1.48 | 1,366 | 5.23 | 273 | 1.05 |
| Fenyuan Township (芬園鄉) | 6,415 | 46.08 | 6,594 | 47.37 | 119 | 0.85 | 669 | 4.81 | 124 | 0.89 |
| Yuanlin City (員林市) | 26,724 | 41.78 | 31,949 | 49.95 | 715 | 1.12 | 3,716 | 5.81 | 852 | 1.33 |
| Xihu Township (溪湖鎮) | 11,899 | 38.86 | 16,431 | 53.67 | 284 | 0.93 | 1,479 | 4.83 | 524 | 1.71 |
| Tianzhong Township (田中鎮) | 10,161 | 43.96 | 11,340 | 49.06 | 250 | 1.08 | 1,136 | 4.91 | 228 | 0.99 |
| Dacun Township (大村鄉) | 8,835 | 41.40 | 10,826 | 50.73 | 235 | 1.10 | 1,218 | 5.71 | 227 | 1.06 |
| Puyan Township (埔鹽鄉) | 6,620 | 32.43 | 12,415 | 60.82 | 200 | 0.98 | 943 | 4.62 | 236 | 1.16 |
| Puxin Township (埔心鄉) | 9,295 | 45.43 | 9,694 | 47.38 | 195 | 0.95 | 1,044 | 5.10 | 232 | 1.13 |
| Yongjing Township (永靖鄉) | 9,751 | 45.35 | 10,057 | 46.77 | 253 | 1.18 | 1,188 | 5.53 | 252 | 1.17 |
| Shetou Township (社頭鄉) | 10,864 | 44.60 | 11,703 | 48.04 | 502 | 2.06 | 1,094 | 4.49 | 196 | 0.80 |
| Ershui Township (二水鄉) | 4,775 | 49.11 | 4,452 | 45.79 | 78 | 0.80 | 357 | 3.67 | 61 | 0.63 |
| Beidou Township (北斗鎮) | 7,863 | 42.83 | 9,082 | 49.47 | 199 | 1.08 | 1,013 | 5.52 | 202 | 1.10 |
| Erlin Township (二林鎮) | 10,868 | 37.78 | 15,652 | 54.42 | 349 | 1.21 | 1,496 | 5.20 | 399 | 1.39 |
| Tianwei Township (田尾鄉) | 6,720 | 42.16 | 7,946 | 49.86 | 214 | 1.34 | 892 | 5.60 | 166 | 1.04 |
| Pitou Township (埤頭鄉) | 7,095 | 42.06 | 8,548 | 50.67 | 191 | 1.13 | 852 | 5.05 | 183 | 1.08 |
| Fangyuan Township (芳苑鄉) | 8,818 | 44.80 | 9,404 | 47.78 | 213 | 1.08 | 1,005 | 5.11 | 241 | 1.22 |
| Dacheng Township (大城鄉) | 4,013 | 43.29 | 4,708 | 50.78 | 92 | 0.99 | 347 | 3.74 | 111 | 1.20 |
| Zhutang Township (竹塘鄉) | 4,424 | 47.20 | 4,333 | 46.23 | 89 | 0.95 | 423 | 4.51 | 104 | 1.11 |
| Xizhou Township (溪州鄉) | 7,731 | 45.03 | 8,290 | 48.28 | 157 | 0.91 | 837 | 4.87 | 155 | 0.90 |
| 2018 Changhua County mayoral results[44] | |||||
|---|---|---|---|---|---|
| No. | Candidate | Party | Votes | Percentage | |
| 1 | Wei Ming-ku (魏明谷) | Democratic Progressive Party | 283,269 | 39.87% | |
| 2 | Wang Huei-mei (王惠美) | 377,795 | 53.18% | ||
| 3 | Pai Ya-tsan | 7,402 | 1.04% | ||
| 4 | Huang Wen-ling (黃文玲) | 34,690 | 4.88% | ||
| 5 | Hung Min-xiong (洪敏雄) | 7,263 | 1.02% | ||
| Total voters | 1,031,222 | ||||
| Valid votes | 710,419 | ||||
| Invalid votes | |||||
| Voter turnout | 68.89% | ||||
Nantou County
Political context prior to the elections
| Results of Past Nantou County Magistrate Elections | ||||
| Year | Winning Candidate | Political Party | ||
| 1997 | Peng Pai-hsien | |||
| 2001 | Lin Tsung-nan | Democratic Progressive Party | ||
| 2005 | Lee Chao-ching | |||
| 2009 | Lee Chao-ching | |||
| 2014 | Lin Ming-chen | |||
| Party | Year | Vote share % |
|---|---|---|
| Democratic Progressive Party | 2016 presidential election | 52% |
| 2008 legislative election | 62% |
| Party | Presidential % | Legislative seats | Legislative % |
|---|---|---|---|
| Democratic Progressive Party | 52.23% | 0 | 44.24% |
| 32.08% | 2 | 55.76% | |
| - | 0 | - | |
| Taiwan Solidarity Union | - | 0 | - |
| 15.68% | 0 | - | |
| - | 0 | - |
Results of the primary
| 2018 Kuomintang Nantou County magistrate primary results | |||||
|---|---|---|---|---|---|
| Candidates | Place | Result | |||
| Lin Ming-chen | Nominated | Walkover | |||
| 2018 Democratic Progressive Party Nantou County magistrate primary results | ||||
|---|---|---|---|---|
| Candidates | Place | Result | ||
| Hung Kuo-haw | Called In | Walkover | ||
Opinion polls
| Poll organization | Dates conducted | Hung Kuo-haw | Lead | ||
|---|---|---|---|---|---|
| ETtoday | March 13, 2018 | 59.4% | 11.7% | 28.9% | 47.7% |
| China Times | March 23, 2018 | 37.9% | 8.9% | 53.2% | 29% |
| China Times | October 29, 2018 | 48.4% | 13% | 37.6% | 35.4% |
Results
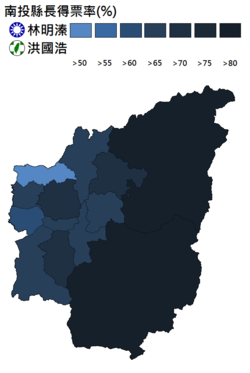
| District | Hung Kuo-haw | |||
|---|---|---|---|---|
| Votes | % | Votes | % | |
| Nantou City (南投市) | 39,008 | 68.02 | 18,342 | 31.98 |
| Puli Township (埔里鎮) | 31,617 | 70.04 | 13,527 | 29.96 |
| Caotun Township (草屯鎮) | 29,774 | 53.79 | 25,582 | 46.21 |
| Zhushan Township (竹山鎮) | 21,162 | 68.00 | 9,960 | 32.00 |
| Jiji Township (集集鎮) | 4,774 | 68.63 | 2,182 | 31.37 |
| Mingjian Township (名間鄉) | 15,432 | 64.75 | 8,400 | 35.25 |
| Lugu Township (鹿谷鄉) | 8,156 | 72.48 | 3,096 | 27.52 |
| Zhongliao Township (中寮鄉) | 6,940 | 70.31 | 2,931 | 29.69 |
| Yuchi Township (魚池鄉) | 6,810 | 68.99 | 3,061 | 31.01 |
| Guoxing Township (魚池鄉) | 8,152 | 68.21 | 3,799 | 31.79 |
| Shuili Township (水里鄉) | 7,621 | 69.89 | 3,284 | 30.11 |
| Xinyi Township (信義鄉) | 7,902 | 80.96 | 1,858 | 19.04 |
| Ren'ai Township (仁愛鄉) | 8,037 | 84.82 | 1,438 | 15.18 |
| 2018 Nantou County mayoral results | |||||
|---|---|---|---|---|---|
| No. | Candidate | Party | Votes | Percentage | |
| 1 | Lin Ming-chen (林明溱) | 195,385 | 66.72% | ||
| 2 | Hung Kuo-hao (洪國浩) | Democratic Progressive Party | 97,460 | 33.28% | |
| Total voters | 413,222 | ||||
| Valid votes | 292,845 | ||||
| Invalid votes | |||||
| Voter turnout | 70.87% | ||||
Yunlin County
Political context prior to the elections
| Results of Past Yunlin County Magistrate Elections | ||||
| Year | Winning Candidate | Political Party | ||
| 1997 | Chang Jung-wei | |||
| 2001 | Chang Jung-wei | |||
| 2005 | Su Chih-fen | Democratic Progressive Party | ||
| 2009 | Su Chih-fen | Democratic Progressive Party | ||
| 2014 | Lee Chin-yung | Democratic Progressive Party | ||

| Party | Year | Vote share % |
|---|---|---|
| Democratic Progressive Party | 2009 local elections | 65% |
| 2001 local elections | 62% |
| Party | Presidential % | Legislative seats | Legislative % |
|---|---|---|---|
| Democratic Progressive Party | 63.41% | 2 | 61.27% |
| 24.93% | 0 | 34.12% | |
| - | 0 | 2.13% | |
| Taiwan Solidarity Union | - | 0 | - |
| 11.66% | 0 | - | |
| - | 0 | 2.48% |
Results of the primary
| 2018 Democratic Progressive Party Yunlin County magistrate primary results | ||||
|---|---|---|---|---|
| Candidates | Place | Result | ||
| Lee Chin-yung | Nominated | Walkover | ||
| 2018 Kuomintang Yunlin County magistrate primary results | |||||
|---|---|---|---|---|---|
| Candidates | Place | Result | |||
| Chang Li-shan | Called In | Walkover | |||
Opinion polls
| Poll organization | Dates conducted | Lee Chin-yung | Lead | |||
|---|---|---|---|---|---|---|
| ETtoday | May 21, 2018 | 32.8% | 19.6% | 47.6% | 13.2% | |
| Taiwan Competitiveness Forum1 | October 17, 2018 | 32.6% | 25.3% | 35.8% | 7.3% | |
| Taiwan Competitiveness Forum2 | November 2, 2018 | 30.3% | 28% | 35.9% | 2.3% | |
Note:* Opinion polls includes independent candidates.
1: | ||||||
Results
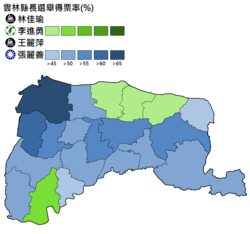
| District | Lee Chin-yung | |||||||
|---|---|---|---|---|---|---|---|---|
| Votes | % | Votes | % | Votes | % | Votes | % | |
| Douliu City (斗六市) | 1,055 | 1.81 | 22,922 | 39.39 | 2,161 | 3.71 | 32,050 | 55.08 |
| Dounan Township (斗南鎮) | 475 | 1.84 | 11,005 | 42.61 | 901 | 3.49 | 13,445 | 52.06 |
| Huwei Township (虎尾鎮) | 743 | 1.95 | 14,381 | 37.68 | 1,697 | 4.45 | 21,349 | 55.93 |
| Xiluo Township (西螺鎮) | 392 | 1.52 | 12,644 | 48.96 | 679 | 2.63 | 12,109 | 46.89 |
| Tuku Township (土庫鎮) | 275 | 1.58 | 6,368 | 36.69 | 578 | 3.33 | 10,136 | 58.40 |
| Beigang Township (北港鎮) | 334 | 1.44 | 10,941 | 47.13 | 514 | 2.21 | 11,426 | 49.22 |
| Gukeng Township (古坑鄉) | 283 | 1.52 | 7,693 | 41.45 | 496 | 2.67 | 10,087 | 54.35 |
| Dapi Township (大埤鄉) | 190 | 1.62 | 4,860 | 41.37 | 359 | 3.06 | 6,339 | 53.96 |
| Cihtong Township (莿桐鎮) | 323 | 1.84 | 8,445 | 48.24 | 521 | 2.98 | 8,218 | 46.94 |
| Linnei Township (林內鄉) | 125 | 1.19 | 4,928 | 46.72 | 260 | 2.47 | 5,234 | 49.63 |
| Erlun Township (二崙鄉) | 240 | 1.52 | 7,708 | 48.78 | 392 | 2.48 | 7,461 | 47.22 |
| Lunbei Township (崙背鄉) | 209 | 1.44 | 5,987 | 41.25 | 357 | 2.46 | 7,961 | 54.85 |
| Mailiao Township (麥寮鄉) | 340 | 1.49 | 6,429 | 28.12 | 542 | 2.37 | 15,550 | 68.02 |
| Dongshi Township (東勢鄉) | 117 | 1.18 | 3,902 | 39.49 | 174 | 1.76 | 5,687 | 57.56 |
| Baozhong Township (褒忠鄉) | 100 | 1.15 | 3,638 | 41.81 | 217 | 2.49 | 4,746 | 54.55 |
| Taixi Township (臺西鄉) | 175 | 1.26 | 4,600 | 33.11 | 283 | 2.04 | 8,833 | 63.59 |
| Yuanchang Township (元長鄉) | 267 | 1.75 | 6,483 | 42.41 | 418 | 2.73 | 8,118 | 53.11 |
| Sihu Township (四湖鄉) | 118 | 0.95 | 5,728 | 46.04 | 212 | 1.70 | 6,384 | 51.31 |
| Kouhu Township (口湖鄉) | 195 | 1.20 | 7,059 | 43.50 | 236 | 1.45 | 8,739 | 53.85 |
| Shuilin Township (水林鄉) | 207 | 1.38 | 7,604 | 50.78 | 264 | 1.76 | 6,898 | 46.07 |
| 2018 Yunlin County mayoral results | |||||
|---|---|---|---|---|---|
| No. | Candidate | Party | Votes | Percentage | |
| 1 | Lin Chia-yu (林佳瑜) | 6,163 | 1.57% | ||
| 2 | Lee Chin-yung (李進勇) | Democratic Progressive Party | 163,325 | 41.72% | |
| 3 | Wang Li-ping (王麗萍) | 11,261 | 2.88% | ||
| 4 | Chang Li-shan (張麗善) | 210,770 | 53.82% | ||
| Total voters | 565,078 | ||||
| Valid votes | 391,519 | ||||
| Invalid votes | |||||
| Voter turnout | 69.29% | ||||
Chiayi County
Political context prior to the elections
| Results of Past Chiayi County Magistrate Elections | ||||
| Year | Winning Candidate | Political Party | ||
| 1997 | Lee Ya-jing | |||
| 2001 | Chen Ming-wen | Democratic Progressive Party | ||
| 2005 | Chen Ming-wen | Democratic Progressive Party | ||
| 2009 | Helen Chang | Democratic Progressive Party | ||
| 2014 | Helen Chang | Democratic Progressive Party | ||
| Party | Year | Vote share % |
|---|---|---|
| Democratic Progressive Party | 2016 presidential election | 65% |
| 2008 legislative election | 50% |
| Party | Presidential % | Legislative seats | Legislative % |
|---|---|---|---|
| Democratic Progressive Party | 65.37% | 2 | 59.05% |
| 23.38% | 0 | 38.68% | |
| - | 0 | - | |
| Taiwan Solidarity Union | - | 0 | - |
| 11.25% | 0 | - | |
| - | 0 | 2.27% |
Results of the primary
| 2018 Democratic Progressive Party Chiayi County magistrate primary results | |||||
|---|---|---|---|---|---|
| Candidates | Place | Focus Survey Research | Shih Shin | Real Survey | Aggregated Result |
| Weng Chang-liang | Nominated | 43.08% | 42.88% | 45.34% | 43.77% |
| Chang Ming-ta | 2nd | 35.57% | 36.73% | 33.79% | 35.36% |
| None of the candidates | 21.35% | 20.39% | 20.87% | 20.87% | |
| 2018 Kuomintang Chiayi County magistrate primary results | |||||
|---|---|---|---|---|---|
| Candidates | Place | Result | |||
| Wu Yu-jen | Called In | Walkover | |||
Opinion polls
| Poll organization | Date of completion | Weng Chang-liang | Lead | |||
|---|---|---|---|---|---|---|
| ETtoday | June 4, 2018 | 34.3% | 15.3% | 50.4% | 19% | |
| ETtoday | September 24, 2018 | 29.3% | 22.8% | 32.4% | 6.5% | |
Note:* Opinion polls includes independent candidates.
1: | ||||||
Results
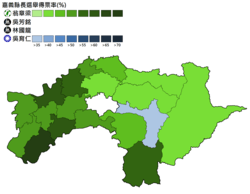
| District | Weng Chang-liang | |||||||
|---|---|---|---|---|---|---|---|---|
| Votes | % | Votes | % | Votes | % | Votes | % | |
| Taibao City (太保市) | 10,506 | 51.80 | 3,395 | 16.73 | 288 | 1.42 | 6,092 | 30.03 |
| Puzi City (朴子市) | 11,907 | 53.76 | 3,655 | 16.50 | 405 | 1.82 | 6,178 | 27.89 |
| Budai Township (布袋鎮) | 8,244 | 54.46 | 1,569 | 10.36 | 269 | 1.77 | 5,053 | 33.38 |
| Dalin Township (大林鎮) | 7,976 | 45.34 | 3,945 | 22.42 | 242 | 1.37 | 5,426 | 30.84 |
| Minxiong Township (民雄鄉) | 17,016 | 44.72 | 8,246 | 21.67 | 645 | 1.69 | 12,139 | 31.90 |
| Xikou Township (溪口鄉) | 4,932 | 54.42 | 1,820 | 20.08 | 211 | 2.32 | 2,099 | 23.16 |
| Xingang Township (新港鄉) | 10,986 | 58.72 | 3,095 | 16.54 | 329 | 1.75 | 4,298 | 22.97 |
| Lioujiao Township (六腳鄉) | 7,675 | 60.65 | 1,740 | 13.75 | 250 | 1.97 | 2,989 | 23.62 |
| Dongshi Township (東石鄉) | 7,275 | 54.97 | 2,532 | 19.13 | 234 | 1.76 | 3,193 | 24.12 |
| Yizhu Township (義竹鄉) | 8,500 | 70.92 | 938 | 7.82 | 132 | 1.10 | 2,414 | 20.14 |
| Lucao Township (鹿草鄉) | 5,411 | 60.44 | 844 | 9.42 | 152 | 1.69 | 2,545 | 28.42 |
| Shuishang Township (水上鄉) | 13,968 | 50.44 | 3,529 | 12.74 | 458 | 1.65 | 9,734 | 35.15 |
| Zhongpu Township (中埔鄉) | 11,500 | 48.73 | 4,038 | 17.11 | 308 | 1.30 | 7,751 | 32.84 |
| Zhuqi Township (竹崎鄉) | 8,791 | 42.07 | 5,467 | 26.16 | 334 | 1.59 | 6,300 | 30.15 |
| Meishan Township (梅山鄉) | 5,175 | 43.22 | 3,197 | 26.70 | 164 | 1.36 | 3,437 | 28.70 |
| Fanlu Township (番路鄉) | 2,253 | 32.65 | 2,036 | 29.51 | 100 | 1.44 | 2,510 | 36.38 |
| Dapu Township (大埔鄉) | 1,724 | 56.06 | 397 | 12.91 | 35 | 1.13 | 919 | 29.88 |
| Alishan Township (阿里山鄉) | 1,449 | 44.83 | 577 | 17.85 | 40 | 1.23 | 1,166 | 36.07 |
| 2018 Chiayi County mayoral results | |||||
|---|---|---|---|---|---|
| No. | Candidate | Party | Votes | Percentage | |
| 1 | Weng Chang-liang (翁章梁) | Democratic Progressive Party | 145,288 | 50.95% | |
| 2 | Wu Fang-ming (吳芳銘) | 51,020 | 17.89% | ||
| 3 | Lin Kuo-lung (林國龍) | 4,596 | 1.61% | ||
| 4 | Wu Yu-jen (吳育仁) | 84,243 | 29.54% | ||
| Total voters | 428,649 | ||||
| Valid votes | 285,147 | ||||
| Invalid votes | |||||
| Voter turnout | 66.52% | ||||
Chiayi City
Political context prior to the elections
| Results of Past Chiayi City Magistrate Elections | ||||
| Year | Winning Candidate | Political Party | ||
| 1997 | Chang Po-ya | |||
| 2001 | Chen Li-chen | |||
| 2005 | Huang Min-hui | |||
| 2009 | Huang Min-hui | |||
| 2014 | Twu Shiing-jer | Democratic Progressive Party | ||

| Party | Year | Vote share % |
|---|---|---|
| Democratic Progressive Party | 2016 presidential election | 60% |
| 2005 local election | 55% |
| Party | Presidential % | Legislative seat | Legislative % |
|---|---|---|---|
| Democratic Progressive Party | 59.86% | 1 | 53.95% |
| 27.95% | 0 | 35.66% | |
| - | 0 | - | |
| Taiwan Solidarity Union | - | 0 | - |
| 12.19% | 0 | - | |
| - | 0 | 10.39% |
Results of the primary
| 2018 Democratic Progressive Party Chiayi City mayoral primary results | ||||
|---|---|---|---|---|
| Candidates | Place | Result | ||
| Twu Shiing-jer | Nominated | Walkover | ||
| 2018 Kuomintang Chiayi City mayoral primary results | ||||
|---|---|---|---|---|
| Candidates | Place | Results | ||
| Huang Min-hui | Nominated | Results not released | ||
| Jack Lee | 2nd | Results not released | ||
Opinion polls
| Poll organization | Dates conducted | Twu Shiing-jer | Lead | |||
|---|---|---|---|---|---|---|
| Yam News | September 27, 2017 | 50.91% | 49.09% | - | 0% | 1.82% |
| Era Com | January 15, 2018 | 22.08% | 53.23% | - | 24.69% | 31.15% |
| GSSC | April 27, 2018 | 21.9% | 34.4% | 15.1% | 28.6% | 12.5% |
| ETtoday | June 4, 2018 | 18.2% | 31.2% | 18.0% | 32.6% | 13% |
| CM Media | September 5, 2018 | 39.5% | 24.8% | 18.9% | 17% | 15.3% |
| ETtoday1 | September 16, 2018 | 26.0% | 35.4% | 10.7% | 18.6% | 9.4% |
| Liberty News Net2 | September 29, 2018 | 30.14% | 24.56% | 17.91% | 27.1% | 5.58% |
| UDN3 | October 2, 2018 | 25% | 28% | 17% | 29% | 3% |
| TVBS4 | October 15, 2018 | 29% | 35% | 15% | 20% | 6% |
| Taiwan Competitiveness Forum5 | October 25, 2018 | 25.6% | 28% | 15.3% | 26.0% | 2.4% |
| Taiwan Competitiveness Forum6 | November 4, 2018 | 26.5% | 28.8% | 13.2% | 25.9% | 2.3% |
| UDN7 | November 7, 2018 | 28% | 31% | 15% | 24% | 3% |
Note:* Opinion polls includes independent candidates.
1: | ||||||
Predictions
| Poll organization | Date of completion | Turnout | Twu Shiing-jer | |||
|---|---|---|---|---|---|---|
| TVBS | October 15, 2018 | 70% | 41% | 40% | 15% | 1% |
Results
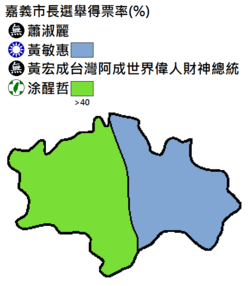
| District | Twu Shiing-jer | |||||||
|---|---|---|---|---|---|---|---|---|
| Votes | % | Votes | % | Votes | % | Votes | % | |
| East District (東區) | 10,703 | 16.95 | 27,558 | 43.64 | 806 | 1.28 | 24,081 | 38.13 |
| West District (西區) | 14,869 | 0.40 | 31,000 | 39.21 | 1,016 | 1.29 | 32,175 | 40.70 |
| 2018 Chiayi City mayoral results | |||||
|---|---|---|---|---|---|
| No. | Candidate | Party | Votes | Percentage | |
| 1 | Hsiao Shui-li (蕭淑麗) | 25,572 | 17.98% | ||
| 2 | Huang Min-hui (黃敏惠) | 58,558 | 41.18% | ||
| 3 | Huang Hung Chen Taiwan Ah Chen World Great Person Rich President (黃宏成台灣阿成
世界偉人財神總統) |
1,822 | 1.28% | ||
| 4 | Twu Shiing-jer (涂醒哲) | Democratic Progressive Party | 56,256 | 39.56% | |
| Total voters | 212,843 | ||||
| Valid votes | 142,208 | ||||
| Invalid votes | |||||
| Voter turnout | 66.81% | ||||
Pingtung County
Political context prior to the elections
| Results of Past Pingtung County Magistrate Elections | ||||
| Year | Winning Candidate | Political Party | ||
| 1997 | Su Jia-chyuan | Democratic Progressive Party | ||
| 2001 | Su Jia-chyuan | Democratic Progressive Party | ||
| 2005 | Tsao Chi-hung | Democratic Progressive Party | ||
| 2009 | Tsao Chi-hung | Democratic Progressive Party | ||
| 2014 | Pan Men-an | Democratic Progressive Party | ||
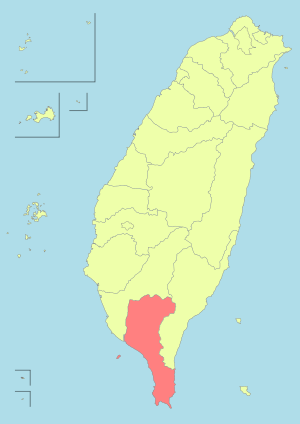
| Party | Year | Vote share % |
|---|---|---|
| Democratic Progressive Party | 2016 presidential election | 63% |
| 2008 presidential election | 49% |
| Party | Presidential % | Legislative seats | Legislative % |
|---|---|---|---|
| Democratic Progressive Party | 63.49% | 3 | 58.94% |
| 26.99% | 0 | 30.89% | |
| - | 0 | - | |
| Taiwan Solidarity Union | - | 0 | - |
| 9.52% | 0 | - | |
| - | 0 | 10.17% |
Results of the primary
| 2018 Democratic Progressive Party Pingtung County magistrate primary results | ||||
|---|---|---|---|---|
| Candidates | Place | Result | ||
| Pan Men-an | Nominated | Walkover | ||
| 2018 Kuomintang Pingtung County magistrate primary results | |||||
|---|---|---|---|---|---|
| Candidates | Place | Result | |||
| Su Ching-chuan | Called In | Walkover | |||
Opinion polls
| Poll organization | Date of completion | Pan Men-an | Lead | |||
|---|---|---|---|---|---|---|
| ETtoday | June 19, 2018 | 37.9% | 20.9% | 29.9% | 17% | |
| ETtoday1 | September 30, 2017 | 36.4% | 24.8% | 22.5% | 11.6% | |
| TISR2 | October 22, 2018 | 43.4% | 17.1% | 33.1% | 26.3% | |
| TISR2 | November 10, 2018 | 41.6% | 19.3% | 33.4% | 22.3% | |
Note:* Opinion polls includes independent candidates.
1: | ||||||
Results
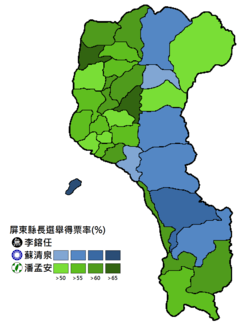
| District | Pan Men-an | |||||
|---|---|---|---|---|---|---|
| Votes | % | Votes | % | Votes | % | |
| Pingtung City (屏東市) | 2,182 | 2.14 | 46,320 | 45.47 | 53,370 | 52.39 |
| Chaozhou Township (潮州鎮) | 623 | 2.16 | 12,571 | 43.62 | 15,628 | 54.22 |
| Donggang Township (東港鎮) | 575 | 2.38 | 11,387 | 47.04 | 12,243 | 50.58 |
| Hengchun Township (恆春鎮) | 232 | 1.40 | 6,729 | 40.55 | 9,632 | 58.05 |
| Wandan Township (萬丹鄉) | 825 | 2.84 | 11,272 | 38.87 | 16,905 | 58.29 |
| Changzhi Township (長治鄉) | 381 | 2.20 | 6,939 | 40.05 | 10,006 | 57.75 |
| Linluo Township (麟洛鄉) | 160 | 2.25 | 2,526 | 35.45 | 4,440 | 62.31 |
| Jiuru Township (九如鄉) | 294 | 2.22 | 3,977 | 30.03 | 8,972 | 67.75 |
| Ligang Township (里港鄉) | 393 | 2.54 | 5,371 | 34.75 | 9,692 | 62.71 |
| Yanpu Township (鹽埔鄉) | 387 | 2.43 | 6,561 | 41.20 | 8,977 | 56.37 |
| Gaoshu Township (高樹鄉) | 347 | 2.22 | 5,402 | 34.53 | 9,897 | 63.26 |
| Wanluan Township (萬巒鄉) | 198 | 1.61 | 3,866 | 31.41 | 8,245 | 66.98 |
| Neipu Township (內埔鄉) | 539 | 1.86 | 10,697 | 36.84 | 17,799 | 61.30 |
| Zhutian Township (竹田鄉) | 216 | 1.94 | 4,040 | 36.23 | 6,894 | 61.83 |
| Xinpi Township (新埤鄉) | 100 | 1.55 | 2,663 | 41.34 | 3,678 | 57.10 |
| Fangliao Township (枋寮鄉) | 308 | 2.03 | 7,635 | 50.44 | 7,194 | 47.53 |
| Xinyuan Township (新園鄉) | 523 | 2.52 | 8,167 | 39.28 | 12,100 | 58.20 |
| Kanding Township (崁頂鄉) | 155 | 1.87 | 3,219 | 38.80 | 4,923 | 59.33 |
| Linbian Township (林邊鄉) | 193 | 1.71 | 4,376 | 38.84 | 6,699 | 59.45 |
| Nanzhou Township (南州鄉) | 159 | 2.25 | 3,024 | 42.84 | 3,876 | 54.91 |
| Jiadong Township (佳冬鄉) | 165 | 1.39 | 4,432 | 37.29 | 7,288 | 61.32 |
| Liqiu Township (琉球鄉) | 116 | 1.69 | 4,763 | 69.26 | 1,998 | 29.05 |
| Checheng Township (車城鄉) | 74 | 1.40 | 1,786 | 33.67 | 3,444 | 64.93 |
| Manzhou Township (滿州鄉) | 89 | 1.68 | 1,994 | 37.68 | 3,209 | 60.64 |
| Fangshan Township (枋山鄉) | 72 | 1.85 | 1,385 | 35.63 | 2,430 | 62.52 |
| Sandimen Township (三地門鄉) | 85 | 1.65 | 2,895 | 56.14 | 2,177 | 42.21 |
| Wutai Township (霧臺鄉) | 46 | 1.85 | 1,129 | 45.34 | 1,315 | 52.81 |
| Majia Township (瑪家鄉) | 65 | 1.42 | 2,350 | 51.40 | 2,157 | 47.18 |
| Taiwu Township (泰武鄉) | 42 | 1.17 | 1,668 | 46.62 | 1,868 | 52.21 |
| Laiyi Township (來義鄉) | 64 | 1.35 | 2,673 | 56.24 | 2,016 | 42.42 |
| Chunri Township (春日鄉) | 71 | 2.35 | 1,737 | 57.38 | 1,219 | 40.27 |
| Shizi Township (獅子鄉) | 72 | 2.10 | 2,192 | 64.02 | 1,160 | 33.88 |
| Mudan Township (牡丹鄉) | 68 | 2.13 | 1,772 | 55.41 | 1,358 | 42.46 |
| 2018 Pingtung County mayoral results[45] | |||||
|---|---|---|---|---|---|
| No. | Candidate | Party | Votes | Percentage | |
| 1 | Lee Jung-jen (李鎔任) | 9,819 | 2.09% | ||
| 2 | Su Ching-chuan (蘇清泉) | 197,518 | 42.01% | ||
| 3 | Pan Men-an (潘孟安) | Democratic Progressive Party | 262,809 | 55.90% | |
| Total voters | 689,393 | ||||
| Valid votes | 470,146 | ||||
| Invalid votes | |||||
| Voter turnout | 68.20% | ||||
Hualien County
Political context prior to the elections
| Results of Past Hualien County Magistrate Elections | ||||
| Year | Winning Candidate | Political Party | ||
| 1997 | Chang Fu-hsin | |||
| 2001 | Chang Fu-hsin | |||
| 2005 | Hsieh Shen-shan | |||
| 2009 | Fu Kun-chi | |||
| 2014 | Fu Kun-chi | |||

| Party | Year | Vote share % |
|---|---|---|
| Democratic Progressive Party | 2016 legislative election | 53% |
| 2008 presidential election | 77% |
| Party | Presidential % | Legislative seat | Legislative % |
|---|---|---|---|
| Democratic Progressive Party | 36.94% | 1 | 53.77% |
| 47.72% | 0 | 43.58% | |
| - | 0 | - | |
| Taiwan Solidarity Union | - | 0 | - |
| 15.34% | 0 | - | |
| - | 0 | 2.65% |
Results of the primary
| 2018 Kuomintang Hualien County magistrate primary results | |||||
|---|---|---|---|---|---|
| Candidates | Place | Result | |||
| Hsu Chen-wei | Called In | Walkover | |||
| 2018 Democratic Progressive Party Hualien County magistrate primary results | ||||
|---|---|---|---|---|
| Candidates | Place | Result | ||
| Liu Siao-Mei | Called In | Walkover | ||
Opinion polls
| Poll organization | Dates conducted | Liu Siao-Mei | Lead | ||
|---|---|---|---|---|---|
| China Times | March 25, 2018 | 40.1% | 17.0% | 42.9% | 23.1% |
| ETtoday | June 13, 2018 | 44.4% | 19.0% | 36.6% | 25.4% |
Results
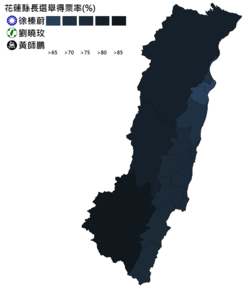
| District | Liu Siao-Mei | |||||
|---|---|---|---|---|---|---|
| Votes | % | Votes | % | Votes | % | |
| Hualien City (花蓮市) | 32,399 | 65.99 | 15,065 | 30.68 | 1,635 | 3.33 |
| Fenglin Township (鳳林鎮) | 4,991 | 76.26 | 1,418 | 21.67 | 136 | 2.08 |
| Yuli Township (玉里鎮) | 9,193 | 76.13 | 2,646 | 21.91 | 237 | 1.96 |
| Xincheng Township (新城鄉) | 7,551 | 71.41 | 2,716 | 25.69 | 307 | 2.90 |
| Ji'an Township (吉安鄉) | 28,510 | 68.51 | 11,845 | 28.46 | 1,260 | 3.03 |
| Shoufeng Township (壽豐鄉) | 7,438 | 71.53 | 2,732 | 26.27 | 229 | 2.20 |
| Guangfu Township (光復鄉) | 5,830 | 77.36 | 1,553 | 20.61 | 153 | 2.03 |
| Fengbin Township (豐濱鄉) | 2,471 | 77.70 | 629 | 19.78 | 80 | 2.52 |
| Ruisui Township (瑞穗鄉) | 5,010 | 75.78 | 1,487 | 22.49 | 114 | 1.72 |
| Fuli Township (富里鄉) | 4,628 | 77.81 | 1,229 | 20.66 | 91 | 1.53 |
| Xiulin Township (秀林鄉) | 7,074 | 80.55 | 1,629 | 18.55 | 79 | 0.90 |
| Wanrong Township (萬榮鄉) | 3,205 | 83.70 | 567 | 14.81 | 57 | 1.49 |
| Zuoxi Township (卓溪鄉) | 2,997 | 88.10 | 363 | 10.67 | 42 | 1.23 |
| 2018 Hualien County mayoral results[46] | |||||
|---|---|---|---|---|---|
| No. | Candidate | Party | Votes | Percentage | |
| 1 | Hsu Chen-wei (徐榛蔚) | 121,297 | 71.52% | ||
| 2 | Liu Siao-Mei (劉曉玫) | Democratic Progressive Party | 43,879 | 25.87% | |
| 3 | Huang Shih-peng (黃師鵬) | 4,420 | 2.61% | ||
| Total voters | 268,817 | ||||
| Valid votes | 169,596 | ||||
| Invalid votes | |||||
| Voter turnout | 63.09% | ||||
Taitung County
Political context prior to the elections
| Results of Past Taitung County Magistrate Elections | ||||
| Year | Winning Candidate | Political Party | ||
| 1997 | Chen Jen-nian | |||
| 2001 | Hsu Ching-yuan | |||
| 2005 | Wu Chun-li | |||
| 2006 | Kuang Li-chen | |||
| 2009 | Justin Huang | |||
| 2014 | Justin Huang | |||
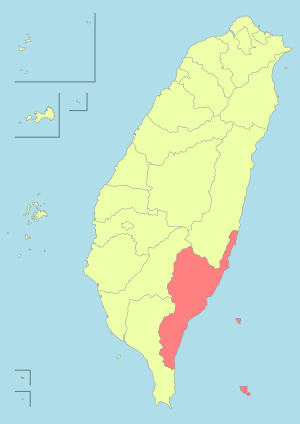
| Party | Year | Vote share % |
|---|---|---|
| Democratic Progressive Party | 2016 legislative election | 64% |
| 2008 presidential election | 73% |
| Party | Presidential % | Legislative seat | Legislative % |
|---|---|---|---|
| Democratic Progressive Party | 38.41% | 1 | 64.18% |
| 44.62% | 0 | 35.82% | |
| - | 0 | - | |
| Taiwan Solidarity Union | - | 0 | - |
| 16.96% | 0 | - | |
| - | 0 | - |
Results of the primary
| 2018 Democratic Progressive Party Taitung County magistrate primary results | ||||
|---|---|---|---|---|
| Candidates | Place | Result | ||
| Liu Chao-hao | Called In | Walkover | ||
| 2018 Kuomintang Taitung County magistrate primary results | ||||
|---|---|---|---|---|
| Candidates | Place | Results | ||
| Rao Ching-ling | Nominated | Results not released | ||
| Liao Kuo-tung | 2nd | Results not released | ||
Opinion polls
| Poll organization | Dates conducted | Liu Chao-hao | Lead | |||
|---|---|---|---|---|---|---|
| ETtoday | June 22, 2018 | 34.1% | 27.8% | 38.1% | 6.3% | |
| China Times | October 2, 2018 | 38.6% | 30.3% | 27.8% | 8.3% | |
| TVBS2 | October 10, 2018 | 40% | 31% | 24% | 9% | |
| ETtoday3 | October 21, 2018 | 36.7% | 25.9% | 23.1% | 9% | |
Note:* Opinion polls includes independent candidates.
1: | ||||||
Results

| District | Liu Chao-hao | |||||||||
|---|---|---|---|---|---|---|---|---|---|---|
| Votes | % | Votes | % | Votes | % | Votes | % | Votes | % | |
| Taitung City (臺東市) | 994 | 1.78 | 22,681 | 40.72 | 282 | 0.51 | 525 | 0.94 | 31,213 | 65.99 |
| Chenggong Township (成功鎮) | 251 | 3.41 | 2,536 | 34.41 | 43 | 0.58 | 59 | 0.80 | 4,481 | 60.80 |
| Guanshan Township (關山鎮) | 120 | 2.37 | 1,779 | 35.12 | 28 | 0.55 | 44 | 0.87 | 3,094 | 61.09 |
| Binan Township (卑南鄉) | 227 | 2.36 | 3,583 | 37.28 | 37 | 0.39 | 64 | 0.67 | 5,699 | 59.30 |
| Luye Township (鹿野鄉) | 134 | 2.93 | 1,992 | 43.50 | 33 | 0.72 | 35 | 0.76 | 2,385 | 52.09 |
| Chishang Township (池上鄉) | 103 | 2.32 | 1,704 | 38.40 | 23 | 0.52 | 19 | 0.43 | 2,588 | 58.33 |
| Donghe Township (東河鄉) | 160 | 3.40 | 1,687 | 35.83 | 31 | 0.66 | 48 | 1.02 | 2,782 | 59.09 |
| Changbin Township (長濱鄉) | 186 | 4.79 | 1,293 | 33.32 | 25 | 0.64 | 29 | 0.75 | 2,347 | 60.49 |
| Taimali Township (太麻里鄉) | 164 | 2.46 | 2,184 | 32.75 | 33 | 0.49 | 37 | 0.55 | 4,251 | 63.74 |
| Dawu Township (大武鄉) | 126 | 3.47 | 1,172 | 32.27 | 23 | 0.63 | 29 | 0.80 | 2,282 | 62.83 |
| Ludao Township (綠島鄉) | 48 | 2.06 | 719 | 30.81 | 5 | 0.21 | 26 | 1.11 | 1,536 | 65.81 |
| Haiduan Township (海端鄉) | 68 | 3.06 | 467 | 21.04 | 9 | 0.41 | 15 | 0.68 | 1,661 | 74.82 |
| Yanping Township (延平鄉) | 104 | 4.58 | 460 | 20.25 | 20 | 0.88 | 11 | 0.48 | 1,677 | 73.81 |
| Jinfeng Township (金峰鄉) | 60 | 2.45 | 606 | 24.75 | 6 | 0.25 | 6 | 0.25 | 1,770 | 72.30 |
| Daren Township (達仁鄉) | 97 | 3.93 | 641 | 25.95 | 16 | 0.65 | 9 | 0.36 | 1,707 | 69.11 |
| Lanyu Township (蘭嶼鄉) | 207 | 9.72 | 607 | 35.70 | 26 | 1.22 | 32 | 1.50 | 1,104 | 51.86 |
| 2018 Taitung County mayoral results | |||||
|---|---|---|---|---|---|
| No. | Candidate | Party | Votes | Percentage | |
| 1 | Kuang Li-zhen (鄺麗貞) | 3,049 | 2.55% | ||
| 2 | Liu Chao-hao (劉櫂豪) | Democratic Progressive Party | 44,264 | 37.04% | |
| 3 | Huang Yu-pin (黃裕斌) | 640 | 0.54% | ||
| 4 | Peng Chuan-kuo (彭權國) | 988 | 0.83% | ||
| 5 | Rao Ching-ling (饒慶鈴) | 70,577 | 59.05% | ||
| Total voters | 179,706 | ||||
| Valid votes | 119,518 | ||||
| Invalid votes | |||||
| Voter turnout | 66.51% | ||||
Penghu County
Political context prior to the elections
| Results of Past Penghu County Magistrate Elections | ||||
| Year | Winning Candidate | Political Party | ||
| 1997 | Lai Feng-wei | |||
| 2001 | Lai Feng-wei | |||
| 2005 | Lai Feng-wei | |||
| 2009 | Wang Chien-fa | |||
| 2014 | Chen Kuang-fu | Democratic Progressive Party | ||
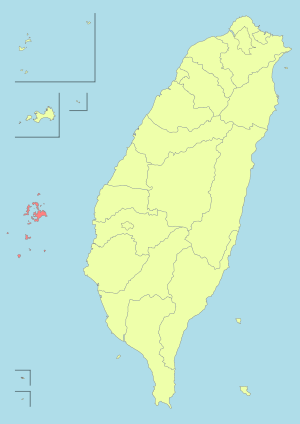
| Party | Year | Vote share % |
|---|---|---|
| Democratic Progressive Party | Taiwan local election, 1993 | 58% |
| 2008 presidential election | 58% |
| Party | Presidential % | Legislative seat | Legislative % |
|---|---|---|---|
| Democratic Progressive Party | 50.81% | 1 | 55.40% |
| 29.48% | 0 | 39.99% | |
| - | 0 | - | |
| Taiwan Solidarity Union | - | 0 | - |
| 19.71% | 0 | - | |
| - | 0 | 4.61% |
Result of the primary
| 2018 Democratic Progressive Party Penghu County magistrate primary results | ||||
|---|---|---|---|---|
| Candidates | Place | Result | ||
| Chen Kuang-fu | Nominated | Walkover | ||
| 2018 Kuomintang Penghu County magistrate primary results | ||||
|---|---|---|---|---|
| Candidates | Place | Results | ||
| Lai Feng Wei | Called In | Called in after negotiation | ||
Opinion polls
| Poll organization | Date of completion | Chen Kuang-fu | Lead | |||
|---|---|---|---|---|---|---|
| Era Com | January 19, 2018 | 26.41% | 39.39% | 34.2% | 12.98% | |
| ETtoday1 | July 8, 2018 | 20.1% | 29.1% | 32.1% | 9% | |
| Shih Shin University2 | October 17, 2018 | 14.9% | 23.3% | 45% | 8.4% | |
Note:* Opinion polls includes independent candidates.
1: | ||||||
Results
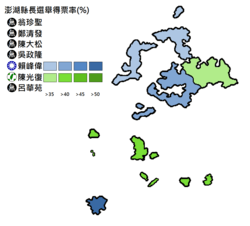
| District | Chen Kuang-fu | |||||||||||||
|---|---|---|---|---|---|---|---|---|---|---|---|---|---|---|
| Votes | % | Votes | % | Votes | % | Votes | % | Votes | % | Votes | % | Votes | % | |
| Magong City (馬公市) | 664 | 2.13 | 2,536 | 8.15 | 4,215 | 13.54 | 1,606 | 5.16 | 12,806 | 41.14 | 9,043 | 29.05 | 257 | 0.83 |
| Huxi Township (湖西鄉) | 93 | 1.19 | 797 | 10.17 | 563 | 7.18 | 733 | 9.35 | 2,452 | 31.28 | 3,084 | 39.34 | 117 | 1.49 |
| Baisha Township (白沙鄉) | 95 | 1.86 | 322 | 6.29 | 475 | 9.28 | 306 | 5.98 | 1,951 | 38.13 | 1,931 | 37.74 | 37 | 0.72 |
| Xiyu Township (西嶼鄉) | 434 | 10.73 | 218 | 5.39 | 305 | 7.54 | 209 | 5.17 | 1,558 | 38.54 | 1,294 | 32.01 | 25 | 0.62 |
| Wangan Township (望安鄉) | 70 | 2.40 | 392 | 13.44 | 195 | 6.69 | 88 | 3.02 | 841 | 28.84 | 1,310 | 44.92 | 20 | 0.69 |
| Cimei Township (七美鄉) | 23 | 1.23 | 65 | 3.47 | 69 | 3.68 | 57 | 3.04 | 962 | 51.36 | 685 | 36.57 | 12 | 0.64 |
| 2018 Penghu County mayoral results[47] | |||||
|---|---|---|---|---|---|
| No. | Candidate | Party | Votes | Percentage | |
| 1 | On Lee-la (翁珍聖) | 1,379 | 2.61% | ||
| 2 | Cheng Ching-fa (鄭清發) | 4,330 | 8.18% | ||
| 3 | Chen Ta-sung (陳大松) | 5,822 | 11.00% | ||
| 4 | Wu Cheng-lung (吳政隆) | 2,999 | 5.67% | ||
| 5 | Lai Feng-wei (賴峰偉) | 20,570 | 38.87% | ||
| 6 | Chen Kuang-fu (陳光復) | Democratic Progressive Party | 17,347 | 32.78% | |
| 7 | Lu Hwa-yuann (呂華苑) | 468 | 0.88% | ||
| Total voters | 86,603 | ||||
| Valid votes | 52,915 | ||||
| Invalid votes | |||||
| Voter turnout | 61.10% | ||||
Fujian Province
Kinmen County
Political context prior to the elections
| Results of Past Kinmen County Magistrate Elections | ||||
| Year | Winning Candidate | Political Party | ||
| 1997 | Chen Shui-zai | |||
| 2001 | Lee Chu-feng | New Party | ||
| 2005 | Lee Chu-feng | New Party | ||
| 2009 | Li Wo-shi | |||
| 2014 | Chen Fu-hai | |||

| Party | Year | Vote share % |
|---|---|---|
| Democratic Progressive Party | 2016 legislative election | 23% |
| 2008 presidential election | 95% |
| Party | Presidential % | Legislative seat | Legislative % |
|---|---|---|---|
| Democratic Progressive Party | 18.00% | 0 | 23.07% |
| 66.10% | 1 | 45.08% | |
| - | 0 | - | |
| Taiwan Solidarity Union | - | 0 | - |
| 15.90% | 0 | - | |
| - | 0 | 31.85% |
Results of the primary
| 2018 Kuomintang Kinmen County magistrate primary results | |||||
|---|---|---|---|---|---|
| Candidates | Place | Result | |||
| Yang Cheng-wu | Called In | Walkover | |||
Opinion polls
| Poll organization | Date of completion | Lead | |||
|---|---|---|---|---|---|
| Polls | July 17, 2018 | 32.7% | 30.6% | 36.7% | 2.1% |
| ETtoday | July 23, 2018 | 28% | 23% | 40.4% | 5% |
Results

| District | Kinmen Gaoliang Party Hung Chih-heng | UNESCO budget e-league Wang Cheng-hua | ||||||||||
|---|---|---|---|---|---|---|---|---|---|---|---|---|
| Votes | % | Votes | % | Votes | % | Votes | % | Votes | % | Votes | % | |
| Jincheng Township (金城鎮) | 8,137 | 54.28 | 299 | 1.99 | 257 | 0.80 | 5,916 | 39.47 | 412 | 2.75 | 106 | 0.71 |
| Jinsha Township (金沙鎮) | 2,974 | 38.56 | 87 | 1.13 | 50 | 0.65 | 4,412 | 57.20 | 151 | 1.96 | 39 | 0.51 |
| Jinhu Township (金湖鎮) | 4,204 | 39.07 | 115 | 1.07 | 75 | 0.70 | 5,855 | 54.42 | 457 | 4.25 | 53 | 0.49 |
| Jinning Township (金寧鄉) | 5,989 | 54.92 | 206 | 1.89 | 140 | 1.28 | 4,204 | 38.55 | 275 | 2.52 | 90 | 0.83 |
| Lieyu Township (烈嶼鄉) | 2,154 | 46.28 | 124 | 2.66 | 18 | 0.39 | 2,186 | 46.97 | 94 | 2.02 | 78 | 1.68 |
| Wuqiu Township (烏坵鄉) | 62 | 29.67 | 1 | 0.48 | 146 | 69.86 |
| 2018 Kinmen County mayoral results[48] | |||||
|---|---|---|---|---|---|
| No. | Candidate | Party | Votes | Percentage | |
| 1 | Yang Cheng-wu (楊鎮浯) | 23,520 | 47.48% | ||
| 2 | Hung Chih-heng (洪志恒) | Kinmen Gaoliang Party | 832 | 1.69% | |
| 3 | Wang Cheng-hua (汪承樺) | UNESCO budget e-league | 403 | 0.82% | |
| 4 | Chen Fu-hai (陳福海) | 22,719 | 46.15% | ||
| 5 | Hsieh Yi-zhen (謝宜璋) | 1,389 | 2.82% | ||
| 6 | Hong Ho-cheng (洪和成) | 366 | 0.74% | ||
| Total voters | 117,913 | ||||
| Valid votes | 49,229 | ||||
| Invalid votes | |||||
| Voter turnout | 41.75% | ||||
Lienchiang County
Political context prior to the elections
| Results of Past Lienchiang County Magistrate Elections | ||||
| Year | Winning Candidate | Political Party | ||
| 1997 | Liu Li-qun | |||
| 2001 | Chen Hsueh-sheng | |||
| 2005 | Chen Hsueh-sheng | |||
| 2009 | Yang Sui-sheng | |||
| 2014 | Liu Cheng-ying | |||
| Party | Year | Vote share % |
|---|---|---|
| Democratic Progressive Party | 2016 presidential election | 17% |
| 2009 local election | 49% |
| Party | Presidential % | Legislative seat | Legislative % |
|---|---|---|---|
| Democratic Progressive Party | 16.54% | 0 | - |
| 68.60% | 1 | 68.07% | |
| - | 0 | - | |
| Taiwan Solidarity Union | - | 0 | - |
| 14.86% | 0 | - | |
| - | 0 | 31.93% |
Results of the primary
| 2018 Kuomintang Lienchiang County magistrate primary results | |||||
|---|---|---|---|---|---|
| Candidates | Place | Result | |||
| Liu Cheng-ying | Called In | Walkover | |||
Opinion polls
| Poll organization | Date of completion | Lead | |||
|---|---|---|---|---|---|
| ETtoday | July 8, 2018 | 50% | 9.8% | 24.2% | 40.2% |
Results
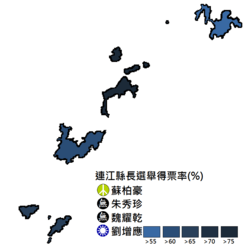
| District | ||||||||
|---|---|---|---|---|---|---|---|---|
| Votes | % | Votes | % | Votes | % | Votes | % | |
| Nangan Township (南竿鄉) | 542 | 12.98 | 871 | 20.86 | 169 | 4.05 | 2,594 | 62.12 |
| Beigan Township (北竿鄉) | 135 | 9.17 | 147 | 9.99 | 51 | 3.46 | 1,139 | 77.38 |
| Luguang Township (莒光鄉) | 100 | 9.17 | 182 | 16.70 | 76 | 6.97 | 732 | 67.16 |
| Dongyin Township (東引鄉) | 150 | 22.39 | 84 | 12.54 | 40 | 5.97 | 396 | 59.10 |
| 2018 Lienchiang County mayoral results[49] | |||||
|---|---|---|---|---|---|
| No. | Candidate | Party | Votes | Percentage | |
| 1 | Su Po-hao (蘇柏豪) | 927 | 12.51% | ||
| 2 | Chu Hsiu-chen (朱秀珍) | 1,284 | 17.33% | ||
| 3 | Wei Yao-kan (魏耀乾) | 356 | 4.54% | ||
| 4 | Liu Cheng-ying (劉增應) | 4,861 | 65.62% | ||
| Total voters | 10,773 | ||||
| Valid votes | 7,408 | ||||
| Invalid votes | |||||
| Voter turnout | 68.76% | ||||
See also
- 2018 Taiwanese local elections
- 2019 Taiwanese by-elections
- 2020 Taiwan legislative election
- 2020 Taiwan presidential election
References
- http://www.epochtimes.com/gb/17/8/20/n9547220.htm 吴敦义走马上任 国民党备战2018挑战多
- http://news.ltn.com.tw/news/politics/breakingnews/2203153 放眼2018! 民進黨全代會通過提名條例
- http://news.ltn.com.tw/news/focus/paper/1156255 民進黨首波提名9縣市長拚連任
- https://udn.com/news/story/10958/2886726 藍2018初選全民調 首波提名4縣市
- http://news.ltn.com.tw/news/politics/breakingnews/2295457 2018縣市長提名 民進黨徵召台東劉櫂豪、南投洪國浩
- http://news.ltn.com.tw/news/politics/breakingnews/2328383 國民黨今通過5縣市長提名 澎湖人選暫緩公告
- https://tw.appledaily.com/new/realtime/20180207/1294116/ 國民黨中常會通過 提名謝立功參選基隆市長
- https://tw.appledaily.com/new/realtime/20180221/1301320/ 國民黨通過盧秀燕參選台中市長 盧:誓言打贏選仗
- https://udn.com/news/story/6656/3002819 國民黨今提名黃敏惠參選嘉義市長 澎湖縣長提名仍暫緩
- http://news.ltn.com.tw/news/politics/breakingnews/2365276 民進黨提名宜嘉南高4縣市長 苗栗支持無黨籍徐定禎
- https://newtalk.tw/news/view/2018-03-21/118195 花49天撫平反彈聲浪 藍提賴峰偉回鍋戰澎湖縣長
- https://udn.com/news/story/6656/3055842 國民黨桃園市長初選陳學聖出線 楊麗環認不公憤離席
- https://udn.com/news/story/6656/3071821 國民黨新北市長初選民調 侯友宜確定勝出
- https://udn.com/news/story/6656/3106826 國民黨提名吳育仁參選嘉義縣長蘇清泉參選屏東縣長
- https://udn.com/news/story/6656/3132648 國民黨台北市長提名丁守中金門縣徵召楊鎮浯
- Benefits of Taipei mayor,China Times
- 聯合新聞網. "丁守中:將提選舉無效之訴". 聯合新聞網. Retrieved 2018-11-24.
- "凌晨提告 丁守中:這是台灣民主的重大危機 - 政治 - 自由時報電子報". Retrieved 2018-11-24.
- "柯文哲丁守中選情膠著 學者:有效票差距千分之三可申請驗票" (in Chinese). Retrieved 2018-11-24.
- https://www.cec.gov.tw/pc/en/TC/nm63000000000000000.html
- 土地面積、村里鄰、戶數暨現住人口數統計表Archived 2014-03-29 at the Wayback Machine,中華民國內政部統計資訊網
- 臺北縣改制直轄市計畫書(草案) Archived 2016-03-04 at the Wayback Machine,中華民國內政部
- 版圖最大 選民結構藍大於綠 Archived 2010-03-15 at the Wayback Machine,自由時報電子報
- 郝蘇朱蔡民調藏玄機 中間決勝負?,國家政策研究基金會,特約研究員 李華球,2010年7月20日
- "北縣》走路工疑雲 壓倒羅文嘉". 聯合新聞網. Archived from the original on 2013-12-05.
- 激戰新北市 朱贏蔡11萬票,中時電子報
- https://www.cec.gov.tw/pc/en/TC/nm65000000000000000.html
- 行政院院會通過桃園縣改制為直轄市 期帶動區域整體發展並促進城鄉共榮,中華民國行政院發言人辦公室
- 鄭文燦當選桃園市長:「一定會更清廉、更謙卑」,The News Lens 關鍵評論
- "Archived copy". Archived from the original on November 24, 2018. Retrieved November 24, 2018.CS1 maint: archived copy as title (link)
- 改制計畫內容大綱 Archived 2010-01-09 at the Wayback Machine,臺中縣市合併專屬網站
- 張溫鷹勤耕耘 中市「綠」意盎然,中時電子報
- http://db.cec.gov.tw/histQuery.jsp?voteCode=20011201C1C1&qryType=ctks 90年縣市長選舉 候選人得票數
- 「臺南縣市合併改制作業小組」
- 執政品質掛保證 綠色四縣市勝券在握 Archived 2013-12-06 at the Wayback Machine
- 民進黨賴清德宣布當選台南市長,中央社
- https://www.cec.gov.tw/pc/en/TC/nm67000000000000000.html
- 高雄縣市合併改制後之「高雄市」,其定位為新成立之直轄市,高雄縣市合併專屬網站
- "Archived copy". Archived from the original on November 24, 2018. Retrieved November 24, 2018.CS1 maint: archived copy as title (link)
- https://www.cec.gov.tw/pc/en/TC/nm10017000000000000.html
- "Archived copy". Archived from the original on November 24, 2018. Retrieved November 24, 2018.CS1 maint: archived copy as title (link)
- https://www.cec.gov.tw/pc/en/TC/nm10004000000000000.html
- https://www.cec.gov.tw/pc/en/TC/nm10018000000000000.html
- https://www.cec.gov.tw/pc/en/TC/nm10007000000000000.html
- https://www.cec.gov.tw/pc/en/TC/nm10013000000000000.html
- https://www.cec.gov.tw/pc/en/TC/nm10015000000000000.html
- "Archived copy". Archived from the original on November 24, 2018. Retrieved November 24, 2018.CS1 maint: archived copy as title (link)
- "Archived copy". Archived from the original on November 24, 2018. Retrieved November 24, 2018.CS1 maint: archived copy as title (link)
- https://www.cec.gov.tw/pc/en/TC/nm09007000000000000.html
External links
| Presidential elections | |
|---|---|
| Legislative Yuan elections | |
| Legislative by-elections |
|
| Local elections |
|
| Referendums |
|
| National Assembly elections | |
See also: Elections in the Republic of China (1912–49) | |