Results breakdown of the 1983 Spanish local elections (Basque Country)
This is the results breakdown of the local elections held in the Basque Country on 8 May 1983. The following tables show detailed results in the autonomous community's most populous municipalities, sorted alphabetically.[1][2]
Overall
| Parties and coalitions | Popular vote | Councillors | ||||
|---|---|---|---|---|---|---|
| Votes | % | ±pp | Total | +/− | ||
| Basque Nationalist Party (EAJ/PNV) | 392,406 | 39.19 | +1.70 | 1,257 | +175 | |
| Socialist Party of the Basque Country (PSE–PSOE) | 257,291 | 25.70 | +10.60 | 353 | +150 | |
| Popular Unity (HB)1 | 136,470 | 13.63 | –2.92 | 327 | +62 | |
| People's Coalition (AP–PDP–UL)2 | 77,846 | 7.77 | +7.73 | 97 | +94 | |
| Basque Country Left (EE) | 73,281 | 7.32 | +1.19 | 122 | +39 | |
| Communist Party of the Basque Country (PCE/EPK) | 20,791 | 2.08 | –2.56 | 14 | –27 | |
| Democratic and Social Centre (CDS) | 4,675 | 0.47 | New | 2 | +2 | |
| Bermean Nationalists (Bermeoko Adiskideak) | 2,554 | 0.26 | New | 5 | +5 | |
| Neighborhood Labor (Auzolan) | 2,517 | 0.25 | –1.97 | 2 | –11 | |
| Revolutionary Communist League (LKI/LCR) | 399 | 0.04 | –0.55 | 1 | –4 | |
| United Left (Ezker Batua) | 2,316 | 0.23 | New | 3 | +3 | |
| Workers' Socialist Party (PST) | 2,091 | 0.21 | New | 0 | ±0 | |
| Popular Candidacy (Herri Kandidatura) | 1,707 | 0.17 | New | 16 | +16 | |
| Independent Electors' Group (AEI) | 1,518 | 0.16 | New | 0 | ±0 | |
| Uranzu–Independent Candidacy (Uranzu) | 1,386 | 0.14 | –0.13 | 1 | –2 | |
| Others | 17,505 | 1.75 | — | 253 | –482 | |
| Blank ballots | 6,900 | 0.69 | –0.05 | |||
| Total | 1,001,317 | 2,452 | +24 | |||
| Valid votes | 1,001,317 | 98.66 | +0.02 | |||
| Invalid votes | 13,615 | 1.34 | –0.02 | |||
| Votes cast / turnout | 1,014,932 | 64.70 | +2.68 | |||
| Abstentions | 553,772 | 35.30 | –2.68 | |||
| Registered voters | 1,568,704 | |||||
| Sources[1][3][4] | ||||||
City control
The following table lists party control in the most populous municipalities, including provincial capitals (shown in bold).[1] Gains for a party are displayed with the cell's background shaded in that party's colour.
| Municipality | Population | Previous control | New control | ||
|---|---|---|---|---|---|
| Baracaldo | 118,615 | Basque Nationalist Party (EAJ/PNV) | Socialist Party of the Basque Country (PSE–PSOE) | ||
| Basauri | 52,554 | Basque Nationalist Party (EAJ/PNV) | Socialist Party of the Basque Country (PSE–PSOE) | ||
| Bilbao | 433,115 | Basque Nationalist Party (EAJ/PNV) | Basque Nationalist Party (EAJ/PNV) | ||
| Donostia-San Sebastián | 172,303 | Basque Nationalist Party (EAJ/PNV) | Basque Nationalist Party (EAJ/PNV) | ||
| Getxo | 67,793 | Basque Nationalist Party (EAJ/PNV) | Basque Nationalist Party (EAJ/PNV) | ||
| Irún | 53,334 | Basque Nationalist Party (EAJ/PNV) | Basque Nationalist Party (EAJ/PNV) (PSE–PSOE in 1983) | ||
| Portugalete | 58,071 | Socialist Party of the Basque Country (PSE–PSOE) | Socialist Party of the Basque Country (PSE–PSOE) | ||
| Rentería | 46,496 | Popular Unity (HB) | Socialist Party of the Basque Country (PSE–PSOE) | ||
| Santurce Antiguo | 53,919 | Basque Nationalist Party (EAJ/PNV) | Socialist Party of the Basque Country (PSE–PSOE) | ||
| Vitoria-Gasteiz | 189,533 | Basque Nationalist Party (EAJ/PNV) | Basque Nationalist Party (EAJ/PNV) (EA in 1986) | ||
Municipalities
Baracaldo
- Population: 118,615
 | ||||||
| Parties and coalitions | Popular vote | Seats | ||||
|---|---|---|---|---|---|---|
| Votes | % | ±pp | Total | +/− | ||
| Socialist Party of the Basque Country (PSE–PSOE) | 21,305 | 37.39 | +16.12 | 11 | +4 | |
| Basque Nationalist Party (EAJ/PNV) | 18,005 | 31.60 | +5.39 | 10 | +2 | |
| Popular Unity (HB) | 6,340 | 11.13 | –12.80 | 3 | –4 | |
| People's Coalition (AP–PDP–UL) | 4,521 | 7.94 | New | 2 | +2 | |
| Basque Country Left (EE) | 3,092 | 5.43 | +1.10 | 1 | +1 | |
| Communist Party of the Basque Country (PCE/EPK) | 2,246 | 3.94 | –3.18 | 0 | –2 | |
| United Left (Ezker Batua) | 671 | 1.18 | New | 0 | ±0 | |
| Workers' Socialist Party (PST) | 459 | 0.81 | New | 0 | ±0 | |
| Communist League (LC) | 144 | 0.25 | New | 0 | ±0 | |
| Union of the Democratic Centre (UCD) | n/a | n/a | –11.42 | 0 | –3 | |
| Blank ballots | 191 | 0.34 | +0.09 | |||
| Total | 56,974 | 27 | ±0 | |||
| Valid votes | 56,974 | 98.85 | –0.21 | |||
| Invalid votes | 665 | 1.15 | +0.21 | |||
| Votes cast / turnout | 57,639 | 65.04 | +3.91 | |||
| Abstentions | 30,985 | 34.96 | –3.91 | |||
| Registered voters | 88,624 | |||||
| Sources[1][3][5] | ||||||
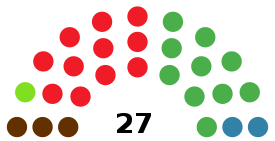
Basauri
- Population: 52,554
 | ||||||
| Parties and coalitions | Popular vote | Seats | ||||
|---|---|---|---|---|---|---|
| Votes | % | ±pp | Total | +/− | ||
| Socialist Party of the Basque Country (PSE–PSOE) | 8,516 | 36.80 | +11.92 | 10 | +3 | |
| Basque Nationalist Party (EAJ/PNV) | 7,551 | 32.63 | –2.34 | 9 | –1 | |
| Popular Unity (HB) | 2,504 | 10.82 | –6.74 | 3 | –2 | |
| People's Coalition (AP–PDP–UL) | 1,597 | 6.90 | New | 2 | +2 | |
| Basque Country Left (EE) | 1,508 | 6.52 | +0.57 | 1 | ±0 | |
| Communist Party of the Basque Country (PCE/EPK) | 1,045 | 4.52 | –3.95 | 0 | –2 | |
| Neighborhood Labor (Auzolan) | 363 | 1.57 | New | 0 | ±0 | |
| Blank ballots | 58 | 0.25 | –0.72 | |||
| Total | 23,142 | 25 | ±0 | |||
| Valid votes | 23,142 | 98.80 | +0.70 | |||
| Invalid votes | 280 | 1.20 | –0.70 | |||
| Votes cast / turnout | 23,422 | 63.61 | +9.42 | |||
| Abstentions | 13,400 | 36.39 | –9.42 | |||
| Registered voters | 36,822 | |||||
| Sources[1][3][6] | ||||||
Bilbao
- Population: 433,115
 | ||||||
| Parties and coalitions | Popular vote | Seats | ||||
|---|---|---|---|---|---|---|
| Votes | % | ±pp | Total | +/− | ||
| Basque Nationalist Party (EAJ/PNV) | 67,211 | 36.38 | –2.87 | 11 | –2 | |
| Socialist Party of the Basque Country (PSE–PSOE) | 51,108 | 27.66 | +13.73 | 9 | +5 | |
| People's Coalition (AP–PDP–UL) | 26,529 | 14.36 | New | 4 | +4 | |
| Popular Unity (HB) | 18,483 | 10.00 | –7.25 | 3 | –3 | |
| Basque Country Left (EE) | 13,070 | 7.07 | +1.57 | 2 | +1 | |
| Communist Party of the Basque Country (PCE/EPK) | 2,764 | 1.50 | –2.51 | 0 | ±0 | |
| Democratic and Social Centre (CDS) | 1,731 | 0.94 | New | 0 | ±0 | |
| Workers' Socialist Party (PST) | 1,583 | 0.86 | New | 0 | ±0 | |
| Independent Electors' Group (AEI) | 1,518 | 0.82 | New | 0 | ±0 | |
| Union of the Democratic Centre (UCD) | n/a | n/a | –17.19 | 0 | –5 | |
| Blank ballots | 768 | 0.42 | +0.15 | |||
| Total | 184,765 | 29 | ±0 | |||
| Valid votes | 184,765 | 98.90 | –0.20 | |||
| Invalid votes | 2,053 | 1.10 | +0.20 | |||
| Votes cast / turnout | 186,818 | 62.86 | +3.38 | |||
| Abstentions | 110,367 | 37.14 | –3.38 | |||
| Registered voters | 297,185 | |||||
| Sources[1][3][7][8] | ||||||
Donostia-San Sebastián
- Population: 172,303
 | ||||||
| Parties and coalitions | Popular vote | Seats | ||||
|---|---|---|---|---|---|---|
| Votes | % | ±pp | Total | +/− | ||
| Basque Nationalist Party (EAJ/PNV) | 26,806 | 34.91 | +5.10 | 10 | +1 | |
| Socialist Party of the Basque Country (PSE–PSOE) | 18,271 | 23.80 | +8.00 | 7 | +3 | |
| Popular Unity (HB) | 13,621 | 17.74 | –3.13 | 5 | –1 | |
| People's Coalition (AP–PDP–UL)1 | 9,581 | 12.48 | +12.48 | 3 | +3 | |
| Basque Country Left (EE) | 6,530 | 8.50 | –3.13 | 2 | –1 | |
| Communist Party of the Basque Country (PCE/EPK) | 867 | 1.13 | –1.18 | 0 | ±0 | |
| Democratic and Social Centre (CDS) | 793 | 1.03 | New | 0 | ±0 | |
| Independent Coordinator (UCD–DCV) (CI) | n/a | n/a | –16.46 | 0 | –5 | |
| Blank ballots | 314 | 0.41 | +0.13 | |||
| Total | 76,783 | 27 | ±0 | |||
| Valid votes | 76,783 | 99.40 | +0.10 | |||
| Invalid votes | 462 | 0.60 | –0.10 | |||
| Votes cast / turnout | 77,245 | 58.48 | +3.35 | |||
| Abstentions | 54,853 | 41.52 | –3.35 | |||
| Registered voters | 132,098 | |||||
| Sources[1][3][9] | ||||||
Getxo
- Population: 67,793
 | ||||||
| Parties and coalitions | Popular vote | Seats | ||||
|---|---|---|---|---|---|---|
| Votes | % | ±pp | Total | +/− | ||
| Basque Nationalist Party (EAJ/PNV) | 14,715 | 45.95 | +0.70 | 12 | –1 | |
| People's Coalition (AP–PDP–UL) | 6,274 | 19.59 | New | 5 | +5 | |
| Socialist Party of the Basque Country (PSE–PSOE) | 4,870 | 15.21 | +8.77 | 4 | +3 | |
| Popular Unity (HB) | 3,238 | 10.11 | –6.62 | 2 | –2 | |
| Basque Country Left (EE) | 2,395 | 7.48 | +3.11 | 2 | +2 | |
| Communist Party of the Basque Country (PCE/EPK) | 396 | 1.24 | –1.33 | 0 | ±0 | |
| Union of the Democratic Centre (UCD) | n/a | n/a | –23.19 | 0 | –7 | |
| Blank ballots | 138 | 0.43 | +0.17 | |||
| Total | 32,026 | 25 | ±0 | |||
| Valid votes | 32,026 | 99.23 | –0.05 | |||
| Invalid votes | 247 | 0.77 | +0.05 | |||
| Votes cast / turnout | 32,273 | 66.88 | +4.64 | |||
| Abstentions | 15,982 | 33.12 | –4.64 | |||
| Registered voters | 48,255 | |||||
| Sources[1][3][10] | ||||||
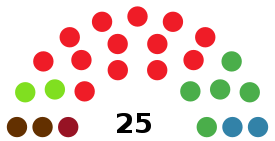
Irún
- Population: 53,334
 | ||||||
| Parties and coalitions | Popular vote | Seats | ||||
|---|---|---|---|---|---|---|
| Votes | % | ±pp | Total | +/− | ||
| Socialist Party of the Basque Country (PSE–PSOE) | 9,061 | 37.01 | +8.71 | 10 | +1 | |
| Basque Nationalist Party (EAJ/PNV) | 7,231 | 29.54 | +2.25 | 8 | ±0 | |
| Popular Unity (HB) | 2,284 | 9.33 | –1.95 | 2 | –1 | |
| Basque Country Left (EE) | 2,024 | 8.27 | –1.04 | 2 | ±0 | |
| People's Coalition (AP–PDP–UL) | 1,980 | 8.09 | New | 2 | +2 | |
| Uranzu–Independent Candidacy (Uranzu) | 1,386 | 5.66 | –5.99 | 1 | –2 | |
| Communist Party of the Basque Country (PCE/EPK) | 399 | 1.63 | –2.70 | 0 | ±0 | |
| Blank ballots | 115 | 0.47 | –1.34 | |||
| Total | 24,480 | 25 | ±0 | |||
| Valid votes | 24,480 | 98.84 | +0.58 | |||
| Invalid votes | 288 | 1.16 | –0.58 | |||
| Votes cast / turnout | 24,768 | 63.57 | +4.32 | |||
| Abstentions | 14,193 | 36.43 | –4.32 | |||
| Registered voters | 38,961 | |||||
| Sources[1][3][11] | ||||||
Portugalete
- Population: 58,071
 | ||||||
| Parties and coalitions | Popular vote | Seats | ||||
|---|---|---|---|---|---|---|
| Votes | % | ±pp | Total | +/− | ||
| Socialist Party of the Basque Country (PSE–PSOE) | 12,792 | 48.12 | +17.29 | 13 | +4 | |
| Basque Nationalist Party (EAJ/PNV) | 5,314 | 19.99 | –10.32 | 5 | –3 | |
| Popular Unity (HB) | 2,489 | 9.36 | –5.09 | 2 | –2 | |
| People's Coalition (AP–PDP–UL) | 2,155 | 8.11 | New | 2 | +2 | |
| Basque Country Left (EE) | 1,844 | 6.94 | +0.28 | 2 | +1 | |
| Communist Party of the Basque Country (PCE/EPK) | 1,391 | 5.23 | –7.83 | 1 | –2 | |
| Neighbours Association (AV) | 496 | 1.87 | New | 0 | ±0 | |
| Blank ballots | 101 | 0.38 | –2.64 | |||
| Total | 26,582 | 25 | ±0 | |||
| Valid votes | 26,582 | 98.66 | +1.22 | |||
| Invalid votes | 360 | 1.34 | –1.22 | |||
| Votes cast / turnout | 26,942 | 65.53 | +12.23 | |||
| Abstentions | 14,175 | 34.47 | –12.23 | |||
| Registered voters | 41,117 | |||||
| Sources[1][3][12] | ||||||
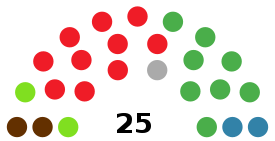
Rentería
- Population: 46,496
 | ||||||
| Parties and coalitions | Popular vote | Seats | ||||
|---|---|---|---|---|---|---|
| Votes | % | ±pp | Total | +/− | ||
| Socialist Party of the Basque Country (PSE–PSOE) | 7,680 | 39.62 | +13.79 | 9 | +3 | |
| Popular Unity (HB) | 4,480 | 23.11 | –2.49 | 5 | –1 | |
| Basque Nationalist Party (EAJ/PNV) | 4,214 | 21.74 | +0.52 | 4 | –1 | |
| Basque Country Left (EE) | 2,423 | 12.50 | +3.01 | 3 | +1 | |
| Communist Party of the Basque Country (PCE/EPK) | 433 | 2.23 | –4.11 | 0 | –1 | |
| Socialist Unification of the Basque Country (ESEI) | n/a | n/a | –5.19 | 0 | –1 | |
| Blank ballots | 155 | 0.80 | –0.05 | |||
| Total | 19,385 | 21 | ±0 | |||
| Valid votes | 19,385 | 98.55 | +0.68 | |||
| Invalid votes | 286 | 1.45 | –0.68 | |||
| Votes cast / turnout | 19,671 | 61.54 | +1.65 | |||
| Abstentions | 12,295 | 38.46 | –1.65 | |||
| Registered voters | 31,966 | |||||
| Sources[1][3][13] | ||||||
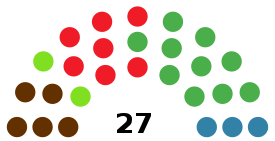
Santurce Antiguo
- Population: 53,919
 | ||||||
| Parties and coalitions | Popular vote | Seats | ||||
|---|---|---|---|---|---|---|
| Votes | % | ±pp | Total | +/− | ||
| Socialist Party of the Basque Country (PSE–PSOE) | 9,075 | 39.05 | +16.00 | 10 | +4 | |
| Basque Nationalist Party (EAJ/PNV) | 6,235 | 26.83 | +1.71 | 7 | ±0 | |
| Popular Unity (HB) | 3,403 | 14.64 | –7.97 | 4 | –2 | |
| Basque Country Left (EE) | 1,764 | 7.59 | +1.94 | 2 | +1 | |
| People's Coalition (AP–PDP–UL) | 1,675 | 7.21 | New | 2 | +2 | |
| Communist Party of the Basque Country (PCE/EPK) | 1,027 | 4.42 | –4.64 | 0 | –2 | |
| Union of the Democratic Centre (UCD) | n/a | n/a | –10.24 | 0 | –3 | |
| Blank ballots | 63 | 0.27 | –0.01 | |||
| Total | 23,242 | 25 | ±0 | |||
| Valid votes | 23,242 | 98.71 | –0.38 | |||
| Invalid votes | 303 | 1.29 | +0.38 | |||
| Votes cast / turnout | 23,545 | 62.11 | +3.76 | |||
| Abstentions | 14,366 | 37.89 | –3.76 | |||
| Registered voters | 37,911 | |||||
| Sources[1][3][14] | ||||||
Vitoria-Gasteiz
- Population: 189,533
 | ||||||
| Parties and coalitions | Popular vote | Seats | ||||
|---|---|---|---|---|---|---|
| Votes | % | ±pp | Total | +/− | ||
| Basque Nationalist Party (EAJ/PNV) | 31,250 | 35.39 | +3.24 | 11 | +1 | |
| Socialist Party of the Basque Country (PSE–PSOE) | 27,963 | 31.67 | +13.22 | 9 | +3 | |
| People's Coalition (AP–PDP–UL) | 12,823 | 14.52 | New | 4 | +4 | |
| Popular Unity (HB)1 | 7,576 | 8.58 | –1.55 | 2 | –1 | |
| Basque Country Left (EE) | 5,119 | 5.80 | +1.04 | 1 | +1 | |
| Democratic and Social Centre (CDS) | 2,067 | 2.34 | New | 0 | ±0 | |
| Communist Party of the Basque Country (PCE/EPK) | 1,132 | 1.28 | –2.58 | 0 | ±0 | |
| Union of the Democratic Centre (UCD) | n/a | n/a | –25.83 | 0 | –8 | |
| Blank ballots | 370 | 0.42 | +0.08 | |||
| Total | 88,300 | 27 | ±0 | |||
| Valid votes | 88,300 | 98.74 | –0.57 | |||
| Invalid votes | 1,127 | 1.26 | +0.57 | |||
| Votes cast / turnout | 89,427 | 65.92 | +1.52 | |||
| Abstentions | 46,239 | 34.08 | –1.52 | |||
| Registered voters | 135,666 | |||||
| Sources[1][3][15] | ||||||
Juntas Generales
References
- "Municipal elections in the Basque Country and Navarre since 1979". historiaelectoral.com (in Spanish). Electoral History. Retrieved 25 March 2018.
- "Elecciones Municipales. 8 de mayo de 1983. Euskadi". elecciones.eldiario.es (in Spanish). eldiario.es. Retrieved 7 June 2019.
- "Election Results Archive". euskadi.eus (in Spanish). Basque Government. Retrieved 23 February 2020.
- "Electoral Results Consultation. Municipal. May 1983. Basque Country". www.infoelectoral.mir.es (in Spanish). Ministry of the Interior. Retrieved 25 March 2018.
- "Electoral Results Consultation. Municipal. May 1983. Baracaldo Municipality". www.infoelectoral.mir.es (in Spanish). Ministry of the Interior. Retrieved 25 March 2018.
- "Electoral Results Consultation. Municipal. May 1983. Basauri Municipality". www.infoelectoral.mir.es (in Spanish). Ministry of the Interior. Retrieved 19 June 2020.
- "Electoral Results Consultation. Municipal. May 1983. Bilbao Municipality". www.infoelectoral.mir.es (in Spanish). Ministry of the Interior. Retrieved 25 March 2018.
- "Municipal elections in Bilbao since 1979". historiaelectoral.com (in Spanish). Electoral History. Retrieved 25 March 2018.
- "Electoral Results Consultation. Municipal. May 1983. Donostia-San Sebastián Municipality". www.infoelectoral.mir.es (in Spanish). Ministry of the Interior. Retrieved 25 March 2018.
- "Electoral Results Consultation. Municipal. May 1983. Getxo Municipality". www.infoelectoral.mir.es (in Spanish). Ministry of the Interior. Retrieved 25 March 2018.
- "Electoral Results Consultation. Municipal. May 1983. Irún Municipality". www.infoelectoral.mir.es (in Spanish). Ministry of the Interior. Retrieved 25 March 2018.
- "Electoral Results Consultation. Municipal. May 1983. Portugalete Municipality". www.infoelectoral.mir.es (in Spanish). Ministry of the Interior. Retrieved 11 June 2019.
- "Electoral Results Consultation. Municipal. May 1983. Rentería Municipality". www.infoelectoral.mir.es (in Spanish). Ministry of the Interior. Retrieved 19 June 2020.
- "Electoral Results Consultation. Municipal. May 1983. Santurce Antiguo Municipality". www.infoelectoral.mir.es (in Spanish). Ministry of the Interior. Retrieved 16 June 2019.
- "Electoral Results Consultation. Municipal. May 1983. Vitoria-Gasteiz Municipality". www.infoelectoral.mir.es (in Spanish). Ministry of the Interior. Retrieved 25 March 2018.
| Regional elections | |
|---|---|
| General elections | |
| European Parliament elections | |
| Foral elections | |
| Local elections | |
| Referendums | |
This article is issued from Wikipedia. The text is licensed under Creative Commons - Attribution - Sharealike. Additional terms may apply for the media files.