Northwestern School District
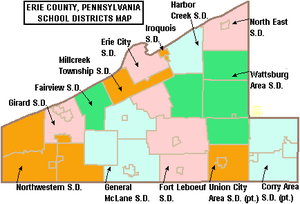
Northwestern School District is a small, rural, public school district based in Albion, Pennsylvania, United States. The district is located in Erie County, which is in the northwestern corner of Pennsylvania bordering Lake Erie and the State of Ohio. Northwestern School District encompasses approximately 122 square miles (320 km2). Three boroughs (Albion, Cranesville, and Platea) and three townships (Conneaut, Elk Creek, and Springfield) are served by the Northwestern School District.
| Northwestern School District | |
|---|---|
 | |
| Location | |
100 Harthan Way, Albion, Pennsylvania United States | |
| Information | |
| Type | Public |
| Superintendent | Mr. John Hansen |
| Faculty | 112 teachers |
| Grades | K-12 |
| Number of students | 1,378 (2018) |
| • Kindergarten | 92 |
| • Grade 1 | 88 |
| • Grade 2 | 101 |
| • Grade 3 | 95 |
| • Grade 4 | 121 |
| • Grade 5 | 117 |
| • Grade 6 | 121 |
| • Grade 7 | 87 |
| • Grade 8 | 105 |
| • Grade 9 | 118 |
| • Grade 10 | 106 |
| • Grade 11 | 113 |
| • Grade 12 | 114 |
| • Other | Enrollment projected to be 1354 students in 2020[1] |
| Color(s) | Red and Black |
| Tuition | for nonresident and charter school students ES - $9,464.94, HS - $10,010.08[2] |
| Website | www.nwsd.org |
According to 2000 federal census data, Northwestern School District serves a resident population of 11,767. In 2009, the district residents’ per capita income was $13,725, while the median family income was $41,810.[3] In the Commonwealth, the median family income was $49,501[4] and the United States median family income was $49,445, in 2010.[5]
District officials reported that in school year 2017–2018 the Northwestern School District provided basic educational services to 1,378 pupils. The district employed: 114 teachers, 49 full-time and part-time support personnel, and 11 administrators. Northwestern School District received more than $12.3 million in state funding in school year 2009–2010.
Schools
The district operates four schools. Three are located in Albion, while one is located in the unincorporated community of East Springfield (Springfield Township).
Did you know?
- NWSD has a total enrollment of 1,378 with 451 in the high school, 313 in the middle school, 387 in Northwestern Elementary and 227 in Springfield Elementary.
- NWSD has 125 professional staff (teachers, building principals, administrators)
- NWSD has 49 support staff (secretaries, aides, cafeteria staff)
- The Albion campus covers 84 acres with the three buildings
- The high school has 159,152 square feet of space
- The Middle School has 84,288 square feet of space
Academic achievement
Northwestern School District was ranked 323rd out of 498 Pennsylvania school districts by the Pittsburgh Business Times in 2012.[6] The ranking was based on student academic achievement as demonstrated on the last three years of the PSSAs for: reading, writing math and science.[7] The PSSAs are given to all children in grades 3rd through 8th and the 11th grade in high school. Adapted examinations are given to children in the special education programs. Northwestern School District ranked 8th out of 13 public school districts in Erie County in 2012. The top ranked public school district in Erie County was Fairview School District which ranked 31st statewide.
- 2016 - 10th
- 2015 - 14th
- 2011 - 377th[8]
- 2010 - 353rd[9]
- 2009 - 354th
- 2008 - 370th
- 2007 - 361st out of 501 school districts.[10]
- Overachiever statewide ranking
In 2012, the Pittsburgh Business Times also reported an Overachievers Ranking for 498 Pennsylvania school districts. Northwestern School District ranked 95th. In 2011, the district was 133rd.[11] The editor describes the ranking as: "a ranking answers the question - which school districts do better than expectations based upon economics? This rank takes the Honor Roll rank and adds the percentage of students in the district eligible for free and reduced-price lunch into the formula. A district finishing high on this rank is smashing expectations, and any district above the median point is exceeding expectations."[12]
- District Adequate Yearly Progress (AYP) history
In 2011, Northwestern School District achieved Adequate Yearly Progress (AYP).[13] In 2011, 94 percent of the 500 Pennsylvania public school districts achieved the No Child Left Behind Act progress level of 72% of students reading on grade level and 67% of students demonstrating on grade level math. In 2011, 46.9 percent of Pennsylvania school districts achieved Adequate Yearly Progress (AYP) based on student performance. An additional 37.8 percent of school districts made AYP based on a calculated method called safe harbor, 8.2 percent on the growth model and 0.8 percent on a two-year average performance.[14] Northwestern School District achieved AYP status each year from 2004 to 2009, while in 2003 the district was in Warning status due to lagging student achievement.[15]
Graduation rate
In 2011, the graduation rate was 94%.[16] In 2010, the Pennsylvania Department of Education issued a new, 4-year cohort graduation rate. Northwestern High School's rate was 88% for 2010.[17]
- According to traditional graduation rate calculations
High school
Northwestern Senior High School is located at 200 Harthan Way, Albion. According to the National Center for Education Statistics, in 2017–2018, the school reported an enrollment of 451 pupils in grades 9th through 12th, with 225 pupils eligible for a federal free or reduced-price lunch. The high school is a Title I school. The school employed 36 teachers, yielding a student–teacher ratio of 12.5:1.[22] According to a report by the Pennsylvania Department of Education, 1 teachers were rated "Non‐Highly Qualified" under No Child Left Behind.[23]
In 2011, Northwestern Senior High School achieved AYP status using Confidence Interval and Growth Model even though the students' scores were not AYP. In 2010, the high school was in Warning Status due to lagging student achievement.[24]
- PSSA Results
11th Grade Reading
- 2011 - 68% on grade level, (14% below basic). State - 69.1% of 11th graders are on grade level.[25]
- 2010 - 54% (23% below basic). State - 66%[26]
- 2009 - 57% (26% below basic). State - 65%[27]
- 2008 - 56% (21% below basic). State - 65%[28]
- 2007 - 64% (20% below basic). State - 65%[29]
11th Grade Math:
- 2011 - 63% on grade level (21% below basic). In Pennsylvania, 60.3% of 11th graders are on grade level.[30]
- 2010 - 48% (35% below basic). State - 59%[31]
- 2009 - 49% (26% below basic). State - 56%.[32]
- 2008 - 48% (32% below basic). State - 56%[33]
- 2007 - 49% (24% below basic). State - 53%[34]
11th Grade Science:
College remediation rate
According to a Pennsylvania Department of Education study released in January 2009, 20% of the Northwestern Senior High School graduates required remediation in mathematics and or reading before they were prepared to take college level courses in the Pennsylvania State System of Higher Education or community colleges.[38] Less than 66% of Pennsylvania high school graduates, who enroll in a four-year college in Pennsylvania, will earn a bachelor's degree within six years. Among Pennsylvania high school graduates pursuing an associate degree, only one in three graduate in three years.[39] Per the Pennsylvania Department of Education, one in three recent high school graduates who attend Pennsylvania's public universities and community colleges takes at least one remedial course in math, reading or English.
Dual enrollment
Northwestern Senior High School offers a dual enrollment program. This state program permits high school students to take courses, at local higher education institutions, to earn college credits. Students remain enrolled at their high school. The courses count towards high school graduation requirements and towards earning a college degree. The students continue to have full access to activities and programs at their high school. The college credits are offered at a deeply discounted rate. The state offered a small grant to assist students in costs for tuition, fees and books.[40] Under the Pennsylvania Transfer and Articulation Agreement, many Pennsylvania colleges and universities accept these credits for students who transfer to their institutions.[41] For the 2009–2010 funding year, the school district received a state grant of $19,965 for the program.[42]
Graduation requirements
The School Board has determined that a pupil must earn 26 credits to graduate. The fourth year of high school is not required for students who have completed all the requirements for graduation and are attending a post secondary institution.[43] Students must earn Mathematics 4 credits, Social Studies 4 credits, English credits, Science 3 credits, Computer - 0.5 credit, Physical Education 1.5 credits, Health .5 credits, Driver Education 0.5 credits and Electives 8 credits.
By law, all Pennsylvania secondary school students must complete a project as a part of their eligibility to graduate from high school. The type of project, its rigor and its expectations are set by the individual school district.[44]
By Pennsylvania School Board regulations, for the graduating class of 2017, students must demonstrate successful completion of secondary level course work in Algebra I, Biology, English Composition, and Literature for which the Keystone Exams serve as the final course exams. Students’ Keystone Exam scores shall count for at least one-third of the final course grade.[45][46][47] In 2011, Pennsylvania high school students field tested the Algebra 1, Biology and English Lit exams. The statewide results were: Algebra 1 38% on grade level, Biology 35% on grade level and English Lit - 49% on grade level.[48] Individual student, school or district reports were not made public, although they were reported to district officials by the Pennsylvania Department of Education.
SAT scores
From January to June 2011, 62 Northwestern High School students took the SAT exams. The district's Verbal Average Score was 489. The Math average score was 483. The Writing average score was 465.[49] Pennsylvania ranked 40th among states with SAT scores: Verbal - 493, Math - 501, Writing - 479.[50] In the United States, 1.65 million students took the exam in 2011. They averaged 497 (out of 800) verbal, 514 math and 489 in writing.[51]
References
- Pennsylvania Department of Education (July 2011). "Enrollment and Projections by school district".
- Pennsylvania Department of Education, Pennsylvania Public School District Tuition Rates, May 2018
- US Census Bureau, American Fact Finder, 2009
- US Census Bureau (2010). "American Fact Finder, State and County quick facts". Archived from the original on 2014-10-06. Retrieved 2012-08-12.
- US Census Bureau (September 2011). "Income, Poverty, and Health Insurance Coverage in the United States: 2010" (PDF).
- Pittsburgh Business Times (April 6, 2012). "Guide to Pennsylvania Schools Statewide ranking". Archived from the original on October 16, 2012.
- "Statewide Honor Roll Rankings 2012". Pittsburgh Business Times. April 5, 2012. Archived from the original on October 23, 2012.
- "Statewide Honor Roll Rankings 2011". Pittsburgh Business Times. April 2011. Archived from the original on 2011-07-23.
- Pittsburgh Business Times (April 30, 2010). "Statewide Honor Roll Rankings 2010".
- "Three of top school districts in state hail from Allegheny County". Pittsburgh Business Times. May 23, 2007. Archived from the original on July 18, 2011.
- Pittsburgh Business Times, Statewide Overachivers Ranking Information, April 6, 2012
- "Overachiever statewide ranking". Pittsburgh Business Times. May 6, 2010.
- Pennsylvania Department of Education (September 29, 2011). "Northwestern School District AYP Overview 2011". Archived from the original on January 22, 2015. Retrieved August 12, 2012.
- Pennsylvania Department of Education, Pennsylvania Public School District AYP History, 2011
- Pennsylvania Department of Education, Pennsylvania District AYP History 2003-2010, 2011
- Pennsylvania Department of Education (September 29, 2011). "Northwestern School District AYP Data Table". Archived from the original on January 23, 2015. Retrieved August 12, 2012.
- Pennsylvania Department of Education (March 15, 2011). "New 4-year Cohort Graduation Rate Calculation Now Being Implemented".
- Pennsylvania Department of Education, Northwestern School District Academic Achievement Report Card Data table, October 20, 2010
- The Times-Tribune (June 27, 2010). "PA School District Statistical Snapshot Database 2008-09".
- The Times-Tribune (June 25, 2009). "County School Districts Graduation Rates 2008".
- Pennsylvania Partnerships for Children (2008). "High School Graduation rate 2007" (PDF). Archived from the original (PDF) on 2012-05-07. Retrieved 2012-08-12.
- National Center for Education Statistics, Common Care Data - Northwestern Senior High School, 2010
- Pennsylvania Department of Education, Professional Qualifications of Teachers Northwestern Senior High School, September 29, 2011
- Pennsylvania Department of Education (September 29, 2011). "Northwestern Senior High School AYP Overview". Archived from the original on March 4, 2016. Retrieved August 12, 2012.
- Pennsylvania Department of Education (September 29, 2011). "2010-2011 PSSA and AYP Results".
- Pennsylvania Department of Education (2010). "2009-2010 PSSA and AYP Results".
- The Times-Tribune (September 14, 2009). "Grading Our Schools database, 2009 PSSA results".
- Pennsylvania Department of Education (August 15, 2008). "2007-2008 PSSA and AYP Results".
- Pennsylvania Department of Education (2007). "PSSA Math and Reading results".
- Pennsylvania Department of Education (September 29, 2011). "Northwestern Senior High School Academic Achievement Report Card 2011" (PDF).
- Pennsylvania Department of Education, Northwestern Senior High School Academic Achievement Report Card 2010, October 20, 2010
- Pennsylvania Department of Education, Northwestern Senior High School Academic Achievement Report Card 2009, September 14, 2009
- Pennsylvania Department of Education, Northwestern Senior High School Academic Achievement Report Card 2008, August 15, 2008
- Pennsylvania Department of Education, Northwestern Senior High School Academic Achievement Report Card, 2007
- Pennsylvania Department of Education (September 29, 2011). "2010-2011 PSSA results in Science".
- The Times-Tribune (2009). "Grading Our Schools database, 2009 Science PSSA results".
- Pennsylvania Department of Education (2008). "Report on PSSA Science results by school and grade 2008".
- Pennsylvania Department of Education (January 20, 2009). "Pennsylvania College Remediation Report,". Archived from the original on May 3, 2012.
- National Center for Education Statistics, IPEDS Integrated Postsecondary Education Data System, 2008
- Pennsylvania Department of Education (2010). "Dual Enrollment Guidelines".
- Commonwealth of Pennsylvania (March 2010). "Pennsylvania Transfer and Articulation Agreement".
- Pennsylvania Department of Education (2009). "Dual Enrollment Grants 2009 10 Fall Grants by School District".
- Northwestern School District, Graduation Requirements Policy 217, 2012
- Pennsylvania State Board of Education. "Pennsylvania Code §4.24 (a) High school graduation requirements".
- Pennsylvania Department of Education (2010). "Keystone Exam Overview" (PDF).
- Pennsylvania Department of Education (September 2011). "Pennsylvania Keystone Exams Overview". Archived from the original on 2012-03-17.
- Pennsylvania State Board of Education (2010). "Rules and Regulation Title 22 PA School Code CH. 4".
- Pennsylvania Department of Education (2011). "Keystone Exams".
- Pennsylvania Department of Education (2011). "Public School SAT Scores 2011". Archived from the original on 2011-10-15.
- College Board (September 2011). "SAT Scores State by State - Pennsylvania". Archived from the original on 2011-10-08. Retrieved 2012-08-12.
- "While U.S. SAT scores dip across the board, N.J. test-takers hold steady". NJ.com. September 2011.
External links
- Northwestern School District - Official site.
- Northwest Tri-County Intermediate Unit
- Erie County Technical School
- Central Career and Technical School
Erie County, Pennsylvania Schools | |||||||||||||||||||||||||||||||||
|---|---|---|---|---|---|---|---|---|---|---|---|---|---|---|---|---|---|---|---|---|---|---|---|---|---|---|---|---|---|---|---|---|---|
| |||||||||||||||||||||||||||||||||
| |||||||||||||||||||||||||||||||||