Northampton North (UK Parliament constituency)
Northampton North is a constituency[n 1] represented in the House of Commons of the UK Parliament since 2010 by Michael Ellis, a Conservative.[n 2]
| Northampton North | |
|---|---|
| Borough constituency for the House of Commons | |
 Boundary of Northampton North in Northamptonshire | |
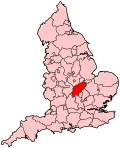 Location of Northamptonshire within England | |
| County | Northamptonshire |
| Electorate | 58,324 (2018)[1] |
| Major settlements | Northampton (part) |
| Current constituency | |
| Created | 1974 |
| Member of Parliament | Michael Ellis (Conservative) |
| Number of members | One |
| Created from | Northampton |
History
This constituency was created for the election of February 1974 when the old constituency of Northampton was split into Northampton North and Northampton South.
Since creation it has been a bellwether, electing an MP from the winning (or largest governing) party in every general election.
Boundaries
1974–1983: The County Borough of Northampton wards of Abington, Dallington, Kingsthorpe, Park, St David, and St George.
1983–2010: The Borough of Northampton wards of Abington, Boughton Green, Dallington and Kings Heath, Headlands, Kingsthorpe, Lings, Lumbertubs, Park, St Alban, St George, Thorplands, and Welford.
2010–present: The Borough of Northampton wards of Abington, Boughton Green, Eastfield, Headlands, Kingsley, Kingsthorpe, Lumbertubs, Parklands, St David, and Thorplands.
Constituency profile
The constituency has income, social housing and unemployment statistics[2] close to the national average and a varied and dynamic service and engineering-centred economy typical of the East Midlands with significant foodstuffs, clothing and consumables manufacturing and processing operations.[3] Health inequality is high, with the life expectancy gap between the least deprived and most deprived men in Northampton reaching over a decade. [4] Additionally, the constituency is 'considerably worse than [the] England average' in violent crime, self harm, under 18 conception and GCSE achievement. [5]
Members of Parliament
| Election | Member[6] | Party | |
|---|---|---|---|
| Feb 1974 | Maureen Colquhoun | Labour | |
| 1979 | Tony Marlow | Conservative | |
| 1997 | Sally Keeble | Labour | |
| 2010 | Michael Ellis | Conservative | |
Elections
Elections in the 2010s
| Party | Candidate | Votes | % | ± | |
|---|---|---|---|---|---|
| Conservative | Michael Ellis | 21,031 | 53.2 | +6.0 | |
| Labour | Sally Keeble | 15,524 | 39.3 | -5.9 | |
| Liberal Democrats | Martin Sawyer | 2,031 | 5.1 | +2.6 | |
| Green | Katherine Pate | 953 | 2.4 | +0.8 | |
| Majority | 5,507 | 13.9 | +11.9 | ||
| Turnout | 39,539 | 66.7 | -2.0 | ||
| Conservative hold | Swing | +6.0 | |||
| Party | Candidate | Votes | % | ± | |
|---|---|---|---|---|---|
| Conservative | Michael Ellis | 19,065 | 47.2 | +4.8 | |
| Labour | Sally Keeble | 18,258 | 45.2 | +11.1 | |
| UKIP | Jonathan Bullock | 1,404 | 3.5 | -12.6 | |
| Liberal Democrats | George Smid | 1,015 | 2.5 | -1.1 | |
| Green | Steve Miller | 636 | 1.6 | -2.2 | |
| Majority | 807 | 2.0 | -6.2 | ||
| Turnout | 40,411 | 68.7 | |||
| Conservative hold | Swing | -3.1 | |||
| Party | Candidate | Votes | % | ± | |
|---|---|---|---|---|---|
| Conservative | Michael Ellis | 16,699 | 42.4 | +8.3 | |
| Labour | Sally Keeble | 13,454 | 34.1 | +4.8 | |
| UKIP | Tom Rubython[10] | 6,354 | 16.1 | +13.0 | |
| Green | Tony Clarke[11] | 1,503 | 3.8 | +2.7 | |
| Liberal Democrats | Angela Paterson | 1,401 | 3.6 | -24.4 | |
| Majority | 3,245 | 8.2 | +3.4 | ||
| Turnout | |||||
| Conservative hold | Swing | +1.7 | |||
| Party | Candidate | Votes | % | ± | |
|---|---|---|---|---|---|
| Conservative | Michael Ellis | 13,735 | 34.1 | +4.4 | |
| Labour | Sally Keeble | 11,799 | 29.3 | −10.9 | |
| Liberal Democrats | Andrew Simpson | 11,250 | 27.9 | +1.0 | |
| BNP | Ray Beasley | 1,316 | 3.3 | N/A | |
| UKIP | Jim MacArthur | 1,238 | 3.1 | +0.6 | |
| Green | Tony Lochmuller | 443 | 1.1 | N/A | |
| Independent | Eamonn Fitzpatrick | 334 | 0.8 | N/A | |
| Christian | Timothy Webb | 98 | 0.2 | N/A | |
| Independent | Malcolm Mildren | 58 | 0.1 | N/A | |
| Majority | 1,936 | 4.8 | +13.8 | ||
| Turnout | 40,271 | 62.7 | +5.5 | ||
| Conservative gain from Labour | Swing | +6.9 | |||
Elections in the 2000s
| Party | Candidate | Votes | % | ± | |
|---|---|---|---|---|---|
| Labour | Sally Keeble | 16,905 | 40.2 | -9.2 | |
| Conservative | Damian Collins | 12,945 | 30.8 | +0.4 | |
| Liberal Democrats | Andrew Simpson | 10,317 | 24.5 | +6.8 | |
| UKIP | John Howsam | 1,050 | 2.5 | +1.1 | |
| SOS! Northampton | Paul Witherington | 495 | 1.2 | +1.2 | |
| Christian Peoples Alliance | Andrew Otchie | 336 | 0.8 | +0.8 | |
| Majority | 3,960 | 9.4 | -9.6 | ||
| Turnout | 42,048 | 57.9 | +1.9 | ||
| Labour hold | Swing | -4.4 | |||
| Party | Candidate | Votes | % | ± | |
|---|---|---|---|---|---|
| Labour | Sally Keeble | 20,507 | 49.4 | -3.3 | |
| Conservative | John Whelan | 12,614 | 30.4 | -3.0 | |
| Liberal Democrats | Richard Church | 7,363 | 17.7 | +5.0 | |
| UKIP | Dusan Torbica | 596 | 1.4 | +0.5 | |
| Socialist Alliance | Gordon White | 414 | 1.0 | N/A | |
| Majority | 7,893 | 19.0 | -0.3 | ||
| Turnout | 41,494 | 56.0 | -14.1 | ||
| Labour hold | Swing | -3.15 | |||
Elections in the 1990s
| Party | Candidate | Votes | % | ± | |
|---|---|---|---|---|---|
| Labour | Sally Keeble | 27,247 | 52.7 | +14.1 | |
| Conservative | Tony Marlow | 17,247 | 33.4 | -12.4 | |
| Liberal Democrats | Lesley Dunbar | 6,579 | 12.7 | -2.5 | |
| UKIP | Dusan Torbica | 474 | 0.9 | N/A | |
| Natural Law | Barry Spivack | 161 | 0.3 | N/A | |
| Majority | 10,000 | 19.0 | N/A | ||
| Turnout | 51,708 | 70.1 | -8.4 | ||
| Labour gain from Conservative | Swing | ||||
| Party | Candidate | Votes | % | ± | |
|---|---|---|---|---|---|
| Conservative | Tony Marlow | 24,865 | 45.8 | −2.2 | |
| Labour | JM Thomas | 20,957 | 38.6 | +8.5 | |
| Liberal Democrats | Richard Church | 8,236 | 15.2 | −5.5 | |
| Natural Law | B Spivack | 232 | 0.4 | +0.4 | |
| Majority | 3,908 | 7.2 | −10.7 | ||
| Turnout | 54,290 | 78.5 | +3.9 | ||
| Conservative hold | Swing | −5.4 | |||
Elections in the 1980s
| Party | Candidate | Votes | % | ± | |
|---|---|---|---|---|---|
| Conservative | Tony Marlow | 24,816 | 47.76 | +0.78 | |
| Labour | Own Granfield | 15,560 | 29.94 | +2.99 | |
| Liberal | Anthony Rounthwaite | 10,960 | 21.09 | -4.94 | |
| Green | Michael Green | 471 | 0.91 | N/A | |
| Workers Revolutionary | Steven Colling | 156 | 0.30 | N/A | |
| Majority | 9,256 | 17.81 | |||
| Conservative hold | Swing | -1.89 | |||
| Party | Candidate | Votes | % | ± | |
|---|---|---|---|---|---|
| Conservative | Tony Marlow | 23,129 | 46.98 | -1.24 | |
| Labour | D Offenbach | 13,269 | 26.95 | -9.18 | |
| Liberal | A Rounthwaite | 12,829 | 26.06 | +11.39 | |
| Majority | 9,860 | 20.03 | |||
| Conservative hold | Swing | +5.21 | |||
Elections in the 1970s
| Party | Candidate | Votes | % | ± | |
|---|---|---|---|---|---|
| Conservative | Tony Marlow | 18,597 | 48.22 | +8.55 | |
| Labour | Maureen Colquhoun | 13,934 | 36.13 | -7.67 | |
| Liberal | A Rounthwaite | 5,659 | 14.67 | -1.87 | |
| National Front | R G W Rickord | 373 | 0.97 | ||
| Majority | 4,663 | 12.09 | |||
| Conservative gain from Labour | Swing | +8.11 | |||
| Party | Candidate | Votes | % | ± | |
|---|---|---|---|---|---|
| Labour | Maureen Colquhoun | 16,314 | 43.80 | +3.80 | |
| Conservative | Richard Tracey | 14,776 | 39.67 | +1.53 | |
| Liberal | R B Baker | 6,160 | 16.54 | -4.60 | |
| Majority | 1,538 | 4.13 | -4.60 | ||
| Labour hold | Swing | +2.67 | |||
| Party | Candidate | Votes | % | ± | |
|---|---|---|---|---|---|
| Labour | Maureen Colquhoun | 16,321 | 40.72 | ||
| Conservative | C M Jackson | 15,288 | 38.14 | ||
| Liberal | R B Baker | 8,475 | 21.14 | ||
| Majority | 1,033 | 2.58 | |||
| Labour hold | Swing | -3.15 | |||
Notes
- A borough constituency (for the purposes of election expenses and type of returning officer)
- As with all constituencies, the constituency elects one Member of Parliament (MP) by the first past the post system of election at least every five years.
References
- "England Parliamentary electorates 2010-2018". Boundary Commission for England. Retrieved 23 March 2019.
- Unemployment claimants by constituency The Guardian
- "2011 Census Interactive - ONS". ons.gov.uk. Archived from the original on 2016-01-29.
- https://fingertips.phe.org.uk/static-reports/health-profiles/2019/e07000154.html?area-name=northampton
- https://fingertips.phe.org.uk/static-reports/health-profiles/2019/e07000154.html?area-name=northampton
- Leigh Rayment's Historical List of MPs – Constituencies beginning with "N" (part 3)
- "Northampton North Parliamentary constituency". BBC News. BBC. Retrieved 21 November 2019.
- "BBC Local Live: Northamptonshire". BBC News. Retrieved 14 April 2019.
- "Election Data 2015". Electoral Calculus. Archived from the original on 17 October 2015. Retrieved 17 October 2015.
- "Northampton North". northamptonnorth.com. Archived from the original on 2015-05-05. Retrieved 2020-04-20.
- "- Green Party Members' Website". greenparty.org.uk.
- "Election Data 2010". Electoral Calculus. Archived from the original on 26 July 2013. Retrieved 17 October 2015.
- "BBC News - Election 2010 - Constituency - Northampton North". bbc.co.uk.
- "Election Data 2005". Electoral Calculus. Archived from the original on 15 October 2011. Retrieved 18 October 2015.
- "Election Data 2001". Electoral Calculus. Archived from the original on 15 October 2011. Retrieved 18 October 2015.
- "Election Data 1997". Electoral Calculus. Archived from the original on 15 October 2011. Retrieved 18 October 2015.
- "Election Data 1992". Electoral Calculus. Archived from the original on 15 October 2011. Retrieved 18 October 2015.
- "Politics Resources". Election 1992. Politics Resources. 9 April 1992. Archived from the original on 24 July 2011. Retrieved 2010-12-06.
- "Election Data 1987". Electoral Calculus. Archived from the original on 15 October 2011. Retrieved 18 October 2015.
- "Election Data 1983". Electoral Calculus. Archived from the original on 15 October 2011. Retrieved 18 October 2015.
Sources
- Election Demon 1997-2005. English Boroughs Leicester East to Wythenshawe and Sale East
The Borough of Northampton | |||||||||||
|---|---|---|---|---|---|---|---|---|---|---|---|
| Suburbs and villages | 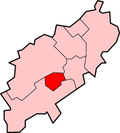 | ||||||||||
| Governance | |||||||||||
| Culture |
| ||||||||||
| Education | |||||||||||
| Sport |
| ||||||||||
| Transport | |||||||||||
| |||||||||||