Gedling (UK Parliament constituency)
Gedling is a constituency created in 1983 represented in the House of Commons of the UK Parliament since 2019 by Tom Randall of the Conservative Party.[n 1][n 2] The seat is one of the dozens of the UK seats held by Labour in 2017, but gained by the Conservatives in 2019.
| Gedling | |
|---|---|
| County constituency for the House of Commons | |
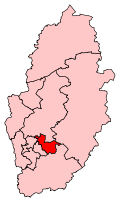 Boundary of Gedling in Nottinghamshire | |
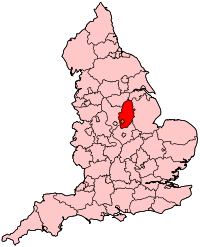 Location of Nottinghamshire within England | |
| County | Nottinghamshire |
| Electorate | 70,886 (December 2010)[1] |
| Major settlements | Arnold, Burton Joyce, Carlton, Colwick, Gedling village and Woodthorpe |
| Current constituency | |
| Created | 1983 |
| Member of Parliament | Tom Randall (Conservative) |
| Number of members | One |
| Created from | Carlton |
Boundaries and profile
1983–2010: The Borough of Gedling wards of Bonington, Burton Joyce and Stoke Bardolph, Carlton, Carlton Hill, Cavendish, Conway, Gedling, Killisick, Kingswell, Mapperley Plains, Netherfield, Oxclose, Phoenix, Porchester, Priory, St James, St Mary's, and Woodthorpe.
2010–present: The Borough of Gedling wards of Bonington, Burton Joyce and Stoke Bardolph, Carlton, Carlton Hill, Daybrook, Gedling, Killisick, Kingswell, Mapperley Plains, Netherfield and Colwick, Phoenix, Porchester, St James, St Mary's, Valley, and Woodthorpe.
Gedling is a substantial part of Greater Nottingham covering the most populated parts of the borough of the same name, it has mainly affluent, middle-income north eastern suburbs of Nottingham that include Arnold, Burton Joyce, Carlton, Colwick and Gedling village, Woodthorpe and Mapperley Plains.
History
The constituency of Gedling was created in 1983, replacing the earlier Carlton constituency. Until 1997, it only elected candidates from the Conservative Party. The seat was represented by the former Carlton MP Sir Philip Holland until 1987, then for ten years by Andrew Mitchell, son of former Conservative MP David Mitchell. The Labour Party gained the seat in their landslide victory at the 1997 general election. At that election, the junior minister lost to Labour's Vernon Coaker who retained the seat until the 2019 elections.
- Summary of results
The 2010 and 2015 results set the seat as marginal: first and second place were separated by less than 7%. At the 2005 general election, the Conservative candidate Anna Soubry (who was elected MP for nearby Broxtowe in 2010) caused controversy by revealing that she "was not proud" of the record of the area she was vying to represent, referring to crime levels in Nottingham[2] — the subsequent swing from Labour to Conservative was only 2.1% compared with the national swing of 3.1%. The 2015 result gave the seat the 29th-smallest majority of Labour's 232 seats by percentage of majority.[3]
- Other parties
UKIP in 2015 fielded the other candidate to retain their deposit. UKIP's swing nationally was +9.5% in 2015 and reached 11.4% in Gedling. Liberal Democrat and Green Party candidates forfeited their deposits in 2015.
- Turnout
Turnout has varied from 82.3% of the vote in 1992 to 63.9% in 2001 and 2005.
Members of Parliament
| Election | Member[4] | Party | |
|---|---|---|---|
| 1983 | Sir Philip Holland | Conservative | |
| 1987 | Andrew Mitchell | Conservative | |
| 1997 | Vernon Coaker | Labour | |
| 2019 | Tom Randall | Conservative | |
Elections
Elections in the 2010s

| Party | Candidate | Votes | % | ± | |
|---|---|---|---|---|---|
| Conservative | Tom Randall | 22,718 | 45.5 | +2.6 | |
| Labour | Vernon Coaker | 22,039 | 44.1 | −7.8 | |
| Liberal Democrats | Anita Prabhakar | 2,279 | 4.6 | +2.5 | |
| Brexit Party | Graham Hunt | 1,820 | 3.6 | N/A | |
| Green | Jim Norris | 1,097 | 2.2 | +1.2 | |
| Majority | 679 | 1.4 | N/A | ||
| Turnout | 49,953 | 69.9 | -2.6 | ||
| Conservative gain from Labour | Swing | +5.2 | |||
| Party | Candidate | Votes | % | ± | |
|---|---|---|---|---|---|
| Labour | Vernon Coaker | 26,833 | 51.9 | +9.6 | |
| Conservative | Carolyn Abbott | 22,139 | 42.8 | +6.8 | |
| UKIP | Lee Waters | 1,143 | 2.2 | −12.2 | |
| Liberal Democrats | Robert Swift | 1,052 | 2.0 | −1.9 | |
| Green | Rebecca Connick | 515 | 1.0 | −2.2 | |
| Majority | 4,694 | 9.1 | +2.9 | ||
| Turnout | 51,682 | 72.5 | +4.0 | ||
| Labour hold | Swing | +1.4 | |||
| Party | Candidate | Votes | % | ± | |
|---|---|---|---|---|---|
| Labour | Vernon Coaker | 20,307 | 42.3 | +1.2 | |
| Conservative | Carolyn Abbott | 17,321 | 36.1 | −1.2 | |
| UKIP | Lee Waters | 6,930 | 14.4 | +11.4 | |
| Liberal Democrats | Robert Swift | 1,906 | 4.0 | −11.3 | |
| Green | Jim Norris | 1,534 | 3.2 | +3.2 | |
| Majority | 2,986 | 6.2 | +2.3 | ||
| Turnout | 47,998 | 68.5 | +0.6 | ||
| Labour hold | Swing | +1.2 | |||
| Party | Candidate | Votes | % | ± | |
|---|---|---|---|---|---|
| Labour | Vernon Coaker | 19,821 | 41.1 | −5.5 | |
| Conservative | Bruce Laughton | 17,962 | 37.3 | +0.3 | |
| Liberal Democrats | Julia Bateman | 7,350 | 15.3 | +1.5 | |
| BNP | Stephen Adcock | 1,598 | 3.3 | +3.3 | |
| UKIP | David Marshall | 1,459 | 3.0 | +1.3 | |
| Majority | 1,859 | 3.8 | |||
| Turnout | 48,190 | 67.9 | +4.0 | ||
| Labour hold | Swing | −2.9 | |||
Because of boundary changes, vote shares in 2010 are compared to notional results from 2005.
Elections in the 2000s
| Party | Candidate | Votes | % | ± | |
|---|---|---|---|---|---|
| Labour | Vernon Coaker | 20,329 | 46.1 | −5.0 | |
| Conservative | Anna Soubry | 16,518 | 37.5 | −0.8 | |
| Liberal Democrats | Raymond Poynter | 6,070 | 13.8 | +3.2 | |
| UKIP | Alan Margerison | 741 | 1.7 | N/A | |
| Veritas | Deborah Johnson | 411 | 0.9 | N/A | |
| Majority | 3,811 | 8.6 | -4.2 | ||
| Turnout | 44,069 | 63.9 | 0.0 | ||
| Labour hold | Swing | −2.1 | |||
| Party | Candidate | Votes | % | ± | |
|---|---|---|---|---|---|
| Labour | Vernon Coaker | 22,383 | 51.1 | +4.3 | |
| Conservative | Jonathan Bullock | 16,785 | 38.3 | −1.2 | |
| Liberal Democrats | Tony Gillam | 4,648 | 10.6 | +0.7 | |
| Majority | 5,598 | 12.8 | +5.5 | ||
| Turnout | 43,816 | 63.9 | −11.8 | ||
| Labour hold | Swing | 2.7 | |||
Elections in the 1990s
| Party | Candidate | Votes | % | ± | |
|---|---|---|---|---|---|
| Labour | Vernon Coaker | 24,390 | 46.8 | +12.4 | |
| Conservative | Andrew Mitchell | 20,588 | 39.5 | −13.7 | |
| Liberal Democrats | Raymond Poynter | 5,180 | 9.9 | −2.2 | |
| Referendum | John Connor | 2,006 | 3.9 | +3.9 | |
| Majority | 3,802 | 7.3 | N/A | ||
| Turnout | 52,164 | 75.7 | -6.6 | ||
| Labour gain from Conservative | Swing | +13.1 | |||
| Party | Candidate | Votes | % | ± | |
|---|---|---|---|---|---|
| Conservative | Andrew Mitchell | 30,191 | 53.2 | −1.3 | |
| Labour | Vernon Coaker | 19,554 | 34.4 | +10.5 | |
| Liberal Democrats | DG George | 6,863 | 12.1 | −9.5 | |
| Natural Law | AKL Miszeweka | 168 | 0.3 | +0.3 | |
| Majority | 10,637 | 18.7 | −11.8 | ||
| Turnout | 56,776 | 82.3 | +3.2 | ||
| Conservative hold | Swing | −5.9 | |||
Elections in the 1980s
| Party | Candidate | Votes | % | ± | |
|---|---|---|---|---|---|
| Conservative | Andrew Mitchell | 29,492 | 54.5 | +0.4 | |
| Labour | Vernon Coaker | 12,953 | 23.9 | ||
| SDP | David Morton | 11,684 | 21.59 | ||
| Majority | 16,539 | 30.55 | |||
| Turnout | 79.14 | ||||
| Conservative hold | Swing | ||||
| Party | Candidate | Votes | % | ± | |
|---|---|---|---|---|---|
| Conservative | Philip Holland | 27,207 | 54.1 | N/A | |
| SDP | A Berkeley | 12,543 | 25.0 | N/A | |
| Labour | J Peck | 10,330 | 20.6 | N/A | |
| Independent | J Szatter | 186 | 0.37 | N/A | |
| Majority | 14,664 | 29.17 | N/A | ||
| Turnout | 75.41 | N/A | |||
| Conservative win (new seat) | |||||
Notes and references
- Notes
- A county constituency (for the purposes of election expenses and type of returning officer)
- As with all constituencies, the constituency elects one Member of Parliament (MP) by the first past the post system of election at least every five years.
- References
- "Electorate Figures". 2011 Electorate Figures. Boundary Commission for England. 4 March 2011. Archived from the original on 6 November 2010. Retrieved 13 March 2011.
- Political battle rages on leaflet, BBC, 2004-11-15, accessed on 2008-03-12
- List of Labour MPs elected in 2015 by % majority UK Political.info. Retrieved 2017-01-29
- Leigh Rayment's Historical List of MPs – Constituencies beginning with "G" (part 1)
- https://www.bbc.com/news/politics/constituencies/E14000710
- "Election Data 2015". Electoral Calculus. Archived from the original on 17 October 2015. Retrieved 17 October 2015.
- "Election Data 2010". Electoral Calculus. Archived from the original on 26 July 2013. Retrieved 17 October 2015.
- "Election Data 2005". Electoral Calculus. Archived from the original on 15 October 2011. Retrieved 18 October 2015.
- "Election Data 2001". Electoral Calculus. Archived from the original on 15 October 2011. Retrieved 18 October 2015.
- "Election Data 1997". Electoral Calculus. Archived from the original on 15 October 2011. Retrieved 18 October 2015.
- "Election Data 1992". Electoral Calculus. Archived from the original on 15 October 2011. Retrieved 18 October 2015.
- "Politics Resources". Election 1992. Politics Resources. 9 April 1992. Archived from the original on 24 July 2011. Retrieved 6 December 2010.
- "Election Data 1987". Electoral Calculus. Archived from the original on 15 October 2011. Retrieved 18 October 2015.
- "Election Data 1983". Electoral Calculus. Archived from the original on 15 October 2011. Retrieved 18 October 2015.