Niagara West—Glanbrook (provincial electoral district)
Niagara West—Glanbrook was a provincial electoral district in south eastern Ontario, Canada between 2007 and 2018. It elected one member to the Legislative Assembly of Ontario.
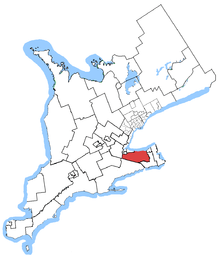 Niagara West—Glanbrook in relation to southern Ontario ridings | |
| Defunct provincial electoral district | |
| Legislature | Legislative Assembly of Ontario |
| District created | 2004 |
| District abolished | 2018 |
| First contested | 2007 |
| Last contested | 2016 |
| Demographics | |
| Population (2006) | 111,024 |
| Electors (2007) | 80,444 |
| Area (km²) | 1,080 |
| Census divisions | Hamilton, Niagara |
| Census subdivisions | Hamilton, Grimsby, Pelham, West Lincoln, Lincoln |
The riding, which was first contested in the 2007 provincial election, consisted of the municipalities of Grimsby, Pelham, West Lincoln, Lincoln and that part of Hamilton east of Glancaster Road and south of the transmission line south of Rymal Road south of the former city of Hamilton, and also south of the Niagara Escarpment east of the former city.
52.5% of the riding came from Stoney Creek, 31.5% came from Erie—Lincoln, 15.6% came from Niagara Centre and 0.2% came from Hamilton Mountain.
In 2018, the riding was dissolved into Niagara West and Flamborough—Glanbrook.
Demographics
According to the Canada 2011 Census[1][2]
- Ethnic Groups: 93.3% White, 1.5% South Asian, 1.2% Aboriginal, 1.1% Black
- Languages: 85.6% English, 2.1% Italian, 2.0% Dutch, 1.7% French, 1.5% Polish, 1.3% German
- Religion: 76.2% Christian (32.0% Catholic, 9.6% United Church, 8.5% Anglican, 2.8% Presbyterian, 1.8% Christian Orthodox, 1.8% Baptist, 1.3% Pentecostal, 1.1% Lutheran, 17.4% Other Christian), 1.2% Muslim, 21.1% No religion.
- Average household income: $94,033
- Median household income: $80,296
- Average individual income: $45,345
- Median individual income: $35,874
Members of Provincial Parliament
| Niagara West—Glanbrook | ||||
|---|---|---|---|---|
| Assembly | Years | Member | Party | |
| Riding created from Stoney Creek, Erie—Lincoln, Niagara Centre and Hamilton Mountain |
||||
| 39th | 2007–2011 | Tim Hudak | Progressive Conservative | |
| 40th | 2011–2014 | |||
| 41st | 2014–2016 | |||
| 2016–2018 | Sam Oosterhoff | |||
| Riding dissolved into Niagara West and Flamborough—Glanbrook | ||||
Election results
| Ontario provincial by-election, November 17, 2016 Resignation of Tim Hudak | ||||||||
|---|---|---|---|---|---|---|---|---|
| Party | Candidate | Votes | % | ±% | ||||
| Progressive Conservative | Sam Oosterhoff | 17,652 | 53.95 | +12.18 | ||||
| New Democratic | Mike Thomas | 8,159 | 24.94 | +2.63 | ||||
| Liberal | Vicky Ringuette | 4,997 | 15.27 | -13.05 | ||||
| Green | Donna Cridland | 892 | 2.73 | -2.64 | ||||
| Libertarian | Stefanos Karatopis | 355 | 1.09 | -0.65 | ||||
| None of the Above | Greg Vezina | 343 | 1.05 | |||||
| Independent | Martin Poos | 200 | 0.61 | |||||
| Stop the New Sex-Ed Agenda | Queenie Yu | 76 | 0.23 | |||||
| Canadian Constituents' | Arthur Smitherman | 44 | 0.13 | |||||
| Total valid votes | 32,718 | |||||||
| Total rejected, unmarked and declined ballots | 182 | 0.56 | ||||||
| Turnout | 32,900 | 32.23 | ||||||
| Eligible voters | 102,076 | |||||||
| Progressive Conservative hold | Swing | +4.78 | ||||||
| 2014 Ontario general election | ||||||||
|---|---|---|---|---|---|---|---|---|
| Party | Candidate | Votes | % | ±% | ||||
| Progressive Conservative | Tim Hudak | 23,378 | 41.82 | -9.13 | ||||
| Liberal | David Mossey | 15,843 | 28.34 | +2.36 | ||||
| New Democratic | Brian McCormack | 12,423 | 22.22 | +3.68 | ||||
| Green | Basia Krzyzanowski | 3,004 | 5.37 | +2.57 | ||||
| Libertarian | Stefanos Karatopis | 970 | 1.74 | +1.40 | ||||
| Freedom | Geoff Peacock | 284 | 0.51 | +0.34 | ||||
| Total valid votes | 55,902 | 100.00 | ||||||
| Total rejected, unmarked and declined ballots | 1,052 | 1.85 | +1.43 | |||||
| Turnout | 56,954 | 58.59 | +3.71 | |||||
| Eligible voters | 97,201 | |||||||
| Progressive Conservative hold | Swing | -5.74 | ||||||
| Source: Elections Ontario[3] | ||||||||
| 2011 Ontario general election | ||||||||
|---|---|---|---|---|---|---|---|---|
| Party | Candidate | Votes | % | ±% | ||||
| Progressive Conservative | Tim Hudak | 24,919 | 50.95 | -0.10 | ||||
| Liberal | Katie Trombetta | 12,708 | 25.98 | -4.03 | ||||
| New Democratic | Anthony Marco | 9,070 | 18.55 | +6.35 | ||||
| Green | Meredith Cross | 1,372 | 2.81 | -3.93 | ||||
| Family Coalition | Phil Lees | 303 | 0.62 | |||||
| Libertarian | Rob Wienhold | 166 | 0.34 | |||||
| People's Political Party | Marty Poos | 158 | 0.32 | |||||
| Reform | Gerry Augustine | 130 | 0.27 | |||||
| Freedom | Geoff Peacock | 80 | 0.16 | |||||
| Total valid votes | 48,906 | 100.00 | ||||||
| Total rejected, unmarked and declined ballots | 205 | 0.42 | -0.16 | |||||
| Turnout | 49,111 | 54.88 | -3.69 | |||||
| Eligible voters | 89,489 | |||||||
| Progressive Conservative hold | Swing | +1.96 | ||||||
| Source: Elections Ontario[4] | ||||||||
| 2007 Ontario general election | ||||||||
|---|---|---|---|---|---|---|---|---|
| Party | Candidate | Votes | % | ±% | ||||
| Progressive Conservative | Tim Hudak | 24,311 | 51.06 | +3.69 | ||||
| Liberal | Mike Lostracco | 14,290 | 30.01 | -5.76 | ||||
| New Democratic | Bonnie Bryan | 5,839 | 12.20 | -1.50 | ||||
| Green | Sid Frere | 3,214 | 6.73 | |||||
| Total valid votes | 47,616 | 100.00 | ||||||
| Total rejected, unmarked and declined ballots | 275 | 0.57 | ||||||
| Turnout | 47,891 | 58.57 | ||||||
| Eligible voters | 81,765 | |||||||
| Progressive Conservative hold | Swing | +4.72 | ||||||
| 2003 general election redistributed results[5] | |||
|---|---|---|---|
| Party | Vote | % | |
| Progressive Conservative | 20,306 | 47.37 | |
| Liberal | 15,334 | 35.77 | |
| New Democratic | 5,874 | 13.70 | |
| Others | 1,356 | 3.16 | |
2007 electoral reform referendum
| 2007 Ontario electoral reform referendum | |||
|---|---|---|---|
| Side | Votes | % | |
| First Past the Post | 30,972 | 65.7 | |
| Mixed member proportional | 16,195 | 34.3 | |
| Total valid votes | 47,167 | 100.0 | |
Sources
- https://www12.statcan.gc.ca/census-recensement/2011/dp-pd/prof/details/page.cfm?Lang=E&Geo1=FED&Code1=35055&Geo2=PR&Code2=01&Data=Count&SearchText=Niagara%20West&SearchType=Begins&SearchPR=01&B1=All&Custom=&TABID=1
- "General Election Results by District, 055 Niagara West—Glanbrook". Elections Ontario. 2014. Archived from the original on 17 June 2014. Retrieved 17 June 2014.
- Elections Ontario (2011). "Official return from the records / Rapport des registres officiels - Niagara West—Glanbrook" (PDF). Retrieved 4 June 2014.
- https://web.archive.org/web/20071012015305/http://www.elections.on.ca/NR/rdonlyres/58B42005-4D29-433A-B555-39A7DC0660D5/0/Transposition_of_votes.xls