Nationwide opinion polling for the 2020 United States presidential election
This is a list of nationwide public opinion polls that have been conducted relating to the general election for the 2020 United States presidential election. The persons named in the polls are declared candidates or have received media speculation about their possible candidacy. If multiple versions of polls are provided, the version among likely voters is prioritized, then registered voters, then adults.
2020 U.S. presidential election | |
|---|---|
| Republican Party | |
|
|
| Democratic Party | |
| Third parties | |
|
|
| Related races | |
| |
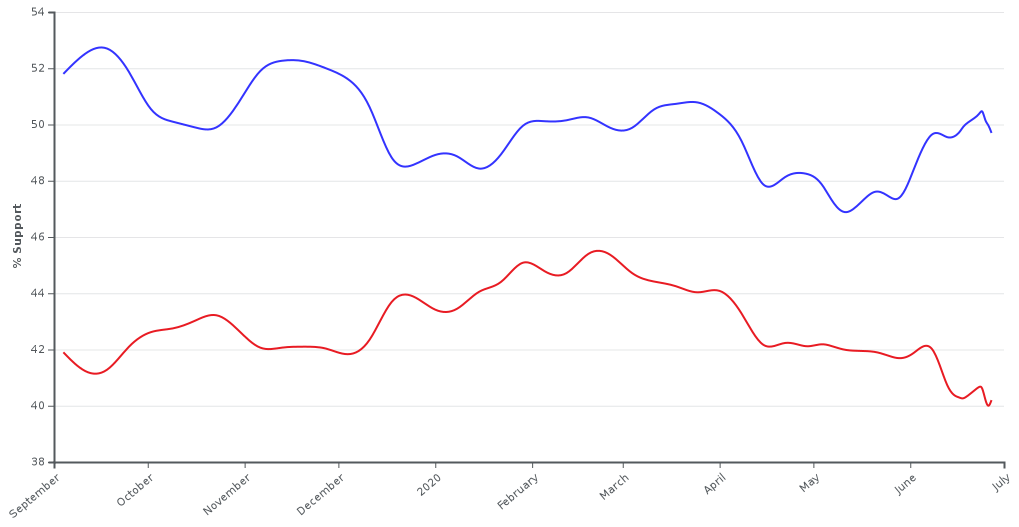
Polling aggregation
The following graph depicts the standing of each candidate in the poll aggregators from September 2019 to present. Former Vice President Joe Biden, the presumptive nominee in the Democratic primary, has an average polling margin of 9.5% over incumbent President Donald Trump, the presumed Republican nominee.
| Active candidates |
| Joe Biden (Democratic) |
| Donald Trump (Republican) |
| Donald Trump vs. Joe Biden | ||||||
|---|---|---|---|---|---|---|
| Source of poll aggregation | Dates administered | Dates updated | Joe Biden | Donald Trump | Other/Undecided[lower-alpha 1] | Margin |
| 270 to Win | June 8 – June 25, 2020 | June 27, 2020 | 49.0% | 39.0% | 12.0% | Biden +10.0 |
| RealClear Politics | June 11 – June 24, 2020 | June 27, 2020 | 49.5% | 40.1% | 10.4% | Biden +9.4 |
| FiveThirtyEight | Until June 24, 2020 | June 27, 2020 | 50.7% | 41.4% | 7.9% | Biden +9.3 |
| Average | 49.7% | 40.2% | 10.1% | Biden +9.5 | ||
Donald Trump vs. Joe Biden
| Poll source | Date(s) administered |
Sample size[lower-alpha 2] |
Margin of error |
Donald Trump (R) |
Joe Biden (D) |
Other | Undecided |
|---|---|---|---|---|---|---|---|
| RMG Research/Scott Rasmussen | Jun 25-27, 2020 | 1,200 (RV) | – | 39% | 47% | 6%[lower-alpha 3] | 7% |
| YouGov/Yahoo News | Jun 24–25, 2020 | 1,244 (RV) | – | 39% | 47% | 5%[lower-alpha 4] | 9% |
| Marist College | Jun 22–24, 2020 | 1,515 (RV) | ± 3.5% | 44% | 52% | 3% | 2% |
| Data for Progress | Jun 23, 2020 | 721 (RV) | – | 44% | 50% | 5%[lower-alpha 5] | – |
| HarrisX/The Hill | Jun 22–23, 2020 | 951 (RV) | ± 3.18% | 39% | 43% | 9%[lower-alpha 6] | 9% |
| Ipsos/Reuters | Jun 22–23, 2020 | 934 (RV) | ± 3.7% | 37% | 47% | 10%[lower-alpha 7] | 6% |
| YouGov/Economist | Jun 21–23, 2020 | 1,230 (RV) | ± 3.3% | 41% | 49% | 6%[lower-alpha 8] | 5% |
| CNBC/Hart Research/Public Opinion Strategies | Jun 19–22, 2020 | 800 (RV) | ± 3.5% | 38% | 47% | – | – |
| NYT Upshot/Siena College | Jun 17–22, 2020 | 1,337 (RV) | ± 3% | 36% | 50% | 5%[lower-alpha 9] | 9% |
| Morning Consult | Jun 15–21, 2020 | 30,942 (RV) | ± 1% | 39% | 47% | – | – |
| PPP/Protect Our Care[upper-alpha 1] | Jun 19–20, 2020 | 1,013 (V) | ± 3.1% | 43% | 52% | – | 6% |
| Harvard-Harris | Jun 17–18, 2020 | ~ 1,735 (LV)[lower-alpha 10] | – | 44% | 56% | – | – |
| YouGov/Economist | Jun 14–16, 2020 | 1,160 (RV) | ± 3.5% | 41% | 50% | 5%[lower-alpha 11] | 4% |
| Fox News | Jun 13–16, 2020 | 1,343 (RV) | ± 2.5% | 38% | 50% | 7%[lower-alpha 12] | 5% |
| Axios/SurveyMonkey | Jun 12–16, 2020 | 5,666 (A) | – | 42% | 53% | 4%[lower-alpha 13] | – |
| Echelon Insights | Jun 12–16, 2020 | 1,000 (LV) | – | 42% | 50% | – | 8% |
| Ipsos/Reuters | Jun 10–16, 2020 | 3,768 (RV)[lower-alpha 14] | ± 1.8% | 35% | 48% | 10%[lower-alpha 15] | 7% |
| Optimus/Firehouse | Jun 9–16, 2020 | 686 (LV) | – | 43.9% | 50% | 6.1%[lower-alpha 16] | – |
| Quinnipiac | Jun 11–15, 2020 | 1,332 (RV) | ± 2.7% | 41% | 49% | 4%[lower-alpha 17] | 5% |
| Kaiser Family Foundation | Jun 8–14, 2020 | 1,094 (RV) | ± 4% | 38% | 51% | 5%[lower-alpha 18] | 7% |
| Morning Consult | Jun 8–14, 2020 | 32,138 (RV) | ± 1% | 39% | 48% | – | – |
| RMG Research/Scott Rasmussen/Just the News | Jun 11–13, 2020 | 1,200 (RV) | – | 36% | 48% | 6% | 9% |
| Abacus Data | Jun 11–13, 2020 | 1,004 (LV)[lower-alpha 19] | – | 41% | 51% | – | – |
| Firehouse/Optimus | Jun 6–13, 2020 | 742 (LV) | – | 42.9% | 51.6% | 5.5%[lower-alpha 20] | – |
| Climate Nexus | Jun 6–11, 2020 | 9,087 (RV) | ± 1% | 41% | 48% | – | 11% |
| YouGov/Yahoo News | Jun 9–10, 2020 | 1,288 (RV) | – | 40% | 49% | 5%[lower-alpha 21] | 6% |
| Democracy Fund & UCLA Nationscape/SurveyUSA | May 28 – Jun 10, 2020 | 10,601 (RV) | ± 1.5% | 39% | 50% | – | – |
| YouGov/Econnomist | Jun 7–9, 2020 | 1,241 (RV) | ± 3.4% | 41% | 49% | 5%[lower-alpha 22] | 5% |
| Ipsos/Reuters | Jun 8–9, 2020 | 931 (RV) | – | 38% | 46% | 7% | 9%[lower-alpha 23] |
| Firehouse/Optimus | Jun 2–9, 2020 | 762 (LV) | – | 42.2% | 53% | 4.8%[lower-alpha 24] | – |
| MSR Group | Jun 7, 2020 | 855 (RV) | ± 3.1% | 38.9% | 46.3% | 7.3%[lower-alpha 25] | 7.5% |
| Morning Consult | Jun 1–7, 2020 | 32,380 (RV) | ± 1% | 39% | 47% | – | – |
| Firehouse/Optimus | Jun 4–6, 2020 | 787 (LV) | – | 41.9% | 53.1% | 5%[lower-alpha 26] | – |
| Scott Rasmussen/RMG Research | Jun 4–6, 2020 | 1,200 (RV) | – | 37% | 47% | 9%[lower-alpha 27] | 7% |
| Garin-Hart-Yang/Senate Majority PAC/Priorities USA[upper-alpha 2] | Jun 3–6, 2020 | 1,223 (LV) | – | 41% | 53% | – | – |
| Democracy Institute/Sunday Express | Jun 3–5, 2020 | 1,500 (LV) | ± 2.5% | 48% | 47% | – | 5% |
| CNN/SSRS | Jun 2–5, 2020 | 1,125 (RV) | ± 3.6% | 41% | 55% | 3%[lower-alpha 28] | 2% |
| NORC/AEI | May 21 – Jun 5, 2020 | 3,504 (A) | ± 2.3% | 32% | 40% | 19%[lower-alpha 29] | 9% |
| Whitman Insight Strategies | Jun 2–4, 2020 | 500 (RV) | – | 43% | 53% | 1% | 2% |
| HarrisX/The Hill | Jun 1–4, 2020 | 2,827 (RV) | ± 1.8% | 37% | 47% | 8%[lower-alpha 30] | 8% |
| Marist College | Jun 2–3, 2020 | 958 (RV) | ± 4.0% | 43% | 50% | 2% | 5% |
| Emerson College | Jun 2–3, 2020 | 1,431 (RV) | ± 2.5% | 47% | 53% | – | – |
| Civiqs/Daily Kos | Jun 1–3, 2020 | 1,327 (A) | ± 2.8% | 44% | 47% | 7%[lower-alpha 31] | 3% |
| IBD/TIPP | May 31 – Jun 3, 2020 | 964 (RV) | – | 42% | 45% | – | – |
| Data for Progress | Jun 2, 2020[lower-alpha 32] | 688 (RV) | – | 40.2% | 53.58% | 6.22%[lower-alpha 33] | – |
| Zogby Analytics | Jun 1–2, 2020 | 1,007 (LV) | ± 3.1% | 46% | 46% | – | 8% |
| Research Co. | Jun 1–2, 2020 | 1,000 (A) | ± 3.1% | 41% | 46% | 3%[lower-alpha 34] | 10%[lower-alpha 35] |
| Ipsos/Reuters | Jun 1–2, 2020 | 964 (RV) | – | 37% | 47% | – | – |
| YouGov/Economist | May 31 – Jun 2, 2020 | 1,244 (RV) | ± 3.2% | 40% | 47% | 8%[lower-alpha 36] | 5% |
| NBC/WSJ | May 28 – Jun 2, 2020 | 1,000 (RV) | ± 3.1% | 42% | 49% | 5%[lower-alpha 37] | 4% |
| Firehouse/Optimus | May 26 – Jun 2, 2020 | 795 (LV) | – | 44.4% | 50.9% | 4.7%[lower-alpha 38] | – |
| Morning Consult | May 31 – Jun 1, 2020 | 1,624 (RV) | ± 2% | 39% | 51% | – | 10% |
| YouGov/CBS News | May 29 – Jun 1, 2020 | 1,486 (LV) | – | 43% | 47% | 4%[lower-alpha 39] | 5% |
| Monmouth | May 28 – Jun 1, 2020 | 742 (RV) | ± 3.6% | 41% | 52% | 6%[lower-alpha 40] | 1% |
| Morning Consult | May 25–31, 2020 | 31,983 (RV)[lower-alpha 41] | ± 1% | 41% | 46% | – | – |
| YouGov/Yahoo News | May 29–30, 2020 | 861 (RV) | – | 40% | 48% | 6%[lower-alpha 42] | 5% |
| RMG Research/Scott Rasmussen/Just the News | May 28–30, 2020 | 1,200 (RV) | – | 39% | 46% | 7%[lower-alpha 43] | 8% |
| Firehouse/Optimus | May 21–30, 2020 | 789 (LV) | – | 45.4% | 49.7% | 4.9%[lower-alpha 44] | – |
| ABC News/Washington Post | May 25–28, 2020 | 835 (RV) | ± 4% | 43% | 53% | 2%[lower-alpha 45] | 1% |
| TargetSmart | May 21–27, 2020 | 1,200 (RV) | ± 2.8% | 40% | 43% | 9%[lower-alpha 46] | 8% |
| Ipsos/Reuters | May 20–27, 2020 | 3,732 (RV) | ± 1.8% | 39% | 45% | 8%[lower-alpha 47] | 7% |
| Data for Progress | May 26, 2020[lower-alpha 48] | 686 (RV) | – | 43.67% | 49.81% | 4.52%[lower-alpha 49] | – |
| Zogby/EMI/Washington Examiner | May 26, 2020[lower-alpha 50] | 1,001 (LV) | ± 3.2% | 40% | 53% | – | – |
| YouGov/Economist | May 23–26, 2020 | 1,153 (RV) | ± 3.4% | 42% | 45% | 8%[lower-alpha 51] | 6% |
| Firehouse/Optimus | May 19–26, 2020 | 793 (LV) | – | 44.1% | 51.8% | 4.1%[lower-alpha 52] | – |
| Morning Consult | May 18–24, 2020 | 30,317 (RV) | ± 1% | 41% | 46% | – | – |
| Firehouse/Optimus | May 16–23, 2020 | 766 (LV) | – | 42.7% | 53.9% | 3.4%[lower-alpha 53] | – |
| YouGov/Yahoo News | May 20–21, 2020 | 1,218 (RV) | – | 42% | 46% | 6%[lower-alpha 54] | 6% |
| Echelon Insights | May 18–20, 2020 | 1,000 (LV) | – | 42% | 51% | – | 7% |
| Fox News | May 17–20, 2020 | 1,207 (RV) | ± 2.5% | 40% | 48% | 6%[lower-alpha 55] | 5% |
| Data for Progress/Harvard | May 19, 2020 | 810 (RV) | – | 42% | 51% | – | – |
| Ipsos/Reuters | May 18–19, 2020 | 957 (RV) | ± 3.6% | 38% | 47% | 7%[lower-alpha 56] | 7% |
| Rasmussen Reports/Pulse Opinion Research | May 18–19, 2020 | 1,000 (LV) | ± 3% | 43% | 48% | – | 8% |
| YouGov/Economist | May 17–19, 2020 | 1,235 (RV) | ± 3.2% | 42% | 47% | 6%[lower-alpha 57] | 5% |
| Firehouse/Optimus | May 12–19, 2020 | 774 (LV) | – | 41.5% | 51.5% | 7%[lower-alpha 58] | – |
| Quinnipiac | May 14–18, 2020 | 1,323 (RV) | ± 2.7% | 39% | 50% | 4%[lower-alpha 59] | 7% |
| Kaiser Family Foundation | May 13–18, 2020 | 970 (RV) | ± 4% | 41% | 43% | 5%[lower-alpha 60] | 12% |
| Morning Consult | May 11–17, 2020 | 28,159 (RV) | ± 1% | 41% | 46% | – | – |
| Scott Rasmussen/RMG Research/Just the News | May 14–16, 2020 | 1,200 (RV) | – | 39% | 43% | 8%[lower-alpha 61] | 9% |
| Firehouse/Optimus | May 9–16, 2020 | 780 (LV) | – | 41.4% | 51.6% | 7%[lower-alpha 62] | – |
| HarrisX/The Hill | May 13–14, 2020 | 950 (RV) | ± 3.18% | 41% | 42% | 9%[lower-alpha 63] | 9% |
| Harvard-Harris | May 13–14, 2020 | 1,708 (LV) | – | 47% | 53% | – | – |
| Data for Progress/Harvard | May 12, 2020 | 684 (RV) | – | 41% | 48% | – | – |
| Ipsos/Reuters | May 11–12, 2020 | 973 (RV) | – | 38% | 46% | – | – |
| YouGov/Economist | May 10–12, 2020 | 1,175 (RV) | ± 3.4% | 43% | 47% | 6%[lower-alpha 64] | 5% |
| Firehouse/Optimus | May 5–12, 2020 | 728 (LV) | – | 43.3% | 52% | 4.7%[lower-alpha 65] | – |
| CNN/SSRS | May 7–10, 2020 | 1,001 (RV) | ± 4% | 46% | 51% | 2%[lower-alpha 66] | 1%[lower-alpha 67] |
| Morning Consult | May 4–10, 2020 | 27,754 (RV) | ± 1% | 42% | 45% | – | 13% |
| Redfield and Wilton Strategies | May 8–9, 2020 | 1,384 (LV) | – | 40%[lower-alpha 68] | 47% | 4%[lower-alpha 69] | 9% |
| 1,408 (LV) | – | 39%[lower-alpha 70] | 48% | 4%[lower-alpha 71] | 9% | ||
| Scott Rasmussen/RMG Research | May 7–9, 2020 | 1,200 (RV) | – | 38% | 44% | 7%[lower-alpha 72] | 10% |
| Firehouse/Optimus | May 2–9, 2020 | 726 (LV) | – | 44.5% | 50% | 5.5%[lower-alpha 73] | – |
| HarrisX/The Hill | May 6, 2020 | 957 (RV) | ± 3.17% | 41% | 41% | 9%[lower-alpha 74] | 9% |
| Data for Progress/Harvard | May 5, 2020 | 795 (RV) | – | 44% | 50% | – | – |
| YouGov/Yahoo News | May 4–5, 2020 | 1,224 (RV) | – | 42% | 45% | 7%[lower-alpha 75] | 6% |
| Ipsos/Reuters | May 4–5, 2020 | 1,015 (RV) | ± 3.5% | 41% | 43% | 9%[lower-alpha 76] | 6% |
| YouGov/Economist | May 3–5, 2020 | 1,206 (RV) | ± 3.3% | 42% | 46% | 7%[lower-alpha 77] | 5% |
| Civiqs/Daily Kos | May 2–5, 2020 | 1,546 (A) | ± 2.5% | 44% | 47% | 7%[lower-alpha 78] | 2% |
| Firehouse/Optimus | Apr 28 – May 5, 2020 | 758 (LV) | – | 45% | 51% | 4%[lower-alpha 79] | – |
| Monmouth University | Apr 30 – May 4, 2020 | 739 (RV) | ± 3.6% | 41%[lower-alpha 80] | 50% | 4%[lower-alpha 81] | 5% |
| 40%[lower-alpha 82] | 47% | 7%[lower-alpha 83] | 6% | ||||
| Morning Consult | May 2–3, 2020 | 1,991 (RV) | ± 2% | 41% | 45% | 3%[lower-alpha 84] | 11% |
| Change Research/CNBC | May 1–3, 2020 | 1,489 (LV) | ± 2.54% | 44% | 47% | 7%[lower-alpha 85] | 2% |
| Morning Consult | Apr 27 – May 3, 2020 | 31,117 (RV)[lower-alpha 86] | – | 42% | 46% | – | – |
| Scott Rasmussen/RMG Research | Apr 30 – May 2, 2020 | 1,200 (RV) | – | 39% | 46% | 7%[lower-alpha 87] | 8% |
| Firehouse/Optimus | Apr 25 – May 2, 2020 | 765 (LV) | – | 45.3% | 49.5% | 5.2%[lower-alpha 88] | – |
| YouGov/CBS News | Apr 28 – May 1, 2020 | 1,671 (LV) | – | 43% | 49% | 4%[lower-alpha 89] | 4% |
| Ipsos/Reuters | Apr 27–29, 2020 | 1,876 (RV) | ± 2.6% | 39% | 45% | 9%[lower-alpha 90] | 7% |
| IBD/TIPP | Apr 26–29, 2020 | 948 (RV) | – | 43% | 43% | – | – |
| Data for Progress/Harvard | Apr 28, 2020 | 895 (RV) | – | 43% | 52% | – | – |
| YouGov/Economist | Apr 26–28, 2020 | 1,222 (RV) | ± 3.2% | 41% | 47% | 6%[lower-alpha 91] | 6% |
| Emerson College | Apr 26–28, 2020 | 1,200 (RV) | – | 46.3%[lower-alpha 92] | 53.7% | – | – |
| Firehouse/Optimus | Apr 21–28, 2020 | 766 (LV) | – | 45.3% | 49.2% | 5.5%[lower-alpha 93] | – |
| Morning Consult | Apr 20–26, 2020 | 30,560 (RV) | ± 1% | 42% | 46% | – | – |
| Scott Rasmussen/RMG Research | Apr 23–25, 2020 | 1,200 (RV) | – | 38% | 46% | 6%[lower-alpha 94] | 9% |
| Suffolk University/USA Today | Apr 21–25, 2020 | 1,000 (RV) | – | 38% | 44% | 10%[lower-alpha 95] | 9% |
| Firehouse/Optimus | Apr 18–25, 2020 | 784 (LV) | – | 44% | 52% | 4%[lower-alpha 96] | – |
| Redfield & Whilton Strategies | Apr 23, 2020 | 1,362 (LV) | – | 40% | 49% | 2%[lower-alpha 97] | 9% |
| Data for Progress/Harvard | Apr 21, 2020 | 860 (RV) | – | 44% | 49% | – | – |
| YouGov/Economist | Apr 19–21, 2020 | 1,142 (RV) | ± 3.4% | 42% | 48% | 5%[lower-alpha 98] | 5% |
| Ipsos/Reuters | Apr 15–21, 2020 | 3,806 (RV) | ± 1.8% | 39% | 47% | 8%[lower-alpha 99] | 7% |
| Firehouse/Optimus | Apr 14–21, 2020 | 829 (LV) | – | 44.3% | 52.7% | – | 3% |
| HarrisX/The Hill | Apr 19–20, 2020 | 958 (RV) | ± 3.17% | 40% | 42% | 9%[lower-alpha 100] | 9% |
| Fordham University | Apr 16–20, 2020 | 862 (RV) | ± 4.33% | 42% | 56% | – | 3% |
| Climate Nexus | Apr 19, 2020 | 1,917 (RV) | ± 2.3% | 40% | 49% | – | 10% |
| Morning Consult | Apr 13–19, 2020 | 31,482 (RV) [lower-alpha 101] | ± 1% | 42% | 47% | – | – |
| Change Research/CNBC | Apr 17–18, 2020 | 1,178 (LV) | ± 2.9% | 44% | 48% | 6%[lower-alpha 102] | 1% |
| Scott Rasmussen/RMG Research/Just the News Daily Poll | Apr 16–18, 2020 | 1,000 (RV) | ± 2.8% | 40% | 49% | 5%[lower-alpha 103] | 6% |
| Firehouse/Optimus | Apr 11–18, 2020 | 745 (LV) | – | 44.3% | 52.2% | 3.5%[lower-alpha 104] | – |
| Harvard-Harris | Apr 14–16, 2020 | 2,190 (LV) | – | 47% | 53% | – | – |
| Morning Consult | Apr 14–16, 2020 | 1,992 (RV) | ± 2.0 % | 42% | 46% | 12%[lower-alpha 105] | – |
| 43% | 47% | 10%[lower-alpha 106] | – | ||||
| NBC News/Wall Street Journal | Apr 13–15, 2020 | 900 (RV) | ± 3.27 % | 42% | 49% | 5% | 4% |
| Change Research | Apr 13–15, 2020 | 1,349 (LV) | ± 3.4% | 40%[lower-alpha 107] | 51% | 7%[lower-alpha 108] | 2% |
| Data for Progress/Harvard | Apr 14, 2020 | 802 (RV) | – | 45% | 49% | – | – |
| Ipsos/Reuters | Apr 13–14, 2020 | 937 (RV) | ± 4.0 % | 40% | 45% | – | – |
| YouGov/Economist | Apr 12–14, 2020 | 1,160 (RV) | ± 3.4 % | 43% | 48% | 5%[lower-alpha 109] | 4% |
| Civiqs | Apr 11–14, 2020 | 1,600 (A) | ± 2.6 % | 44% | 48% | 6% | 2% |
| Firehouse/Optimus | Apr 7–14, 2020 | 732 (LV) | – | 42.1% | 53.9% | 4%[lower-alpha 110] | – |
| Pew Research Center | Apr 8–12, 2020 | 4,208 (RV) | ± 2.2 % | 45% | 47% | 8% | – |
| Morning Consult | Apr 6–12, 2020 | 25,372 (RV) [lower-alpha 111] | ± 1% | 42% | 45% | – | – |
| Firehouse/Optimus | Apr 4–10, 2020 | 814 (LV)[lower-alpha 112] | – | 43.3% | 52.8% | 4%[lower-alpha 113] | – |
| YouGov/Yahoo News | Apr 6–7, 2020 | 1,139 (RV) | – | 40% | 49% | 6%[lower-alpha 114] | 5% |
| Ipsos/Reuters | Apr 6–7, 2020 | 959 (RV) | – | 37% | 43% | – | – |
| YouGov/Economist | Apr 5–7, 2020 | 1,144 (RV) | ± 3.1 % | 42% | 48% | 6%[lower-alpha 115] | 4% |
| Fox News | Apr 4–7, 2020 | 1,107 (RV) | ± 3.0 % | 42% | 42% | 7% | 6% |
| Climate Nexus | Apr 3–7, 2020 | 3,168 (RV) | – | 41% | 47% | – | – |
| Monmouth University | Apr 3–7, 2020 | 743 (RV) | ± 3.6 % | 44% | 48% | 6%[lower-alpha 116] | 3% |
| CNN/SSRS | Apr 3–6, 2020 | 875 (RV) | ± 3.9% | 42% | 53% | 2%[lower-alpha 117] | 3% |
| Hart Research/Public Opinion Strategies/CNBC |
Apr 3–6, 2020 | 604 (RV) | – | 39% | 44% | 4%[lower-alpha 118] | 13%[lower-alpha 119] |
| Quinnipiac University | Apr 2–6, 2020 | 2,077 (RV) | ± 2.2% | 41% | 49% | 5%[lower-alpha 120] | 5% |
| Hart Research Associates/Protect Our Care[upper-alpha 3] | Apr 3–5, 2020 | 1,015 (RV) | – | 43% | 51% | 2%[lower-alpha 121] | 4% |
| Morning Consult | Mar 30 – Apr 5, 2020 | 30,985 (RV) | ± 1% | 42% | 46% | – | 12% |
| Firehouse/Optimus | Mar 28 – Apr 4, 2020 | 937 (LV)[lower-alpha 122] | – | 43.8% | 50.2% | 6%[lower-alpha 123] | – |
| Research Co. | Apr 3, 2020 | 1,000 (A) | ± 3.1 % | 44% | 50% | 6% | – |
| Change Research | Apr 2–3, 2020 | 1,200 (LV) | – | 45% | 43% | 9%[lower-alpha 124] | 2% |
| IBD/TIPP | Mar 29 – Apr 1, 2020 | 980 (RV) | – | 41% | 47% | 6%[lower-alpha 125] | 7% |
| Ipsos/Reuters | Mar 30–31, 2020 | 930 (RV) | – | 40% | 46% | – | – |
| YouGov/Economist | Mar 29–31, 2020 | 1,194 (RV) | ± 3.2% | 42% | 46% | 7%[lower-alpha 126] | 6% |
| Selzer & Co./Grinnell College | Mar 27–30, 2020 | 777 (LV) | ± 3.5 % | 43% | 47% | 8% | 1% |
| Morning Consult | Mar 23–29, 2020 | 34,645 (RV) | ± 1% | 42% | 46% | – | 12% |
| YouGov | Mar 26–28, 2020 | 1,193 (RV) | ± 3.2 % | 42% | 46% | 4% | 6% |
| Change Research | Mar 26–28, 2020 | 1,845 (LV) | ± 3.3% | 42% | 47% | – | 11% |
| Scott Rasmussen/RMG | Mar 26–28, 2020 | 1,000 (RV) | – | 40% | 45% | – | – |
| Firehouse/Optimus | Mar 21–28, 2020 | 1,032 (LV)[lower-alpha 127] | – | 42.8% | 51.1% | 6.1%[lower-alpha 128] | – |
| YouGov/Yahoo News | Mar 25–26, 2020 | 1,579 (A) | ± 3.1 % | 40% | 46% | 5%[lower-alpha 129] | 8% |
| Harvard-Harris | Mar 24–26, 2020 | 2,410 (RV) | – | 45% | 55% | – | – |
| ABC News/Washington Post | Mar 22–25, 2020 | 845 (RV) | ± 3.5 % | 47% | 49% | 2% | 1% |
| YouGov/Economist | Mar 22–24, 2020 | 1,167 (RV) | ± 3.4 % | 42% | 46% | 6%[lower-alpha 130] | 6% |
| Fox News | Mar 21–24, 2020 | 1,011 (RV) | ± 3.0 % | 40% | 49% | 5% | 4% |
| Echelon Insights | Mar 20–24, 2020 | 1,000 (RV) | – | 41% | 50% | – | 8% |
| Ipsos/Reuters | Mar 18–24, 2020 | 3,763 (RV) | – | 39% | 46% | – | – |
| Lord Ashcroft Polls | Mar 10–24, 2020 | 10,357 (A) | – | 36% | 48% | 9%[lower-alpha 131] | 7% |
| Redfield & Whilton Strategies | Mar 23, 2020 | 1,500 (LV) | ± 2.57% | 40%[lower-alpha 132] | 48% | 4%[lower-alpha 133] | 8% |
| Monmouth University | Mar 18–22, 2020 | 754 (RV) | ± 3.6 % | 45% | 48% | 3% | 4% |
| Morning Consult | Mar 16–22, 2020 | 36,272 (RV) | ± 1% | 42% | 47% | – | 12% |
| Emerson College | Mar 18–19, 2020 | 1,100 (RV) | ± 2.9 % | 47% | 53% | – | – |
| YouGov/Economist | Mar 15–17, 2020 | 1,129 (RV) | ± 3.5 % | 41% | 48% | 6%[lower-alpha 134] | 5% |
| Ipsos/Reuters | Mar 13–16, 2020 | 955 (RV) | ± 3.6 % | 37% | 46% | 11%[lower-alpha 135] | 6%[lower-alpha 136] |
| Morning Consult | Mar 11–15, 2020 | 9,979 (RV) | ± 1% | 42% | 48% | – | 11% |
| NBC News/Wall Street Journal | Mar 11–13, 2020 | 900 (RV) | ± 3.3 % | 43% | 52% | 3% | 2% |
| Hofstra University/YouGov | Mar 5–12, 2020 | 1,500 (LV) | ± 2.9 % | 49% | 51% | – | – |
| YouGov | Mar 10–11, 2020 | 1,240 (RV) | – | 41% | 45% | 7%[lower-alpha 137] | 6% |
| Civiqs | Mar 8–11, 2020 | 1,441 (RV) | ± 2.7 % | 46% | 48% | – | 6% |
| YouGov | Mar 8–10, 2020 | 1,191 (RV) | ± 2.9 % | 43% | 47% | 5%[lower-alpha 138] | 5% |
| Ipsos/Reuters | Mar 6–9, 2020 | 956 (RV) | ± 3.6% | 42% | 44% | 10%[lower-alpha 139] | 5%[lower-alpha 140] |
| Quinnipiac University | Mar 5–8, 2020 | 1,261 (RV) | ± 2.8% | 41% | 52% | 3%[lower-alpha 141] | 5% |
| Rasmussen Reports | Mar 5–8, 2020 | 1,000 (RV) | ± 3% | 42% | 48% | – | 9% |
| Morning Consult | Mar 5–8, 2020 | 6,112 (RV) | ± 1% | 42% | 46% | – | 12% |
| CNN/SSRS | Mar 4–7, 2020 | 1,084 (RV) | ± 3.5% | 43% | 53% | 1%[lower-alpha 142] | 2% |
| IBD/TIPP | Feb 20–29, 2020 | 839 (RV) | – | 46% | 49% | 2%[lower-alpha 143] | 2% |
| Harvard-Harris | Feb 26–28, 2020 | 651 (RV) | – | 45% | 55% | – | – |
| YouGov/Yahoo News | Feb 26–27, 2020 | 1,662 (RV) | – | 41% | 50% | 6%[lower-alpha 144] | 3% |
| Morning Consult | Feb 23–27, 2020 | 6,117 (RV) | ± 1% | 42% | 46% | – | 12% |
| Fox News | Feb 23–26, 2020 | 1,000 (RV) | ± 3.0 % | 41% | 49% | 6%[lower-alpha 145] | 4% |
| Ipsos/Reuters | Feb 19–25, 2020 | 3,809 (RV) | ± 1.8% | 40%[lower-alpha 146] | 47% | –[lower-alpha 147] | –[lower-alpha 148] |
| YouGov/CBS News | Feb 20–22, 2020 | 10,000 (RV) | ± 1.2 % | 45% | 47% | 5%[lower-alpha 149] | 4% |
| Saint Leo University | Feb 17–22, 2020 | 1,000 (A) | ± 3% | 39.4% | 46.8% | – | 13.8% |
| Emerson College | Feb 16–18, 2020 | 1,250 (RV) | ± 2.7 % | 52% | 48% | – | – |
| ABC News/Washington Post | Feb 14–17, 2020 | 913 (RV) | ± 4% | 45% | 52% | 3%[lower-alpha 150] | 1% |
| NBC News/Wall Street Journal | Feb 14–17, 2020 | 900 (RV) | ± 3.3 % | 44% | 52% | – | – |
| Ipsos/Reuters | Feb 14–17, 2020 | 947 (RV) | ± 3.6% | 40% | 42% | 12%[lower-alpha 151] | 6%[lower-alpha 152] |
| SurveyUSA | Feb 13–17, 2020 | 2,768 (RV) | ± 1.9 % | 45% | 48% | – | 7% |
| Morning Consult | Feb 12–17, 2020 | 7,313 (RV) | ± 1% | 42% | 46% | – | 12% |
| NPR/PBS News/Marist College | Feb 13–16, 2020 | 1,164 (RV) | ± 3.7 % | 44% | 50% | 1% | 5% |
| Ipsos/Reuters | Feb 7–10, 2020 | 952 (RV) | ± 3.6 % | 42% | 44% | 11%[lower-alpha 153] | 4%[lower-alpha 154] |
| Quinnipiac University | Feb 5–9, 2020 | 1,519 (RV) | ± 2.5% | 43% | 50% | 5%[lower-alpha 155] | 2% |
| Morning Consult | Feb 4–9, 2020 | 36,180 (RV) | ± 1% | 42% | 45% | – | 13% |
| Atlas Intel | Jan 30 – Feb 2, 2020 | 1,600 (RV) | ± 2% | 45.4% | 45.8% | – | 8.8% |
| Morning Consult | Jan 27 – Feb 2, 2020 | 7,178 (RV) | ± 1% | 42% | 46% | – | 12% |
| IBD/TIPP[lower-alpha 156] | Jan 23–30, 2020 | 856 (RV) | – | 48% | 49% | 2%[lower-alpha 157] | 2% |
| NBC News/Wall Street Journal | Jan 26–29, 2020 | 1,000 (RV) | ± 3.1% | 44% | 50% | 4%[lower-alpha 158] | 2% |
| USC Dornlife/LA Times | Jan 15–28, 2020 | 4,869 (RV) | ± 2% | 40% | 49% | 6%[lower-alpha 159] | 5% |
| Morning Consult | Jan 20–26, 2020 | 8,399 (RV) | ± 1% | 41% | 47% | – | 13% |
| Emerson College | Jan 21–23, 2020 | 1,128 (RV) | ± 2.8% | 50% | 50% | – | – |
| ABC News/Washington Post | Jan 20–23, 2020 | 880 (RV) | ± 4% | 46% | 50% | 3%[lower-alpha 160] | 1% |
| Echelon Insights | Jan 20–23, 2020 | 1,000 (RV) | – | 41% | 49% | – | 10% |
| Fox News | Jan 19–22, 2020 | 1,005 (RV) | ± 3% | 41% | 50% | 8%[lower-alpha 161] | 2% |
| CNN/SSRS | Jan 16–19, 2020 | 1,051 (RV) | ± 3.6% | 44% | 53% | 1%[lower-alpha 162] | 1% |
| Morning Consult | Jan 15–19, 2020 | 5,944 (RV) | ± 1% | 41% | 46% | – | 13% |
| Zogby Analytics | Jan 15–16, 2020 | 882 (LV) | – | 46% | 46% | – | 8% |
| SurveyUSA | Jan 14–16, 2020 | 4,069 (RV) | ± 1.7% | 43% | 50% | – | 7% |
| Morning Consult | Jan 6–12, 2020 | 8,299 (RV) | ± 1% | 41% | 46% | – | 13% |
| IBD/TIPP | Jan 3–11, 2020 | 901 (RV) | ± 3.3% | 46% | 48% | 3%[lower-alpha 163] | 2% |
| Morning Consult | Dec 30, 2019 – Jan 5, 2020 | 8,436 (RV) | ± 1% | 40% | 46% | – | 14% |
| Meeting Street Insights | Dec 28–30, 2019 | 1,000 (RV) | – | 38% | 49% | – | – |
| Ipsos/Reuters | Dec 18–19, 2019 | 1,117 (A) | ± 3.3% | 35% | 39% | 17%[lower-alpha 164] | 9% |
| Ipsos/Reuters | Dec 18–19, 2019 | 1,108 (A) | ± 3.4% | 36% | 37% | 20%[lower-alpha 165] | 8% |
| Emerson College | Dec 15–17, 2019 | 1,222 (RV) | ± 2.7% | 48% | 52% | – | – |
| CNN/SSRS | Dec 12–15, 2019 | 1,005 (RV) | ± 3.7% | 44% | 49% | 1% | 3% |
| IBD/TIPP | Dec 6–14, 2019 | 905 (RV) | ± 3.3% | 45% | 50% | 3%[lower-alpha 166] | 2% |
| Fox News | Dec 8–11, 2019 | 1,000 (RV) | ± 3.0% | 41% | 48% | 2% | 4% |
| Quinnipiac | Dec 4–9, 2019 | 1,553 (RV) | ± 2.5% | 42% | 51% | 4%[lower-alpha 167] | 3% |
| Zogby Analytics | Dec 5, 2019 | 865 | ± 3.3% | 46% | 45% | – | – |
| SurveyUSA | Nov 20–21, 2019 | 3,850 (RV) | ± 1.7% | 39% | 52% | – | 9% |
| RealClear Opinion Research | Nov 15–21, 2019 | 2,055 (RV) | ± 2.38% | 39% | 51% | – | 10% |
| Emerson College | Nov 17–20, 2019 | 1,092 (RV) | ± 2.9% | 51% | 49% | – | – |
| Morning Consult | Nov 8, 2019 | 1,300 (RV) | ± 3% | 40% | 44% | – | 16% |
| YouGov/Hofstra University | Oct 25–31, 2019 | 1,500 (LV) | ± 3% | 48.5% | 51.5% | – | – |
| ABC/Washington Post | Oct 27–30, 2019 | 876 (RV) | ± 4% | 39% | 56% | 4% [lower-alpha 168] | 0% |
| FOX News | Oct 27–30, 2019 | 1,040 (RV) | ± 3% | 39% | 51% | 7%[lower-alpha 169] | 4% |
| IBD/TIPP | Oct 27–30, 2019 | 903 (A) | ± 3.3% | 41% | 51% | – | – |
| NBC News/Wall Street Journal | Oct 27–30, 2019 | 720 (RV) | ± 3.7% | 41% | 50% | 6%[lower-alpha 170] | 3% |
| Morning Consult/Politico | Oct 25–28, 2019 | 1,997 (RV) | ± 2% | 36% | 41% | – | 23% |
| Emerson College | Oct 18–21, 2019 | 1,000 | ± 3.0% | 49% | 51% | – | – |
| CNN/SSRS | Oct 17–20, 2019 | 892 | ± 4.0% | 43% | 53% | 2%[lower-alpha 171] | 1%[lower-alpha 172] |
| Ipsos/Reuters | Oct 17–18, 2019 | 945 | ± 3.6% | 38% | 47% | 9%[lower-alpha 173] | 6%[lower-alpha 174] |
| SurveyUSA | Oct 15–16, 2019 | 3,080 | ± 2.1% | 41% | 52% | – | 7% |
| Lord Ashcroft Polls | Oct 1–15, 2019 | 15,051 (A) | – | 41% | 59% | – | – |
| Fox News | Oct 6–8, 2019 | 1,003 | ± 3.0% | 40% | 50% | 5% | 2% |
| Quinnipiac University | Oct 4–7, 2019 | 1,483 | ± 3.1% | 40% | 51% | 2% | 4% |
| Zogby Analytics | Oct 1–3, 2019 | 887 | ± 3.3% | 47% | 45% | – | 8% |
| IBD/TIPP | Sep 26 – Oct 3, 2019 | 863 | ± 3.5% | 44% | 51% | 1% | 3% |
| HarrisX | Oct 1–2, 2019 | 1,000 (RV) | – | 35% | 44% | 11%[lower-alpha 175] | 10% |
| Ipsos/Reuters | Sep 26–30, 2019 | 1,917 | ± 2.6% | 36% | 43% | 11% | 8% |
| Rasmussen Reports | Sep 23–24, 2019 | 1,000 | ± 3.0% | 47% | 43% | – | – |
| Ipsos/Reuters | Sep 23–24, 2019 | 876 | ± 3.8% | 36% | 42% | 12% | 8% |
| Emerson College | Sep 21–23, 2019 | 1,019 | ± 3.0% | 49% | 50% | – | – |
| Zogby Analytics | Sep 16–17, 2019 | 1,004 | ± 3.1% | 44% | 49% | – | 8% |
| Fox News | Sep 15–17, 2019 | 1,008 | ± 3.0% | 38% | 52% | 5% | 2% |
| SurveyUSA | Sep 13–16, 2019 | 4,520 | ± 1.6% | 41% | 49% | – | 10% |
| Marquette University Law School | Sep 3–13, 2019 | 1,392 | – | 35% [lower-alpha 176] | 45%[lower-alpha 177] | 20%[lower-alpha 178] | –[lower-alpha 179] |
| ABC News/Washington Post | Sep 2–5, 2019 | 877 | ± 4.0% | 40% | 55% | – | 1% |
| IBD/TIPP | Aug 22–30, 2019 | 848 | ± 3.5% | 42% | 54% | 1% | 3% |
| Emerson College | Aug 24–26, 2019 | 1,458 | ± 2.5% | 46% | 54% | – | – |
| Quinnipiac University | Aug 21–26, 2019 | 1,422 | ± 3.1% | 38% | 54% | 1% | 4% |
| Morning Consult | Aug 16–18, 2019 | 1,998 | ± 2.0% | 35% | 42% | – | 23% |
| Fox News | Aug 11–13, 2019 | 1,013 | ± 3.0% | 38% | 50% | 5% | 4% |
| SurveyUSA | Aug 1–5, 2019 | 5,459 | ± 1.6% | 42% | 50% | – | 9% |
| IBD/TIPP | Jul 25 – Aug 1, 2019 | 856 | ± 3.5% | 41% | 54% | 1% | 3% |
| Emerson College | Jul 27–29, 2019 | 1,233 | ± 2.7% | 49% | 51% | – | – |
| HarrisX | Jul 25–26, 2019 | 1,000 (RV) | – | 39% | 42% | 11%[lower-alpha 180] | 8% |
| Fox News | Jul 21–23, 2019 | 1,004 | ± 3.0% | 39% | 49% | 5% | 5% |
| NBC News/Wall Street Journal | Jul 7–9, 2019 | 800 | ± 3.5% | 42% | 51% | 4% | 3% |
| Emerson College | Jul 6–8, 2019 | 1,100 | ± 2.9% | 47% | 53% | – | – |
| Rasmussen Reports | Jun 23 – Jul 2, 2019 | 4,500 | ± 1.5% | 44% | 48% | – | 7% |
| ABC News/Washington Post | Jun 28 – Jul 1, 2019 | 875 | ± 4.0% | 43% | 53% | – | 1% |
| Emerson College | Jun 21–24, 2019 | 1,096 | ± 2.9% | 45% | 55% | – | – |
| HarrisX | Jun 22–23, 2019 | 1,001 | ± 3.1% | 40% | 41% | 11%[lower-alpha 181] | 8% |
| Fox News | Jun 9–12, 2019 | 1,001 | ± 3.0% | 39% | 49% | 5% | 5% |
| Ipsos/Daily Beast | Jun 10–11, 2019 | 1,005 | ± 2.5% | 35% | 46% | – | 9% |
| Quinnipiac University | Jun 6–10, 2019 | 1,214 | ± 3.5% | 40% | 53% | 1% | 4% |
| Morning Consult | Jun 7–9, 2019 | 1,991 | ± 2.0% | 33% | 44% | – | 24% |
| Ipsos/Reuters | May 29 – Jun 5, 2019 | 3,851 | ± 1.8% | 36% | 50% | 7% | 5% |
| HarrisX | May 25–26, 2019 | 1,001 | ± 3.1% | 36% | 43% | 5% | 11% |
| Change Research | May 18–21, 2019 | 2,904 | ± 1.8% | 46% | 47% | 7% | – |
| Civiqs/Daily Kos | May 12–14, 2019 | 1,650 | ± 2.6% | 44% | 48% | – | 8% |
| Fox News | May 11–14, 2019 | 1,008 | ± 3.0% | 38% | 49% | 5% | 5% |
| Emerson College | May 10–13, 2019 | 1,006 | ± 3.0% | 46% | 54% | – | – |
| Zogby Analytics | May 2–9, 2019 | 903 | – | 39% | 49% | – | 12% |
| HarrisX | Apr 28–29, 2019 | 1,002 | ± 3.1% | 36% | 43% | 8% | 8% |
| CNN/SSRS | Apr 25–28, 2019 | 470 | ± 5.5% | 45% | 51% | <1% | 2% |
| HarrisX | Apr 25–26, 2019 | 1,000 | ± 3.1% | 37% | 43% | 5% | 15% |
| Morning Consult | Apr 19–21, 2019 | 1,992 | ± 2.0% | 34% | 42% | – | 19% |
| Emerson College | Apr 11–14, 2019 | 914 | ± 3.2% | 47% | 53% | – | – |
| Civiqs/Daily Kos | Apr 6–9, 2019 | 1,584 | ± 2.7% | 45% | 45% | – | 10% |
| HarrisX | Mar 31 – Apr 1, 2019 | 1,000 | ± 3.1% | 36% | 45% | 8% | 8% |
| Public Policy Polling | Mar 27–28, 2019 | 846 | ± 3.4% | 40% | 53% | – | 7% |
| Rasmussen Reports | Mar 17–28, 2019 | 5,000 | ± 1.5% | 44% | 49% | – | 7% |
| Fox News | Mar 17–20, 2019 | 1,002 | ± 3.0% | 40% | 47% | 4% | 5% |
| Emerson College | Mar 17–18, 2019 | 1,153 | ± 2.8% | 45% | 55% | – | – |
| HarrisX | Mar 17–18, 2019 | 1,001 | ± 3.1% | 33% | 44% | 8% | 10% |
| Civiqs/Daily Kos | Mar 9–12, 2019 | 1,622 | ± 2.6% | 43% | 48% | – | 9% |
| Change Research | Mar 8–10, 2019 | 4,049 | ± 2.5% | 46% | 51% | – | – |
| D-CYFOR | Feb 22–23, 2019 | 1,000 | ± 3.1% | 40% | 51% | – | 9% |
| Emerson College | Feb 14–16, 2019 | 1,000 | ± 3.0% | 45% | 55% | – | – |
| Change Research | Jan 31 – Feb 1, 2019 | 1,338 | ± 2.7% | 45% | 52% | – | – |
| Øptimus | Jan 30 – Feb 1, 2019 | 1,084 | ± 3.0% | 43% | 50% | – | 7% |
| Public Policy Polling | Jan 19–21, 2019 | 760 | ± 3.6% | 41% | 53% | – | 6% |
| HarrisX | Dec 16–17, 2018 | 1,001 | ± 3.1% | 36% | 42% | – | 22% |
| SurveyMonkey/Axios | Oct 24–29, 2018 | 3,064 | – | 44% | 53% | – | 3% |
| Morning Consult | Aug 16–18, 2018 | 1,974 | ± 2.0% | 31% | 43% | – | 26% |
| Morning Consult | Jul 26–30, 2018 | 1,993 | ± 2.0% | 37% | 44% | – | 19% |
| Public Policy Polling | Jun 8–10, 2018 | 679 | ± 3.8% | 39% | 53% | – | 8% |
| Zogby Analytics | May 10–12, 2018 | 881 | ± 3.2% | 38% | 48% | – | 14% |
| Public Policy Polling | Mar 23–25, 2018 | 846 | ± 3.4% | 39% | 56% | – | 6% |
| Public Policy Polling | Feb 9–11, 2018 | 687 | ± 3.7% | 42% | 51% | – | 7% |
| CNN/SSRS | Jan 14–18, 2018 | 913 | ± 3.8% | 40% | 57% | 1% | 1% |
| Zogby Analytics | Jan 12–15, 2018 | 847 | ± 3.4% | 38% | 53% | – | 9% |
| Public Policy Polling | Dec 11–12, 2017 | 862 | ± 3.3% | 40% | 54% | – | 6% |
| Morning Consult | Nov 9–11, 2017 | 1,993 | ± 2.0% | 35% | 46% | – | 20% |
| Public Policy Polling | Oct 27–29, 2017 | 572 | ± 4.1% | 38% | 56% | – | 6% |
| Zogby Analytics | Oct 19–25, 2017 | 1,514 | ± 2.5% | 41% | 50% | – | 9% |
| Emerson College | Oct 12–14, 2017 | 820 | ± 3.4% | 42% | 51% | – | 7% |
| Public Policy Polling | Sep 22–25, 2017 | 865 | ± 3.3% | 40% | 53% | – | 6% |
| Public Policy Polling | Aug 18–21, 2017 | 887 | ± 3.3% | 39% | 51% | – | 11% |
| Public Policy Polling | Jul 14–17, 2017 | 836 | ± 3.4% | 39% | 54% | – | 7% |
| Public Policy Polling | Jun 9–11, 2017 | 811 | ± 3.4% | 41% | 54% | – | 5% |
| Public Policy Polling | May 12–14, 2017 | 692 | ± 3.7% | 40% | 54% | – | 6% |
| Public Policy Polling | Apr 17–18, 2017 | 648 | ± 3.9% | 40% | 54% | – | 6% |
| Public Policy Polling | Mar 27–28, 2017 | 677 | ± 3.8% | 40% | 54% | – | 6% |
Four-way race
| Poll source | Date | Sample size |
Margin of error |
Donald Trump Republican |
Joe Biden Democratic |
Jo Jorgensen Libertarian |
Howie Hawkins Green |
Other | Undecided |
|---|---|---|---|---|---|---|---|---|---|
| Change Research/CNBC | Jun 12–14, 2020 | 1,250 (LV) | ± 2.77% | 41% | 51% | 3%[lower-alpha 182] | 2%[lower-alpha 183] | 0%[lower-alpha 184] | 3% |
| Redfield & Wilton Strategies | Jun 2–9, 2020 | 1,500 (LV) | – | 37% | 50% | 1% | <1% | 1% | 10% |
| Change Research/CNBC | May 29–31, 2020 | 1,457 (LV) | ± 2.567% | 41% | 48% | 3%[lower-alpha 185] | 3%[lower-alpha 186] | 1%[lower-alpha 187] | 4% |
| Change Research/CNBC | May 15–17, 2020 | 1,424 (LV) | ± 2.6% | 45% | 48% | 3%[lower-alpha 188] | 3%[lower-alpha 189] | 0%[lower-alpha 190] | 2% |
Donald Trump vs. former Democratic candidates
The following candidates are ordered by the date they withdrew or suspended their campaign.
Bernie Sanders
| Poll source | Date(s) administered |
Sample size[lower-alpha 2] |
Margin of error |
Donald Trump (R) |
Bernie Sanders (D) |
Other | Undecided |
|---|---|---|---|---|---|---|---|
| YouGov/Yahoo News | Apr 6–7, 2020 | 1,144 (RV) | – | 42% | 45% | 8%[lower-alpha 191] | 5% |
| YouGov/Economist | Apr 5–7, 2020 | 1,143 (RV) | ± 3.1 % | 42% | 48% | 5%[lower-alpha 192] | 4% |
| Morning Consult | Mar 30 – Apr 5, 2020 | 30,985 (RV) | ± 1% | 43% | 45% | – | 12% |
| Change Research | Apr 2–3, 2020 | 1,200 (LV) | – | 44% | 46% | 8%[lower-alpha 193] | 3% |
| IBD/TIPP | Mar 29 – Apr 1, 2020 | 980 (RV) | – | 42% | 43% | 7%[lower-alpha 194] | 7% |
| YouGov/Economist | Mar 29–31, 2020 | 1,185 (RV) | ± 3.2% | 44% | 45% | 6%[lower-alpha 195] | 5% |
| Selzer & Co./Grinnell College | Mar 27–30, 2020 | 777 (LV) | ± 3.5 % | 44% | 43% | 11%[lower-alpha 196] | 2% |
| Morning Consult | Mar 23–29, 2020 | 34,645 (RV) | ± 1% | 43% | 45% | – | 12% |
| YouGov/Economist | Mar 26–28, 2020 | 1,185 (RV) | ± 3.2 % | 44% | 45% | 4% | 5% |
| YouGov/Yahoo News | Mar 25–26, 2020 | 1,168 (RV) | – | 41% | 45% | 6%[lower-alpha 197] | 8% |
| Harvard-Harris | Mar 24–26, 2020 | 1,201 (RV) | – | 47% | 53% | – | – |
| YouGov/Economist | Mar 22–24, 2020 | 1,166 (RV) | ± 3.4 % | 44% | 46% | 6%[lower-alpha 198] | 5% |
| Echelon Insights | Mar 20–24, 2020 | 1,000 (RV) | – | 43% | 47% | – | 11% |
| Ipsos/Reuters | Mar 18–24, 2020 | 4,428 (A) | ± 1.7% | 37% | 40% | 17%[lower-alpha 199] | 8%[lower-alpha 200] |
| Lord Ashcroft Polls | Mar 10–24, 2020 | 10,357 (A) | – | 39% | 47% | 7%[lower-alpha 201] | 7% |
| Redfield & Whilton Strategies | Mar 23, 2020 | 1,500 (LV) | ± 2.57% | 41%[lower-alpha 202] | 49% | 3%[lower-alpha 203] | 7% |
| Morning Consult | Mar 16–22, 2020 | 36,272 (RV) | ± 1% | 42% | 46% | – | 12% |
| Emerson College | Mar 18–19, 2020 | 1,100 (RV) | ± 2.9 % | 47% | 53% | – | – |
| YouGov/Economist | Mar 15–17, 2020 | 1,129 (RV) | ± 3.5 % | 41% | 48% | 5%[lower-alpha 204] | 6% |
| Ipsos/Reuters | Mar 13–16, 2020 | 955 (RV) | ± 3.6 % | 39% | 45% | 9%[lower-alpha 205] | 6%[lower-alpha 206] |
| Morning Consult | Mar 11–15, 2020 | 9,979 (RV) | ± 1% | 42% | 47% | – | 11% |
| NBC News/Wall Street Journal | Mar 11–13, 2020 | 900 (RV) | ± 3.3 % | 45% | 49% | 4% | 2% |
| YouGov/Hofstra University | Mar 5–12, 2020 | 1,500 (LV) | ± 2.9 % | 50% | 50% | – | – |
| YouGov/Yahoo News | Mar 10–11, 2020 | 1,242 (RV) | – | 42% | 45% | 8%[lower-alpha 207] | 5% |
| Civiqs/Daily Kos | Mar 8–11, 2020 | 1,441 (RV) | ± 2.7 % | 46% | 49% | – | 5% |
| YouGov/Economist | Mar 8–10, 2020 | 1,191 (RV) | ± 2.9 % | 43% | 47% | 5%[lower-alpha 208] | 5% |
| Ipsos/Reuters | Mar 6–9, 2020 | 956 (RV) | ± 3.6% | 42% | 43% | 10%[lower-alpha 209] | 5%[lower-alpha 210] |
| Quinnipiac | Mar 5–8, 2020 | 1,261 (RV) | ± 2.8% | 42% | 49% | 5%[lower-alpha 211] | 4% |
| Morning Consult | Mar 5–8, 2020 | 6,112 (RV) | ± 1% | 41% | 47% | – | 12% |
| CNN/SSRS | Mar 4–7, 2020 | 1,084 (RV) | ± 3.5% | 45% | 52% | 2%[lower-alpha 212] | 1% |
| IBD/TIPP | Feb 20–29, 2020 | 839 (RV) | – | 47% | 49% | 2%[lower-alpha 213] | 2% |
| Harvard-Harris | Feb 26–28, 2020 | 643 (RV) | – | 46% | 54% | – | – |
| YouGov/Yahoo News | Feb 26–27, 2020 | 1,662 (RV) | – | 42% | 48% | 6%[lower-alpha 214] | 2% |
| Morning Consult | Feb 23–27, 2020 | 6,117 (RV) | ± 1% | 41% | 47% | – | 12% |
| Fox News | Feb 23–26, 2020 | 1,000 (RV) | ± 3.0 % | 42% | 49% | 5%[lower-alpha 215] | 4% |
| Rasmussen Reports | Feb 24–25, 2020 | 1,000 (LV) | ± 3.0 % | 50% | 43% | – | 7% |
| Ipsos/Reuters | Feb 19–25, 2020 | 3,809 (RV) | ± 1.8% | 40%[lower-alpha 216] | 47% | –[lower-alpha 217] | –[lower-alpha 218] |
| YouGov/CBS News | Feb 20–22, 2020 | 10,000 (RV) | ± 1.2 % | 44% | 47% | 4%[lower-alpha 219] | 4% |
| Saint Leo University | Feb 17–22, 2020 | 1,000 (A) | ± 3% | 37.2% | 49.1% | – | 13.7% |
| Emerson College | Feb 16–18, 2020 | 1,250 (RV) | ± 2.7 % | 49% | 51% | – | – |
| ABC News/Washington Post | Feb 14–17, 2020 | 913 (RV) | ± 4 % | 45% | 51% | 4%[lower-alpha 220] | 0% |
| NBC News/Wall Street Journal | Feb 14–17, 2020 | 900 (RV) | ± 3.3 % | 46% | 50% | – | – |
| Global Strategy Group/GBAO | Feb 14–17, 2020 | 600 (RV) | – | 42% | 50% | 4%[lower-alpha 221] | 5% |
| Ipsos/Reuters | Feb 14–17, 2020 | 947 (RV) | ± 3.6% | 40% | 43% | 11%[lower-alpha 222] | 6%[lower-alpha 223] |
| SurveyUSA | Feb 13–17, 2020 | 2,768 (RV) | ± 1.9 % | 45% | 50% | – | 5% |
| Morning Consult | Feb 12–17, 2020 | 7,313 (RV) | ± 1% | 42% | 46% | – | 12% |
| NPR/PBS News/Marist College | Feb 13–16, 2020 | 1,164 (RV) | ± 3.7 % | 45% | 48% | 1% | 5% |
| Ipsos/Reuters | Feb 6–10, 2020 | 952 (RV) | ± 3.6 % | 41% | 45% | 11%[lower-alpha 224] | 4%[lower-alpha 225] |
| Quinnipiac | Feb 5–9, 2020 | 1,159 (RV) | ± 2.5% | 43% | 51% | 3%[lower-alpha 226] | 3% |
| Morning Consult | Feb 4–9, 2020 | 36,180 (RV) | ± 1% | 43% | 45% | – | 12% |
| Atlas Intel | Jan 30 – Feb 2, 2020 | 1,600 (RV) | 2% | 44.9% | 47.2% | – | 7.9% |
| Morning Consult | Jan 27 – Feb 2, 2020 | 7,178 (RV) | ± 1% | 42% | 46% | – | 12% |
| IBD/TIPP[lower-alpha 227] | Jan 23–30, 2020 | 856 (RV) | – | 49% | 47% | 3%[lower-alpha 228] | 1% |
| NBC/WSJ | Jan 26–29, 2020 | 1,000 (RV) | ± 3.1% | 45% | 49% | 5%[lower-alpha 229] | 1% |
| USC Dornlife/LA Times | Jan 15–28, 2020 | 4,869 (RV) | ± 2% | 40% | 47% | 8%[lower-alpha 230] | 5% |
| Morning Consult | Jan 20–26, 2020 | 8,399 (RV) | ± 1% | 41% | 46% | – | 13% |
| Emerson College | Jan 21–23, 2020 | 1,128 (RV) | ± 2.8% | 49% | 51% | – | – |
| Echelon Insights | Jan 20–23, 2020 | 1,000 (RV) | – | 41% | 48% | – | 11% |
| ABC News/Washington Post | Jan 20–23, 2020 | 880 (RV) | ± 4% | 47% | 49% | 3%[lower-alpha 231] | 0% |
| Fox News | Jan 19–22, 2020 | 1,005 (RV) | ± 3% | 42% | 48% | 7%[lower-alpha 232] | 3% |
| CNN/SSRS | Jan 16–19, 2020 | 1,051 (RV) | ± 3.4% | 45% | 52% | 2%[lower-alpha 233] | 1% |
| Morning Consult | Jan 15–19, 2020 | 5,944 (RV) | ± 1% | 41% | 45% | – | 13% |
| Data for Progress/Lucid/Vox[upper-alpha 4] | Jan 9–19, 2020 | 1,606 (A)[lower-alpha 234][lower-alpha 235] | – | 41% | 47% | – | [lower-alpha 236] |
| 1,715 (A)[lower-alpha 237][lower-alpha 238] | – | 43% | 45% | – | [lower-alpha 239] | ||
| – [lower-alpha 240][lower-alpha 241] | – | 41% | 47% | – | [lower-alpha 242] | ||
| Zogby Analytics | Jan 15–16, 2020 | 882 (LV) | – | 47% | 45% | – | 9% |
| SurveyUSA | Jan 14–16, 2020 | 4,069 (RV) | ± 1.7% | 43% | 52% | – | 5% |
| Morning Consult | Jan 6–12, 2020 | 8,299 (RV) | ± 1% | 42% | 46% | – | 13% |
| IBD/TIPP | Jan 3–11, 2020 | 901 (RV) | ± 3.3% | 47% | 48% | 3%[lower-alpha 243] | 2% |
| Morning Consult | Dec 30, 2019 – Jan 5, 2020 | 8,436 (RV) | ± 1% | 42% | 44% | – | 14% |
| Ipsos/Reuters | Dec 18–19, 2019 | 1,117 (A) | ± 3.3% | 36% | 40% | 15%[lower-alpha 244] | 9% |
| Ipsos/Reuters | Dec 18–19, 2019 | 1,108 (A) | ± 3.4% | 37% | 39% | 18%[lower-alpha 245] | 7% |
| Emerson College | Dec 15–17, 2019 | 1,222 (RV) | ± 2.7% | 48% | 52% | – | – |
| CNN/ORC | Dec 12–15, 2019 | 1,005 (RV) | ± 3.7% | 45% | 49% | 0% | 2% |
| IBD/TIPP | Dec 6–14, 2019 | 905 (RV) | ± 3.3% | 48% | 47% | 4%[lower-alpha 246] | 1% |
| Fox News | Dec 8–11, 2019 | 1,000 (RV) | ± 3.0% | 43% | 49% | 2% | 3% |
| Quinnipiac | Dec 4–9, 2019 | 1,553 (RV) | ± 2.5% | 43% | 51% | 4%[lower-alpha 247] | 3% |
| Zogby Analytics | Dec 5, 2019 | 865 | ± 3.3% | 47% | 45% | – | – |
| SurveyUSA | Nov 20–21, 2019 | 3,850 (RV) | ± 1.7% | 40% | 52% | – | 8% |
| RealClear Opinion Research | Nov 15–21, 2019 | 2,055 (RV) | ± 2.38% | 40% | 52% | – | 8% |
| Emerson College | Nov 17–20, 2019 | 1,092 (RV) | ± 2.9% | 49% | 50% | – | – |
| Morning Consult | Nov 8, 2019 | 1,300 (RV) | ± 3% | 40% | 45% | – | 16% |
| YouGov/Hofstra University | Oct 25–31, 2019 | 1,500 (LV) | ± 3% | 48.8% | 51.2% | – | – |
| ABC/Washington Post | Oct 27–30, 2019 | 876 (RV) | ± 4% | 41% | 55% | 3% [lower-alpha 248] | 0% |
| FOX News | Oct 27–30, 2019 | 1,040 (RV) | ± 3% | 41% | 49% | 6%[lower-alpha 249] | 4% |
| IBD/TIPP | Oct 27–30, 2019 | 903 (A) | ± 3.3% | 44% | 51% | – | – |
| Morning Consult/Politico | Oct 25–28, 2019 | 1,997 (RV) | ± 2% | 37% | 39% | – | 25% |
| Emerson College | Oct 18–21, 2019 | 1000 (RV) | ± 3% | 49% | 51% | – | – |
| CNN/SSRS | Oct 17–20, 2019 | 892 | ± 4.0% | 43% | 52% | 3%[lower-alpha 250] | 2%[lower-alpha 251] |
| Ipsos/Reuters | Oct 17–18, 2019 | 945 (RV) | ± 3.6% | 39% | 44% | 13%[lower-alpha 252] | 7%[lower-alpha 253] |
| SurveyUSA | Oct 15–16, 2019 | 3,080 (RV) | ± 2.1% | 42% | 50% | – | 8% |
| Lord Ashcroft Polls | Oct 1–15, 2019 | 15,051 (A) | – | 41% | 59% | – | – |
| Fox News | Oct 6–8, 2019 | 1,003 | ± 3.0% | 40% | 49% | 6% | 2% |
| Quinnipiac University | Oct 4–7, 2019 | 1,483 | ± 3.1% | 42% | 49% | 2% | 4% |
| Zogby Analytics | Oct 1–3, 2019 | 887 (LV) | ± 3.3% | 46% | 44% | – | 10% |
| IBD/TIPP | Sep 26 – Oct 3, 2019 | 863 | ± 3.5% | 45% | 49% | 2% | 3% |
| HarrisX | Oct 1–2, 2019 | 1,000 (RV) | – | 37% | 38% | 15%[lower-alpha 254] | 9% |
| Ipsos/Reuters | Sep 26–30, 2019 | 1,917 | ± 2.6% | 36% | 43% | 11% | 7% |
| Ipsos/Reuters | Sep 23–24, 2019 | 876 | ± 3.8% | 39% | 38% | 13% | 8% |
| Emerson College | Sep 21–23, 2019 | 1,019 | ± 3.0% | 51% | 49% | – | – |
| Fox News | Sep 15–17, 2019 | 1,008 | ± 3.0% | 40% | 48% | 6% | 2% |
| SurveyUSA | Sep 13–16, 2019 | 4,520 | ± 1.6% | 43% | 48% | – | 9% |
| ABC News/Washington Post | Sep 2–5, 2019 | 877 | ± 4.0% | 43% | 52% | – | 1% |
| IBD/TIPP | Aug 22–30, 2019 | 848 | – | 45% | 49% | 2% | 3% |
| Emerson College | Aug 24–26, 2019 | 1,458 | ± 2.5% | 48% | 52% | – | – |
| Quinnipiac University | Aug 21–26, 2019 | 1,422 | ± 3.1% | 39% | 53% | 1% | 4% |
| Morning Consult | Aug 16–18, 2019 | 1,998 | ± 2.0% | 35% | 40% | – | 25% |
| Fox News | Aug 11–13, 2019 | 1,013 | ± 3.0% | 39% | 48% | 7% | 5% |
| SurveyUSA | Aug 1–5, 2019 | 5,459 | ± 1.6% | 42% | 50% | – | 8% |
| IBD/TIPP | Jul 25 – Aug 1, 2019 | 856 | – | 45% | 50% | 2% | 2% |
| Rasmussen Reports | Jul 21 – Aug 1, 2019 | 5,000 | ± 1.5% | 45% | 46% | – | 9% |
| Emerson College | Jul 27–29, 2019 | 1,233 | ± 2.7% | 49% | 51% | – | – |
| HarrisX | Jul 25–26, 2019 | 1,000 (RV) | – | 38% | 39% | 15%[lower-alpha 255] | 8% |
| Fox News | Jul 21–23, 2019 | 1,004 | ± 3.0% | 40% | 46% | 6% | 5% |
| NBC News/Wall Street Journal | Jul 7–9, 2019 | 800 | ± 3.5% | 43% | 50% | 4% | 3% |
| Emerson College | Jul 6–8, 2019 | 1,100 | ± 2.9% | 49% | 51% | – | – |
| ABC News/Washington Post | Jun 28 – Jul 1, 2019 | 875 | ± 4.0% | 48% | 49% | 0% | 1% |
| Emerson College | Jun 21–24, 2019 | 1,096 | ± 2.9% | 45% | 55% | – | – |
| HarrisX | Jun 22–23, 2019 | 1,001 | ± 3.1% | 40% | 39% | 13%[lower-alpha 256] | 8% |
| Fox News | Jun 9–12, 2019 | 1,001 | ± 3.0% | 40% | 49% | 5% | 5% |
| Ipsos/Daily Beast | Jun 10–11, 2019 | 1,005 | ± 2.5% | 35% | 47% | – | 10% |
| Quinnipiac University | Jun 6–10, 2019 | 1,214 | ± 3.5% | 42% | 51% | 1% | 4% |
| Morning Consult | Jun 7–9, 2019 | 1,991 | ± 2.0% | 32% | 42% | – | 26% |
| Ipsos/Reuters | May 29 – Jun 5, 2019 | 3,851 | ± 1.8% | 37% | 46% | 10% | 5% |
| HarrisX | May 25–26, 2019 | 1,001 | ± 3.1% | 38% | 38% | 11% | 8% |
| Change Research | May 18–21, 2019 | 2,904 | ± 1.8% | 46% | 47% | 6% | – |
| Fox News | May 11–14, 2019 | 1,008 | ± 3.0% | 41% | 46% | 5% | 5% |
| Emerson College | May 10–13, 2019 | 1,006 | ± 3.0% | 46% | 54% | – | – |
| Zogby Analytics | May 2–9, 2019 | 903 | – | 40% | 49% | – | 12% |
| HarrisX | Apr 28–29, 2019 | 1,002 | ± 3.1% | 38% | 37% | 11% | 8% |
| CNN/SSRS | Apr 25–28, 2019 | 456 | ± 5.6% | 44% | 50% | 0% | 2% |
| Emerson College | Apr 11–14, 2019 | 914 | ± 3.2% | 48% | 52% | – | – |
| Rasmussen Reports | Mar 31 – Apr 11, 2019 | 5,000 | ± 1.5% | 47% | 44% | – | 9% |
| Civiqs/Daily Kos | Apr 6–9, 2019 | 1,584 | ± 2.7% | 44% | 45% | – | 11% |
| HarrisX | Mar 31 – Apr 1, 2019 | 1,000 | ± 3.1% | 38% | 41% | 9% | 7% |
| Public Policy Polling | Mar 27–28, 2019 | 846 | ± 3.4% | 41% | 49% | – | 9% |
| Fox News | Mar 17–20, 2019 | 1,002 | ± 3.0% | 41% | 44% | 6% | 5% |
| Emerson College | Mar 17–18, 2019 | 1,153 | ± 2.8% | 49% | 51% | – | – |
| HarrisX | Mar 17–18, 2019 | 1,001 | ± 3.1% | 35% | 40% | 11% | 8% |
| Civiqs/Daily Kos | Mar 9–12, 2019 | 1,622 | ± 2.6% | 44% | 46% | – | 10% |
| Change Research | Mar 8–10, 2019 | 4,049 | ± 2.5% | 46% | 50% | – | – |
| D-CYFOR | Feb 22–23, 2019 | 1,000 | ± 3.1% | 41% | 50% | – | 9% |
| Emerson College | Feb 14–16, 2019 | 1,000 | ± 3.0% | 49% | 51% | – | – |
| Change Research | Jan 31 – Feb 1, 2019 | 1,338 | ± 2.7% | 46% | 48% | – | – |
| Public Policy Polling | Jan 19–21, 2019 | 760 | ± 3.6% | 41% | 51% | – | 8% |
| HarrisX | Dec 16–17, 2018 | 1,001 | ± 3.1% | 37% | 38% | – | 24% |
| Morning Consult | Aug 16–18, 2018 | 1,974 | ± 2.0% | 32% | 44% | – | 24% |
| Public Policy Polling | Jun 8–10, 2018 | 679 | ± 3.8% | 40% | 49% | – | 11% |
| Zogby Analytics | May 10–12, 2018 | 881 | ± 3.2% | 37% | 48% | – | 15% |
| Public Policy Polling | Mar 23–25, 2018 | 846 | ± 3.4% | 39% | 55% | – | 6% |
| Public Policy Polling | Feb 9–11, 2018 | 687 | ± 3.7% | 44% | 48% | – | 8% |
| CNN/SSRS | Jan 14–18, 2018 | 913 | ± 3.8% | 42% | 55% | 1% | 1% |
| Zogby Analytics | Jan 12–15, 2018 | 847 | ± 3.4% | 39% | 52% | – | 10% |
| YouGov | Jan 9, 2018 | 865 | – | 43% | 48% | – | – |
| Public Policy Polling | Dec 11–12, 2017 | 862 | ± 3.3% | 40% | 53% | – | 6% |
| Morning Consult | Nov 16–19, 2017 | 2,586 | ± 2.0% | 36% | 42% | – | 22% |
| Public Policy Polling | Oct 27–29, 2017 | 572 | ± 4.1% | 38% | 53% | – | 9% |
| Zogby Analytics | Oct 19–25, 2017 | 1,514 | ± 2.5% | 40% | 51% | – | 9% |
| Public Policy Polling | Sep 22–25, 2017 | 865 | ± 3.3% | 40% | 51% | – | 9% |
| Public Policy Polling | Aug 18–21, 2017 | 887 | ± 3.3% | 38% | 51% | – | 11% |
| Public Policy Polling | Jul 14–17, 2017 | 836 | ± 3.4% | 39% | 52% | – | 9% |
| Public Policy Polling | Jun 9–11, 2017 | 811 | ± 3.4% | 41% | 51% | – | 8% |
| Public Policy Polling | May 12–14, 2017 | 692 | ± 3.7% | 39% | 52% | – | 9% |
| Public Policy Polling | Apr 17–18, 2017 | 648 | ± 3.9% | 41% | 50% | – | 8% |
| Public Policy Polling | Mar 27–28, 2017 | 677 | ± 3.8% | 41% | 52% | – | 7% |
Tulsi Gabbard
| Poll source | Date(s) administered |
Sample size[lower-alpha 2] |
Margin of error |
Donald Trump (R) |
Tulsi Gabbard (D) |
Other | Undecided |
|---|---|---|---|---|---|---|---|
| SurveyUSA | Jan 14–16, 2020 | 4,069 (RV) | ± 1.7% | 44% | 39% | – | 17% |
| HarrisX | Aug 23–24, 2019 | 1,001 (RV) | – | 38% | 33% | 17%[lower-alpha 257] | 12% |
| HarrisX | Jul 26–27, 2019 | 1,001 (RV) | – | 37% | 27% | 22%[lower-alpha 258] | 13% |
| HarrisX | Jun 23–24, 2019 | 1,001 | ± 3.1% | 38% | 25% | 24%[lower-alpha 259] | 14% |
| HarrisX | May 26–27, 2019 | 1,003 | ± 3.1% | 38% | 26% | 17% | 13% |
| HarrisX | Apr 30 – May 1, 2019 | 1,000 | ± 3.1% | 39% | 24% | 18% | 12% |
| HarrisX | Apr 3–4, 2019 | 1,002 | ± 3.1% | 38% | 25% | 14% | 16% |
| HarrisX | Mar 19–20, 2019 | 1,001 | ± 3.1% | 35% | 27% | 14% | 16% |
Elizabeth Warren
| Poll source | Date(s) administered |
Sample size[lower-alpha 2] |
Margin of error |
Donald Trump (R) |
Elizabeth Warren (D) |
Other | Undecided |
|---|---|---|---|---|---|---|---|
| IBD/TIPP | Feb 20–29, 2020 | 839 (RV) | – | 46% | 48% | 3%[lower-alpha 260] | 3% |
| Harvard-Harris | Feb 26–28, 2020 | 644 (RV) | – | 49% | 51% | – | – |
| YouGov/Yahoo News | Feb 26–27, 2020 | 1,662 (RV) | – | 43% | 47% | 6%[lower-alpha 261] | 4% |
| Morning Consult | Feb 23–27, 2020 | 6,117 (RV) | ± 1% | 43% | 42% | – | 14% |
| Fox News | Feb 23–26, 2020 | 1,000 (RV) | ± 3.0 % | 43% | 46% | 7%[lower-alpha 262] | 4% |
| Ipsos/Reuters | Feb 19–25, 2020 | 3,809 (RV) | ± 1.8% | 41%[lower-alpha 263] | 44% | –[lower-alpha 264] | –[lower-alpha 265] |
| YouGov/CBS News | Feb 20–22, 2020 | 10,000 (RV) | ± 1.2 % | 45% | 46% | 4%[lower-alpha 266] | 4% |
| Saint Leo University | Feb 17–22, 2020 | 1,000 (A) | ± 3% | 40.6% | 42.7% | – | 16.7% |
| ABC News/Washington Post | Feb 14–17, 2020 | 913 (RV) | ± 4% | 47% | 48% | 3%[lower-alpha 267] | 0% |
| Ipsos/Reuters | Feb 14–17, 2020 | 947 (RV) | ± 3.6% | 41% | 40% | 13%[lower-alpha 268] | 6%[lower-alpha 269] |
| SurveyUSA | Feb 13–17, 2020 | 2,768 (RV) | ± 1.9 % | 47% | 46% | – | 7% |
| Morning Consult | Feb 12–17, 2020 | 7,313 (RV) | ± 1% | 42% | 44% | – | 14% |
| NPR/PBS News/Marist College | Feb 13–16, 2020 | 1,164 (RV) | ± 3.7 % | 46% | 47% | 2% | 5% |
| Ipsos/Reuters | Feb 6–10, 2020 | 952 (RV) | ±3.6% | 42% | 42% | 10%[lower-alpha 270] | 4%[lower-alpha 271] |
| Quinnipiac | Feb 5–9, 2020 | 1,159 (RV) | ± 2.5% | 44% | 48% | 4%[lower-alpha 272] | 3% |
| Morning Consult | Feb 4–9, 2020 | 36,180 (RV) | ± 1% | 43% | 43% | – | 14% |
| Atlas Intel | Jan 30 – Feb 2, 2020 | 1,600 (RV) | 2% | 45.7% | 42.5% | – | 11.8% |
| Morning Consult | Jan 27 – Feb 2, 2020 | 7,178 (RV) | ± 1% | 42% | 43% | – | 15% |
| IBD/TIPP[lower-alpha 273] | Jan 23–30, 2020 | 856 (RV) | – | 50% | 46% | 4%[lower-alpha 274] | 1% |
| NBC/WSJ | Jan 26–29, 2020 | 1,000 (RV) | ± 3.1% | 45% | 48% | 5%[lower-alpha 275] | 2% |
| USC Dornlife/LA Times | Jan 15–28, 2020 | 4,869 (RV) | ± 2% | 41% | 45% | 9%[lower-alpha 276] | 6% |
| Morning Consult | Jan 20–26, 2020 | 8,399 (RV) | ± 1% | 43% | 43% | – | 14% |
| Emerson College | Jan 21–23, 2020 | 1,128 (RV) | ± 2.8% | 50% | 50% | – | – |
| ABC News/Washington Post | Jan 20–23, 2020 | 880 (RV) | ± 4% | 48% | 48% | 4%[lower-alpha 277] | 0% |
| Fox News | Jan 19–22, 2020 | 1,005 (RV) | ± 3% | 42% | 47% | 9%[lower-alpha 278] | 3% |
| CNN/SSRS | Jan 16–19, 2020 | 1,051 (RV) | ± 3.4% | 45% | 50% | 3%[lower-alpha 279] | 2% |
| Morning Consult | Jan 15–19, 2020 | 5,944 (RV) | ± 1% | 42% | 44% | – | 14% |
| Zogby Analytics | Jan 15–16, 2020 | 882 (LV) | – | 47% | 42% | – | 10% |
| SurveyUSA | Jan 14–16, 2020 | 4,069 (RV) | ± 1.7% | 45% | 48% | – | 6% |
| Morning Consult | Jan 6–12, 2020 | 8,299 (RV) | ± 1% | 41% | 43% | – | 15% |
| IBD/TIPP | Jan 3–11, 2020 | 901 (RV) | ± 3.3% | 47% | 46% | 4%[lower-alpha 280] | 2% |
| Morning Consult | Dec 30, 2019 – Jan 5, 2020 | 8,436 (RV) | ± 1% | 42% | 41% | – | 16% |
| Ipsos/Reuters | Dec 18–19, 2019 | 1,117 (A) | ± 3.3% | 35% | 39% | 17%[lower-alpha 281] | 9% |
| Ipsos/Reuters | Dec 18–19, 2019 | 1,108 (A) | ± 3.4% | 38% | 36% | 20%[lower-alpha 282] | 7% |
| Emerson College | Dec 15–17, 2019 | 1,222 (RV) | ± 2.7% | 49% | 51% | – | – |
| CNN/ORC | Dec 12–15, 2019 | 1,005 (RV) | ± 3.7% | 46% | 47% | 1% | 3% |
| IBD/TIPP | Dec 6–14, 2019 | 905 (RV) | ± 3.3% | 49% | 44% | 2%[lower-alpha 283] | 2% |
| Fox News | Dec 8–11, 2019 | 1,000 (RV) | ± 3.0% | 45% | 46% | 2% | 3% |
| Quinnipiac | Dec 4–9, 2019 | 1,553 (RV) | ± 2.5% | 43% | 50% | 4%[lower-alpha 284] | 3% |
| Zogby Analytics | Dec 5, 2019 | 865 | ± 3.3% | 47% | 43% | – | – |
| SurveyUSA | Nov 20–21, 2019 | 3,850 (RV) | ± 1.7% | 42% | 49% | – | 9% |
| RealClear Opinion Research | Nov 15–21, 2019 | 2,055 (RV) | ± 2.38% | 41% | 50% | – | 10% |
| Emerson College | Nov 17–20, 2019 | 1,092 (RV) | ± 2.9% | 50% | 50% | – | – |
| Morning Consult | Nov 8, 2019 | 1,300 (RV) | ± 3% | 39% | 45% | – | 15% |
| YouGov/Hofstra University | Oct 25–31, 2019 | 1,500 (LV) | ± 3% | 50% | 50% | – | – |
| ABC/Washington Post | Oct 27–30, 2019 | 876 (RV) | ± 4% | 40% | 55% | 4% [lower-alpha 285] | 1% |
| FOX News | Oct 27–30, 2019 | 1,040 (RV) | ± 3% | 41% | 46% | 9%[lower-alpha 286] | 4% |
| IBD/TIPP | Oct 27–30, 2019 | 903 (A) | ± 3.3% | 44% | 52% | – | – |
| NBC News/Wall Street Journal | Oct 27–30, 2019 | 720 (RV) | ± 3.7% | 42% | 50% | 3%[lower-alpha 287] | 3% |
| Morning Consult/Politico | Oct 25–28, 2019 | 1,997 (RV) | ± 2% | 36% | 35% | – | 28% |
| Emerson College | Oct 18–21, 2019 | 1000 (RV) | ± 3% | 49% | 51% | – | – |
| Ipsos/Reuters | Oct 17–18, 2019 | 945 (RV) | ± 3.6% | 40% | 43% | 11%[lower-alpha 288] | 6%[lower-alpha 289] |
| CNN/SSRS | Oct 17–20, 2019 | 892 | ± 4.0% | 44% | 52% | 3%[lower-alpha 290] | 1%[lower-alpha 291] |
| SurveyUSA | Oct 15–16, 2019 | 3,080 (RV) | ± 2.1% | 44% | 48% | – | 8% |
| Lord Ashcroft Polls | Oct 1–15, 2019 | 15,051 (A) | – | 43% | 57% | – | – |
| Fox News | Oct 6–8, 2019 | 1,003 | ± 3.0% | 40% | 50% | 4% | 4% |
| Quinnipiac University | Oct 4–7, 2019 | 1,483 | ± 3.1% | 41% | 49% | 2% | 4% |
| Zogby Analytics | Oct 1–3, 2019 | 887 (LV) | ± 3.3% | 45% | 45% | – | 10% |
| IBD/TIPP | Sep 26 – Oct 3, 2019 | 863 | ± 3.5% | 46% | 48% | 2% | 3% |
| HarrisX | Oct 1–2, 2019 | 1000 (RV) | – | 37% | 37% | 15%[lower-alpha 292] | 10% |
| Ipsos/Reuters | Sep 26–30, 2019 | 1,917 | ± 2.6% | 37% | 42% | 10% | 8% |
| Ipsos/Reuters | Sep 23–24, 2019 | 876 | ± 3.8% | 39% | 41% | 10% | 8% |
| Emerson College | Sep 21–23, 2019 | 1,019 | ± 3.0% | 49% | 51% | – | – |
| Fox News | Sep 15–17, 2019 | 1,008 | ± 3.0% | 40% | 46% | 7% | 3% |
| SurveyUSA | Sep 13–16, 2019 | 4,520 | ± 1.6% | 43% | 45% | – | 12% |
| Marquette University Law School | Sep 3–13, 2019 | 1,389 (RV) | – | 36% [lower-alpha 293] | 41%[lower-alpha 294] | 24%[lower-alpha 295] | –[lower-alpha 296] |
| ABC News/Washington Post | Sep 2–5, 2019 | 877 | ± 4.0% | 44% | 51% | – | 2% |
| IBD/TIPP | Aug 22–30, 2019 | 848 | – | 46% | 49% | 1% | 3% |
| Emerson College | Aug 24–26, 2019 | 1,458 | ± 2.5% | 50% | 50% | – | – |
| Quinnipiac University | Aug 21–26, 2019 | 1,422 | ± 3.1% | 40% | 52% | 1% | 4% |
| Morning Consult | Aug 16–18, 2019 | 1,998 | ± 2.0% | 35% | 35% | – | 30% |
| Fox News | Aug 11–13, 2019 | 1,013 | ± 3.0% | 39% | 46% | 7% | 6% |
| SurveyUSA | Aug 1–5, 2019 | 5,459 | ± 1.6% | 44% | 46% | – | 10% |
| IBD/TIPP | Jul 25 – Aug 1, 2019 | 856 | – | 45% | 49% | 2% | 4% |
| Emerson College | Jul 27–29, 2019 | 1,233 | ± 2.7% | 50% | 50% | – | – |
| HarrisX | Jul 25–26, 2019 | 1,000 (RV) | – | 40% | 36% | 15%[lower-alpha 297] | 9% |
| Fox News | Jul 21–23, 2019 | 1,004 | ± 3.0% | 42% | 41% | 7% | 7% |
| NBC News/Wall Street Journal | Jul 7–9, 2019 | 800 | ± 3.5% | 43% | 48% | 4% | 4% |
| Emerson College | Jul 6–8, 2019 | 1,100 | ± 2.9% | 51% | 49% | – | – |
| ABC News/Washington Post | Jun 28 – Jul 1, 2019 | 875 | ± 4.0% | 48% | 48% | 1% | 1% |
| Emerson College | Jun 21–24, 2019 | 1,096 | ± 2.9% | 47% | 53% | – | – |
| HarrisX | Jun 22–23, 2019 | 1,001 | ± 3.1% | 41% | 33% | 16%[lower-alpha 298] | 10% |
| Fox News | Jun 9–12, 2019 | 1,001 | ± 3.0% | 41% | 43% | 6% | 6% |
| Ipsos/Daily Beast | Jun 10–11, 2019 | 1,005 | ± 2.5% | 36% | 42% | – | 12% |
| Quinnipiac University | Jun 6–10, 2019 | 1,214 | ± 3.5% | 42% | 49% | 1% | 5% |
| Morning Consult | Jun 7–9, 2019 | 1,991 | ± 2.0% | 33% | 32% | – | 35% |
| Ipsos/Reuters | May 29 – Jun 5, 2019 | 3,851 | ± 1.8% | 38% | 43% | 11% | 5% |
| HarrisX | May 25–26, 2019 | 1,001 | ± 3.1% | 40% | 33% | 11% | 10% |
| Rasmussen Reports | May 12–23, 2019 | 5,000 | ± 1.5% | 44% | 46% | – | 10% |
| Change Research | May 18–21, 2019 | 2,904 | ± 1.8% | 46% | 47% | 6% | – |
| Civiqs/Daily Kos | May 12–14, 2019 | 1,650 | ± 2.6% | 45% | 48% | – | 7% |
| Fox News | May 11–14, 2019 | 1,008 | ± 3.0% | 41% | 43% | 6% | 6% |
| Emerson College | May 10–13, 2019 | 1,006 | ± 3.0% | 48% | 51% | – | – |
| Zogby Analytics | May 2–9, 2019 | 903 | – | 41% | 43% | – | 16% |
| HarrisX | Apr 28–29, 2019 | 1,002 | ± 3.1% | 39% | 33% | 13% | 9% |
| CNN/SSRS | Apr 25–28, 2019 | 452 | ± 5.6% | 48% | 47% | 0% | 3% |
| Emerson College | Apr 11–14, 2019 | 914 | ± 3.2% | 52% | 48% | – | – |
| Civiqs/Daily Kos | Apr 6–9, 2019 | 1,584 | ± 2.7% | 45% | 43% | – | 12% |
| HarrisX | Mar 31 – Apr 1, 2019 | 1,000 | ± 3.1% | 39% | 35% | 12% | 11% |
| Public Policy Polling | Mar 27–28, 2019 | 846 | ± 3.4% | 42% | 48% | – | 10% |
| Fox News | Mar 17–20, 2019 | 1,002 | ± 3.0% | 42% | 40% | 7% | 8% |
| Emerson College | Mar 17–18, 2019 | 1,153 | ± 2.8% | 49% | 51% | – | – |
| HarrisX | Mar 17–18, 2019 | 1,001 | ± 3.1% | 37% | 34% | 12% | 12% |
| Civiqs/Daily Kos | Mar 9–12, 2019 | 1,622 | ± 2.6% | 44% | 44% | – | 11% |
| Change Research | Mar 8–10, 2019 | 4,049 | ± 2.5% | 47% | 49% | – | – |
| D-CYFOR | Feb 22–23, 2019 | 1,000 | ± 3.1% | 42% | 45% | – | 13% |
| Emerson College | Feb 14–16, 2019 | 1,000 | ± 3.0% | 47% | 53% | – | – |
| Change Research | Jan 31 – Feb 1, 2019 | 1,338 | ± 2.7% | 46% | 47% | – | – |
| Public Policy Polling | Jan 19–21, 2019 | 760 | ± 3.6% | 42% | 48% | – | 10% |
| SurveyMonkey/Axios | Oct 24–29, 2018 | 3,064 | – | 47% | 49% | – | 4% |
| Rasmussen Reports | Oct 17–18, 2018 | 1,000 | ± 3.0% | 44% | 46% | – | 9% |
| Morning Consult | Aug 16–18, 2018 | 1,974 | ± 2.0% | 30% | 34% | – | 36% |
| Public Policy Polling | Jun 8–10, 2018 | 679 | ± 3.8% | 40% | 48% | – | 12% |
| Zogby Analytics | May 10–12, 2018 | 881 | ± 3.2% | 37% | 43% | – | 20% |
| Public Policy Polling | Mar 23–25, 2018 | 846 | ± 3.4% | 40% | 51% | – | 9% |
| Public Policy Polling | Feb 9–11, 2018 | 687 | ± 3.7% | 44% | 44% | – | 12% |
| Zogby Analytics | Jan 12–15, 2018 | 847 | ± 3.4% | 40% | 50% | – | 10% |
| Public Policy Polling (D)[upper-alpha 5] | Jan 9–10, 2018 | 620 | ± 3.9% | 43% | 49% | – | 8% |
| Public Policy Polling | Dec 11–12, 2017 | 862 | ± 3.3% | 42% | 51% | – | 7% |
| Public Policy Polling | Oct 27–29, 2017 | 572 | ± 4.1% | 40% | 50% | – | 9% |
| Zogby Analytics | Oct 19–25, 2017 | 1,514 | ± 2.5% | 43% | 45% | – | 13% |
| Emerson College | Oct 12–14, 2017 | 820 | ± 3.4% | 44% | 44% | – | 12% |
| GQR Research | Sep 3 – Oct 6, 2017 | 1,000 | – | 42% | 54% | 1% | 2% |
| Public Policy Polling | Sep 22–25, 2017 | 865 | ± 3.3% | 41% | 47% | – | 12% |
| Public Policy Polling | Aug 18–21, 2017 | 887 | ± 3.3% | 40% | 45% | – | 15% |
| Zogby Analytics | Aug 4–7, 2017 | 1,300 | – | 37% | 46% | – | 17% |
| Public Policy Polling | Jul 14–17, 2017 | 836 | ± 3.4% | 42% | 49% | – | 9% |
| Public Policy Polling | Jun 9–11, 2017 | 811 | ± 3.4% | 43% | 46% | – | 11% |
| Public Policy Polling | May 12–14, 2017 | 692 | ± 3.7% | 39% | 49% | – | 12% |
| Public Policy Polling | Apr 17–18, 2017 | 648 | ± 3.9% | 42% | 46% | – | 13% |
| Public Policy Polling | Mar 27–28, 2017 | 677 | ± 3.8% | 43% | 48% | – | 9% |
| Morning Consult | Feb 9–10, 2017 | 1,791 | ± 2.0% | 42% | 36% | – | 22% |
Michael Bloomberg
| Poll source | Date(s) administered |
Sample size[lower-alpha 2] |
Margin of error |
Donald Trump (R) |
Michael Bloomberg (D) |
Other | Undecided |
|---|---|---|---|---|---|---|---|
| IBD/TIPP | Feb 20–29, 2020 | 839 (RV) | – | 45% | 48% | 3%[lower-alpha 299] | 3% |
| Harvard-Harris | Feb 26–28, 2020 | 654 (RV) | – | 45% | 55% | – | – |
| Morning Consult | Feb 23–27, 2020 | 6,117 (RV) | ± 1% | 42% | 43% | – | 15% |
| YouGov/Yahoo News | Feb 26–27, 2020 | 1,662 (RV) | – | 41% | 43% | 9%[lower-alpha 300] | 6% |
| Fox News | Feb 23–26, 2020 | 1,000 (RV) | ± 3.0 % | 40% | 48% | 7%[lower-alpha 301] | 5% |
| Ipsos/Reuters | Feb 19–25, 2020 | 3,809 (RV) | ± 1.8% | 39%[lower-alpha 302] | 43% | – | –[lower-alpha 303] |
| CBS News/YouGov | Feb 20–22, 2020 | 10,000 (RV) | ± 1.2 % | 45% | 42% | 7%[lower-alpha 304] | 6% |
| Saint Leo University | Feb 17–22, 2020 | 1,000 (A) | ± 3% | 34% | 50% | – | 16% |
| Emerson College | Feb 16–18, 2020 | 1,250 (RV) | ± 2.7 % | 51% | 49% | – | – |
| Ipsos/Reuters | Feb 14–17, 2020 | 947 (RV) | ± 3.6% | 38% | 44% | 11%[lower-alpha 305] | 7% |
| ABC News/Washington Post | Feb 14–17, 2020 | 913 (RV) | ± 4% | 45% | 50% | 3%[lower-alpha 306] | 1% |
| NBC News/Wall Street Journal | Feb 14–17, 2020 | 900 (RV) | ± 3.3 % | 43% | 50% | – | – |
| SurveyUSA | Feb 13–17, 2020 | 2,768 (RV) | ± 1.9 % | 43% | 50% | – | 7% |
| Morning Consult | Feb 12–17, 2020 | 7,313 (RV) | ± 1% | 42% | 46% | – | 12% |
| NPR/PBS News/Marist College | Feb 13–16, 2020 | 1,164 (RV) | ± 3.7 % | 44% | 48% | 2% | 6% |
| Ipsos/Reuters | Feb 6–10, 2020 | 952 (RV) | ±3.6% | 41% | 45% | 10%[lower-alpha 307] | 5%[lower-alpha 308] |
| Quinnipiac | Feb 5–9, 2020 | 1,159 (RV) | ± 2.5% | 42% | 51% | 5%[lower-alpha 309] | 2% |
| Morning Consult | Feb 4–9, 2020 | 36,180 (RV) | ± 1% | 41% | 46% | – | 13% |
| Atlas Intel | Jan 30 – Feb 2, 2020 | 1,600 (RV) | 2% | 44.6% | 43.2% | – | 12.2% |
| Morning Consult | Jan 27 – Feb 2, 2020 | 7,178 (RV) | ± 1% | 40% | 47% | – | 13% |
| IBD/TIPP[lower-alpha 310] | Jan 23–30, 2020 | 856 (RV) | – | 47% | 48% | 3%[lower-alpha 311] | 2% |
| Morning Consult | Jan 20–26, 2020 | 8,399 (RV) | ± 1% | 41% | 45% | – | 14% |
| ABC News/Washington Post | Jan 20–23, 2020 | 880 (RV) | ± 4% | 46% | 49% | 4%[lower-alpha 312] | 1% |
| Fox News | Jan 19–22, 2020 | 1,005 (RV) | ± 3% | 41% | 49% | 7%[lower-alpha 313] | 3% |
| CNN/SSRS | Jan 16–19, 2020 | 1,051 (RV) | ± 3.4% | 43% | 52% | 3%[lower-alpha 314] | 2% |
| Morning Consult | Jan 15–19, 2020 | 5,944 (RV) | ± 1% | 42% | 43% | – | 15% |
| Zogby Analytics | Jan 15–16, 2020 | 882 (LV) | – | 43% | 45% | – | 12% |
| SurveyUSA | Jan 14–16, 2020 | 4,069 (RV) | ± 1.7% | 42% | 49% | – | 9% |
| Morning Consult | Jan 6–12, 2020 | 8,299 (RV) | ± 1% | 42% | 43% | – | 15% |
| IBD/TIPP | Jan 3–11, 2020 | 901 (RV) | ± 3.3% | 45% | 47% | 5%[lower-alpha 315] | 3% |
| Morning Consult | Dec 30, 2019 – Jan 5, 2020 | 8,436 (RV) | ± 1% | 41% | 43% | – | 17% |
| Ipsos/Reuters | Dec 18–19, 2019 | 1,117 (A) | ± 3.3% | 35% | 36% | 19%[lower-alpha 316] | 10% |
| IBD/TIPP | Dec 6–14, 2019 | 905 (RV) | ± 3.3% | 47% | 46% | 5%[lower-alpha 317] | 3% |
| Fox News | Dec 8–11, 2019 | 1,000 (RV) | ± 3.0% | 40% | 45% | 3% | 7% |
| Quinnipiac | Dec 4–9, 2019 | 1,553 (RV) | ± 2.5% | 42% | 48% | 5%[lower-alpha 318] | 5% |
| Zogby Analytics | Dec 5, 2019 | 865 | ± 3.3% | 44% | 43% | – | – |
| SurveyUSA | Nov 20–21, 2019 | 3,850 (RV) | ± 1.7% | 40% | 46% | – | 14% |
| Morning Consult | Nov 8, 2019 | 1,300 (RV) | ± 3% | 37% | 43% | – | 21% |
| YouGov/Hofstra University | Oct 25–31, 2019 | 1,500 (LV) | ± 3% | 45% | 42.1% | – | 12.9% |
| Rasmussen Reports | Jan 30–31, 2019 | 1,000 | ± 3.0% | 40% | 46% | – | 14% |
| Zogby Analytics | Oct 15–17, 2018 | 848 | ± 3.4% | 40% | 43% | – | 16% |
Amy Klobuchar
| Poll source | Date(s) administered |
Sample size[lower-alpha 2] |
Margin of error |
Donald Trump (R) |
Amy Klobuchar (D) |
Other | Undecided |
|---|---|---|---|---|---|---|---|
| IBD/TIPP | Feb 20–29, 2020 | 839 (RV) | – | 46% | 46% | 3%[lower-alpha 319] | 4% |
| Fox News | Feb 23–26, 2020 | 1,000 (RV) | ± 3.0 % | 43% | 44% | 7%[lower-alpha 320] | 6% |
| Ipsos/Reuters | Feb 19–25, 2020 | 3,809 (RV) | ± 1.8% | 40%[lower-alpha 321] | 42% | –[lower-alpha 322] | –[lower-alpha 323] |
| YouGov/CBS News | Feb 20–22, 2020 | 10,000 (RV) | ± 1.2 % | 44% | 45% | 6%[lower-alpha 324] | 5% |
| Saint Leo University | Feb 17–22, 2020 | 1,000 (A) | ± 3% | 37.4% | 43.9% | – | 18.7% |
| Emerson College | Feb 16–18, 2020 | 1,250 (RV) | ± 2.7 % | 51% | 49% | – | – |
| Ipsos/Reuters | Feb 14–17, 2020 | 947 (RV) | ± 3.6% | 39% | 40% | 14%[lower-alpha 325] | 7% |
| ABC News/Washington Post | Feb 14–17, 2020 | 913 (RV) | ± 4 % | 46% | 48% | 4%[lower-alpha 326] | 1% |
| NBC News/Wall Street Journal | Feb 14–17, 2020 | 900 (RV) | ± 3.3 % | 45% | 48% | – | – |
| SurveyUSA | Feb 13–17, 2020 | 2,768 (RV) | ± 1.9 % | 46% | 44% | – | 10% |
| NPR/PBS News/Marist College | Feb 13–16, 2020 | 1,164 (RV) | ± 3.7 % | 45% | 47% | 2% | 6% |
| Quinnipiac | Feb 5–9, 2020 | 1,159 (RV) | ± 2.5% | 43% | 49% | 4%[lower-alpha 327] | 4% |
| USC Dornlife/LA Times | Jan 15–28, 2020 | 4,869 (RV) | ± 2% | 40% | 42% | 11%[lower-alpha 328] | 7% |
| ABC News/Washington Post | Jan 20–23, 2020 | 880 (RV) | ± 4% | 47% | 48% | 4%[lower-alpha 329] | 2% |
| Fox News | Jan 19–22, 2020 | 1,005 (RV) | ± 3% | 42% | 43% | 10%[lower-alpha 330] | 4% |
| CNN/SSRS | Jan 16–19, 2020 | 1,051 (RV) | ± 3.4% | 45% | 48% | 3%[lower-alpha 331] | 3% |
| Zogby Analytics | Jan 15–16, 2020 | 882 (LV) | – | 47% | 40% | – | 13% |
| SurveyUSA | Jan 14–16, 2020 | 4,069 (RV) | ± 1.7% | 45% | 43% | – | 12% |
| Quinnipiac | Dec 4–9, 2019 | 1,553 (RV) | ± 2.5% | 43% | 47% | 4%[lower-alpha 332] | 5% |
| HarrisX | Oct 1–2, 2019 | 1000 (RV) | – | 38% | 30% | 20%[lower-alpha 333] | 13% |
| HarrisX | Jul 25–26, 2019 | 1,000 (RV) | – | 40% | 28% | 20%[lower-alpha 334] | 13% |
| HarrisX | Jun 22–23, 2019 | 1,001 | ± 3.1% | 41% | 30% | 18%[lower-alpha 335] | 11% |
| Ipsos/Daily Beast | Jun 10–11, 2019 | 1,005 | ± 2.5% | 36% | 34% | – | 15% |
| HarrisX | May 26–27, 2019 | 1,003 | ± 3.1% | 37% | 29% | 16% | 13% |
| HarrisX | Apr 30 – May 1, 2019 | 1,000 | ± 3.1% | 39% | 27% | 16% | 12% |
| HarrisX | Apr 3–4, 2019 | 1,002 | ± 3.1% | 37% | 30% | 11% | 15% |
| HarrisX | Mar 19–20, 2019 | 1,001 | ± 3.1% | 37% | 30% | 11% | 14% |
| Emerson College | Feb 14–16, 2019 | 1,000 | ± 3.0% | 49% | 52% | – | – |
| SurveyMonkey/Axios | Oct 28–30, 2018 | 2,994 | – | 42% | 51% | – | 7% |
Pete Buttigieg
| Poll source | Date(s) administered |
Sample size[lower-alpha 2] |
Margin of error |
Donald Trump (R) |
Pete Buttigieg (D) |
Other | Undecided |
|---|---|---|---|---|---|---|---|
| IBD/TIPP | Feb 20–29, 2020 | 839 (RV) | – | 45% | 48% | 3%[lower-alpha 336] | 3% |
| YouGov/Yahoo News | Feb 26–27, 2020 | 1,662 (RV) | – | 43% | 46% | 7%[lower-alpha 337] | 5% |
| Morning Consult | Feb 23–27, 2020 | 6,117 (RV) | ± 1% | 42% | 43% | – | 15% |
| Fox News | Feb 23–26, 2020 | 1,000 (RV) | ± 3.0% | 42% | 45% | 8%[lower-alpha 338] | 6% |
| Ipsos/Reuters | Feb 19–25, 2020 | 3,809 (RV) | ± 1.8% | 40%[lower-alpha 339] | 44% | –[lower-alpha 340] | –[lower-alpha 341] |
| YouGov/CBS News | Feb 20–22, 2020 | 10,000 (RV) | ± 1.2 % | 44% | 44% | 6%[lower-alpha 342] | 5% |
| Saint Leo University | Feb 17–22, 2020 | 1,000 (A) | ± 3% | 37.4% | 45.8% | – | 16.8% |
| Emerson College | Feb 16–18, 2020 | 1,250 (RV) | ± 2.7 % | 51% | 49% | – | – |
| Global Strategy Group/GBAO | Feb 14–17, 2020 | 600 (RV) | – | 44% | 50% | 1%[lower-alpha 343] | 4% |
| ABC News/Washington Post | Feb 14–17, 2020 | 913 (RV) | ± 4 % | 46% | 49% | 5%[lower-alpha 344] | 1% |
| NBC News/Wall Street Journal | Feb 14–17, 2020 | 900 (RV) | ± 3.3 % | 44% | 48% | – | – |
| Ipsos/Reuters | Feb 14–17, 2020 | 947 (RV) | ± 3.6% | 40% | 43% | 11%[lower-alpha 345] | 7%[lower-alpha 346] |
| SurveyUSA | Feb 13–17, 2020 | 2,768 (RV) | ± 1.9 % | 45% | 48% | – | 8% |
| Morning Consult | Feb 12–17, 2020 | 7,313 (RV) | ± 1% | 42% | 44% | – | 15% |
| NPR/PBS News/Marist College | Feb 13–16, 2020 | 1,164 (RV) | ± 3.7 % | 45% | 47% | 2% | 7% |
| Ipsos/Reuters | Feb 6–10, 2020 | 952 (RV) | ±3.6% | 41% | 41% | 12%[lower-alpha 347] | 5%[lower-alpha 348] |
| Quinnipiac | Feb 5–9, 2020 | 1,159 (RV) | ± 2.5% | 43% | 47% | 5%[lower-alpha 349] | 5% |
| Morning Consult | Feb 4–9, 2020 | 36,180 (RV) | ± 1% | 42% | 43% | – | 15% |
| Atlas Intel | Jan 30 – Feb 2, 2020 | 1,600 (RV) | 2% | 44.3% | 44.6% | – | 11.1% |
| Morning Consult | Jan 27 – Feb 2, 2020 | 7,178 (RV) | ± 1% | 41% | 42% | – | 17% |
| IBD/TIPP[lower-alpha 350] | Jan 23–30, 2020 | 856 (RV) | – | 48% | 45% | 4%[lower-alpha 351] | 3% |
| NBC/WSJ | Jan 26–29, 2020 | 1,000 (RV) | ± 3.1% | 44% | 45% | 6%[lower-alpha 352] | 3% |
| USC Dornlife/LA Times | Jan 15–28, 2020 | 4,869 (RV) | ± 2% | 40% | 43% | 10%[lower-alpha 353] | 7% |
| Morning Consult | Jan 20–26, 2020 | 8,399 (RV) | ± 1% | 41% | 43% | – | 16% |
| Emerson College | Jan 21–23, 2020 | 1,128 (RV) | ± 2.8% | 52% | 49% | – | – |
| ABC News/Washington Post | Jan 20–23, 2020 | 880 (RV) | ± 4% | 48% | 45% | 5%[lower-alpha 354] | 1% |
| CNN/SSRS | Jan 16–19, 2020 | 1,051 (RV) | ± 3.4% | 45% | 49% | 3%[lower-alpha 355] | 2% |
| Morning Consult | Jan 15–19, 2020 | 5,944 (RV) | ± 1% | 42% | 41% | – | 17% |
| Zogby Analytics | Jan 15–16, 2020 | 882 (LV) | – | 46% | 41% | – | 13% |
| SurveyUSA | Jan 14–16, 2020 | 4,069 (RV) | ± 1.7% | 44% | 47% | – | 9% |
| Morning Consult | Jan 6–12, 2020 | 8,299 (RV) | ± 1% | 42% | 42% | – | 13% |
| IBD/TIPP | Jan 3–11, 2020 | 901 (RV) | ± 3.3% | 46% | 47% | 4%[lower-alpha 356] | 3% |
| Morning Consult | Dec 30, 2019 – Jan 5, 2020 | 8,436 (RV) | ± 1% | 41% | 42% | – | 17% |
| Ipsos/Reuters | Dec 18–19, 2019 | 1,117 (A) | ± 3.3% | 36% | 35% | 20%[lower-alpha 357] | 10% |
| Emerson College | Dec 15–17, 2019 | 1,222 (RV) | ± 2.7% | 50% | 50% | – | – |
| CNN/ORC | Dec 12–15, 2019 | 1,005 (RV) | ± 3.7% | 46% | 45% | 1% | 5% |
| USA TODAY/Suffolk | Dec 10–14, 2019 | 1,000 (RV) | ± 3.0% | 43% | 33% | 0% | 24% |
| IBD/TIPP | Dec 6–14, 2019 | 905 (RV) | ± 3.3% | 46% | 44% | 5%[lower-alpha 358] | 4% |
| Fox News | Dec 8–11, 2019 | 1,000 (RV) | ± 3.0% | 42% | 43% | 3% | 7% |
| Quinnipiac | Dec 4–9, 2019 | 1,553 (RV) | ± 2.5% | 43% | 48% | 4%[lower-alpha 359] | 3% |
| Zogby Analytics | Dec 5, 2019 | 865 | ± 3.3% | 45% | 41% | – | – |
| SurveyUSA | Nov 20–21, 2019 | 3,850 (RV) | ± 1.7% | 41% | 48% | – | 11% |
| RealClear Opinion Research | Nov 15–21, 2019 | 2,055 (RV) | ± 2.38% | 40% | 45% | – | 15% |
| Emerson College | Nov 17–20, 2019 | 1,092 (RV) | ± 2.9% | 52% | 48% | – | – |
| ABC/Washington Post | Oct 27–30, 2019 | 876 (RV) | ± 4% | 41% | 52% | 6% [lower-alpha 360] | 1% |
| Fox News | Oct 27–30, 2019 | 1,040 (RV) | ± 3% | 41% | 41% | 11%[lower-alpha 361] | 6% |
| Morning Consult/Politico | Oct 25–28, 2019 | 1,997 (RV) | ± 2% | 35% | 29% | – | 36% |
| CNN/SSRS | Oct 17–20, 2019 | 892 | ± 4.0% | 44% | 50% | 4%[lower-alpha 362] | 2%[lower-alpha 363] |
| SurveyUSA | Oct 15–16, 2019 | 3,080 (RV) | ± 2.1% | 43% | 44% | – | 13% |
| Lord Ashcroft Polls | Oct 1–15, 2019 | 15,051 (A) | – | 44% | 56% | – | – |
| Zogby Analytics | Oct 1–3, 2019 | 887 (LV) | ± 3.3% | 49% | 38% | – | 13% |
| HarrisX | Oct 1–2, 2019 | 1000 (RV) | – | 37% | 32% | 18%[lower-alpha 364] | 13% |
| ABC News/Washington Post | Sep 2–5, 2019 | 877 | ± 4.0% | 43% | 47% | – | 4% |
| Emerson College | Aug 24–26, 2019 | 1,458 | ± 2.5% | 51% | 49% | – | – |
| Quinnipiac University | Aug 21–26, 2019 | 1,422 | ± 3.1% | 40% | 49% | 2% | 7% |
| SurveyUSA | Aug 1–5, 2019 | 5,459 | ± 1.6% | 44% | 42% | – | 14% |
| Emerson College | Jul 27–29, 2019 | 1,233 | ± 2.7% | 52% | 48% | – | – |
| HarrisX | July 25–26, 2019 | 1,000 (RV) | – | 40% | 30% | 18%[lower-alpha 365] | 12% |
| Emerson College | Jul 6–8, 2019 | 1,100 | ± 2.9% | 51% | 49% | – | – |
| ABC News/Washington Post | Jun 28 – Jul 1, 2019 | 875 | ± 4.0% | 47% | 47% | 1% | 3% |
| Emerson College | Jun 21–24, 2019 | 1,096 | ± 2.9% | 48% | 52% | – | – |
| HarrisX | Jun 22–23, 2019 | 1,001 | ± 3.1% | 41% | 31% | 15%[lower-alpha 366] | 12% |
| Fox News | Jun 9–12, 2019 | 1,001 | ± 3.0% | 40% | 41% | 7% | 9% |
| Ipsos/Daily Beast | Jun 10–11, 2019 | 1,005 | ± 2.5% | 36% | 34% | – | 14% |
| Quinnipiac University | Jun 6–10, 2019 | 1,214 | ± 3.5% | 42% | 47% | 1% | 7% |
| Morning Consult | Jun 7–9, 2019 | 1,991 | ± 2.0% | 31% | 27% | – | 42% |
| Ipsos/Reuters | May 29 – Jun 5, 2019 | 3,851 | ± 1.8% | 37% | 39% | 12% | 7% |
| HarrisX | May 26–27, 2019 | 1,003 | ± 3.1% | 38% | 31% | 13% | 14% |
| Change Research | May 18–21, 2019 | 2,904 | ± 1.8% | 46% | 44% | 9% | – |
| Fox News | May 11–14, 2019 | 1,008 | ± 3.0% | 41% | 40% | 7% | 8% |
| Emerson College | May 10–13, 2019 | 1,006 | ± 3.0% | 50% | 50% | – | – |
| Zogby Analytics | May 2–9, 2019 | 903 | – | 41% | 41% | – | 17% |
| HarrisX | Apr 30 – May 1, 2019 | 1,000 | ± 3.1% | 40% | 29% | 14% | 12% |
| CNN/SSRS | Apr 25–28, 2019 | 439 | ± 5.7% | 44% | 47% | 1% | 6% |
| Rasmussen Reports | Apr 14–25, 2019 | 5,000 | ± 1.5% | 44% | 40% | – | 16% |
| Emerson College | Apr 11–14, 2019 | 914 | ± 3.2% | 51% | 49% | – | – |
| HarrisX | Apr 3–4, 2019 | 1,002 | ± 3.1% | 37% | 28% | 13% | 15% |
| Public Policy Polling | Mar 27–28, 2019 | 846 | ± 3.4% | 41% | 45% | – | 14% |
| HarrisX | Mar 19–20, 2019 | 1,001 | ± 3.1% | 36% | 27% | 13% | 16% |
Tom Steyer
| Poll source | Date(s) administered |
Sample size[lower-alpha 2] |
Margin of error |
Donald Trump (R) |
Tom Steyer (D) |
Other | Undecided |
|---|---|---|---|---|---|---|---|
| SurveyUSA | Feb 13–17, 2020 | 2,768 (RV) | ± 1.9 % | 47% | 42% | – | 11% |
| SurveyUSA | Jan 14–16, 2020 | 4,069 (RV) | ± 1.7% | 44% | 44% | – | 12% |
| HarrisX | Oct 1–2, 2019 | 1,000 (RV) | – | 37% | 28% | 20%[lower-alpha 367] | 15% |
| HarrisX | Aug 23–24, 2019 | 1,001 (RV) | – | 38% | 32% | 18%[lower-alpha 368] | 12% |
| HarrisX | Jul 26–27, 2019 | 1,001 (RV) | – | 36% | 28% | 22%[lower-alpha 369] | 15% |
Michael Bennet
| Poll source | Date(s) administered |
Sample size[lower-alpha 2] |
Margin of error |
Donald Trump (R) |
Michael Bennet (D) |
Other | Undecided |
|---|---|---|---|---|---|---|---|
| HarrisX | Aug 23–24, 2019 | 1,001 (RV) | – | 37% | 31% | 20%[lower-alpha 370] | 12% |
| HarrisX | Jul 26–27, 2019 | 1,001 (RV) | – | 37% | 28% | 22%[lower-alpha 371] | 13% |
| HarrisX | Jun 23–24, 2019 | 1,001 (RV) | ± 3.1% | 37% | 26% | 24%[lower-alpha 372] | 13% |
Andrew Yang
| Poll source | Date(s) administered |
Sample size[lower-alpha 2] |
Margin of error |
Donald Trump (R) |
Andrew Yang (D) |
Other | Undecided |
|---|---|---|---|---|---|---|---|
| SurveyUSA | Jan 14–16, 2020 | 4,069 (RV) | ± 1.7% | 44% | 46% | – | 10% |
| HarrisX | Oct 1–2, 2019 | 1,000 (RV) | – | 38% | 31% | 19%[lower-alpha 373] | 12% |
| HarrisX | Aug 23–24, 2019 | 1,001 (RV) | – | 37% | 33% | 18%[lower-alpha 374] | 12% |
| HarrisX | Jul 26–27, 2019 | 1,001 (RV) | – | 37% | 27% | 23%[lower-alpha 375] | 13% |
| HarrisX | Jun 23–24, 2019 | 1,001 (RV) | ± 3.1% | 38% | 26% | 23%[lower-alpha 376] | 13% |
| HarrisX | May 26–27, 2019 | 1,003 | ± 3.1% | 37% | 26% | 18% | 14% |
| HarrisX | Apr 30 – May 1, 2019 | 1,000 | ± 3.1% | 38% | 26% | 17% | 12% |
| HarrisX | Apr 3–4, 2019 | 1,002 | ± 3.1% | 37% | 25% | 14% | 16% |
| HarrisX | Mar 19–20, 2019 | 1,001 | ± 3.1% | 35% | 27% | 14% | 16% |
John Delaney
| Poll source | Date(s) administered |
Sample size[lower-alpha 2] |
Margin of error |
Donald Trump (R) |
John Delaney (D) |
Other | Undecided |
|---|---|---|---|---|---|---|---|
| HarrisX | Aug 23–24, 2019 | 1,001 (RV) | – | 37% | 32% | 18%[lower-alpha 377] | 13% |
| HarrisX | Jul 26–27, 2019 | 1,001 (RV) | – | 36% | 28% | 22%[lower-alpha 378] | 14% |
| HarrisX | Jun 23–24, 2019 | 1,001 (RV) | ± 3.1% | 37% | 25% | 24%[lower-alpha 379] | 13% |
| HarrisX | May 26–27, 2019 | 1,003 | ± 3.1% | 36% | 27% | 17% | 14% |
| HarrisX | Apr 30 – May 1, 2019 | 1,000 | ± 3.1% | 39% | 26% | 16% | 12% |
| HarrisX | Apr 3–4, 2019 | 1,002 | ± 3.1% | 37% | 27% | 15% | 14% |
| HarrisX | Mar 19–20, 2019 | 1,001 | ± 3.1% | 36% | 28% | 13% | 15% |
| Morning Consult | Aug 16–18, 2018 | 1,974 | ± 2.0% | 28% | 18% | – | 53% |
| Public Policy Polling | Aug 18–21, 2017 | 887 | ± 3.3% | 38% | 38% | – | 24% |
Cory Booker
| Poll source | Date(s) administered |
Sample size[lower-alpha 2] |
Margin of error |
Donald Trump (R) |
Cory Booker (D) |
Other | Undecided |
|---|---|---|---|---|---|---|---|
| HarrisX | Oct 1–2, 2019 | 1,000 (RV) | – | 37% | 33% | 18%[lower-alpha 380] | 12% |
| Morning Consult | Aug 16–18, 2019 | 1,998 | ± 2.0% | 35% | 28% | – | 37% |
| HarrisX | July 25–26, 2019 | 1,000 (RV) | – | 40% | 31% | 18%[lower-alpha 381] | 12% |
| HarrisX | Jun 22–23, 2019 | 1,001 (RV) | ± 3.1% | 41% | 31% | 18%[lower-alpha 382] | 11% |
| Rasmussen Reports | Jun 9–20, 2019 | 5,000 | ± 1.5% | 45% | 43% | – | 12% |
| Quinnipiac University | Jun 6–10, 2019 | 1,214 | ± 3.5% | 42% | 47% | 1% | 7% |
| Morning Consult | Jun 7–9, 2019 | 1,991 | ± 2.0% | 32% | 28% | – | 39% |
| HarrisX | May 25–26, 2019 | 1,001 | ± 3.1% | 39% | 31% | 13% | 11% |
| Zogby Analytics | May 2–9, 2019 | 903 | – | 41% | 44% | – | 15% |
| HarrisX | Apr 28–29, 2019 | 1,002 | ± 3.1% | 38% | 30% | 15% | 10% |
| HarrisX | Mar 31 – Apr 1, 2019 | 1,000 | ± 3.1% | 38% | 31% | 14% | 12% |
| Public Policy Polling | Mar 27–28, 2019 | 846 | ± 3.4% | 41% | 48% | – | 10% |
| HarrisX | Mar 17–18, 2019 | 1,001 | ± 3.1% | 37% | 35% | 11% | 13% |
| Civiqs/Daily Kos | Mar 9–12, 2019 | 1,622 | ± 2.6% | 44% | 42% | – | 15% |
| D-CYFOR | Feb 22–23, 2019 | 1,000 | ± 3.1% | 43% | 46% | – | 11% |
| Emerson College | Feb 14–16, 2019 | 1,000 | ± 3.0% | 49% | 51% | – | – |
| Public Policy Polling | Jan 19–21, 2019 | 760 | ± 3.6% | 42% | 47% | – | 11% |
| Morning Consult | Aug 16–18, 2018 | 1,974 | ± 2.0% | 29% | 27% | – | 44% |
| Public Policy Polling | Jun 8–10, 2018 | 679 | ± 3.8% | 39% | 47% | – | 15% |
| Zogby Analytics | May 10–12, 2018 | 881 | ± 3.2% | 38% | 38% | – | 24% |
| Public Policy Polling | Mar 23–25, 2018 | 846 | ± 3.4% | 39% | 49% | – | 12% |
| Public Policy Polling | Feb 9–11, 2018 | 687 | ± 3.7% | 42% | 46% | – | 11% |
| Public Policy Polling | Dec 11–12, 2017 | 862 | ± 3.3% | 40% | 50% | – | 10% |
| Public Policy Polling | Oct 27–29, 2017 | 572 | ± 4.1% | 38% | 49% | – | 13% |
| Public Policy Polling | Sep 22–25, 2017 | 865 | ± 3.3% | 40% | 47% | – | 13% |
| Public Policy Polling | Aug 18–21, 2017 | 887 | ± 3.3% | 39% | 42% | – | 19% |
| Public Policy Polling | Jul 14–17, 2017 | 836 | ± 3.4% | 40% | 45% | – | 15% |
| Public Policy Polling | Jun 9–11, 2017 | 811 | ± 3.4% | 41% | 43% | – | 17% |
| Public Policy Polling | May 12–14, 2017 | 692 | ± 3.7% | 39% | 46% | – | 15% |
| Public Policy Polling | Apr 17–18, 2017 | 648 | ± 3.9% | 42% | 42% | – | 17% |
| Public Policy Polling | Mar 27–28, 2017 | 677 | ± 3.8% | 42% | 45% | – | 13% |
Marianne Williamson
| Poll source | Date(s) administered |
Sample size[lower-alpha 2] |
Margin of error |
Donald Trump (R) |
Marianne Williamson (D) |
Other | Undecided |
|---|---|---|---|---|---|---|---|
| HarrisX | Aug 23–24, 2019 | 1,001 (RV) | – | 37% | 30% | 20%[lower-alpha 383] | 12% |
| HarrisX | Jul 26–27, 2019 | 1,001 (RV) | – | 37% | 26% | 23%[lower-alpha 384] | 14% |
| HarrisX | Jun 23–24, 2019 | 1,001 (RV) | ± 3.1% | 38% | 26% | 23%[lower-alpha 385] | 13% |
| HarrisX | May 26–27, 2019 | 1,003 | ± 3.1% | 37% | 27% | 17% | 13% |
| HarrisX | Apr 30 – May 1, 2019 | 1,000 | ± 3.1% | 40% | 24% | 18% | 13% |
| HarrisX | Apr 3–4, 2019 | 1,002 | ± 3.1% | 37% | 26% | 15% | 15% |
| HarrisX | Mar 19–20, 2019 | 1,001 | ± 3.1% | 36% | 27% | 13% | 16% |
Julián Castro
| Poll source | Date(s) administered |
Sample size[lower-alpha 2] |
Margin of error |
Donald Trump (R) |
Julian Castro (D) |
Other | Undecided |
|---|---|---|---|---|---|---|---|
| HarrisX | Oct 1–2, 2019 | 1,000 | – | 37% | 30% | 20%[lower-alpha 386] | 13% |
| HarrisX | July 25–26, 2019 | 1,000 (RV) | – | 39% | 29% | 19%[lower-alpha 387] | 13% |
| Rasmussen Reports | Jul 7–18, 2019 | 5,000 | ± 1.5% | 46% | 40% | – | 14% |
| HarrisX | Jun 22–23, 2019 | 1,001 (RV) | ± 3.1% | 41% | 29% | 19%[lower-alpha 388] | 11% |
| HarrisX | May 25–26, 2019 | 1,001 | ± 3.1% | 39% | 26% | 15% | 13% |
| HarrisX | Apr 28–29, 2019 | 1,002 | ± 3.1% | 38% | 26% | 17% | 13% |
| HarrisX | Mar 31 – Apr 1, 2019 | 1,000 | ± 3.1% | 38% | 30% | 14% | 13% |
| HarrisX | Mar 17–18, 2019 | 1,001 | ± 3.1% | 37% | 30% | 12% | 15% |
Kamala Harris
| Poll source | Date(s) administered |
Sample size[lower-alpha 2] |
Margin of error |
Donald Trump (R) |
Kamala Harris (D) |
Other | Undecided |
|---|---|---|---|---|---|---|---|
| SurveyUSA | Nov 20–21, 2019 | 3,850 (RV) | ± 1.7% | 42% | 47% | – | 11% |
| RealClear Opinion Research | Nov 15–21, 2019 | 2,055 (RV) | ± 2.38% | 40% | 46% | – | 14% |
| ABC News/Washington Post | Oct 27–30, 2019 | 876 (RV) | ± 4% | 42% | 51% | 5% [lower-alpha 389] | 2% |
| Morning Consult/Politico | Oct 25–28, 2019 | 1,997 (RV) | ± 2% | 36% | 31% | – | 33% |
| SurveyUSA | Oct 15–16, 2019 | 3,080 (RV) | ± 2.1% | 44% | 47% | – | 9% |
| Lord Ashcroft Polls | Oct 1–15, 2019 | 15,051 (A) | – | 44% | 56% | – | – |
| Zogby Analytics | Oct 1–3, 2019 | 887 (LV) | ± 3.3% | 47% | 41% | – | 12% |
| IBD/TIPP | Sep 26 – Oct 3, 2019 | 863 | ± 3.5% | 46% | 46% | 2% | 5% |
| HarrisX | Oct 1–2, 2019 | 1000 (RV) | – | 38% | 35% | 16%[lower-alpha 390] | 11% |
| Emerson College | Sep 21–23, 2019 | 1,019 | ± 3.0% | 52% | 48% | – | – |
| Fox News | Sep 15–17, 2019 | 1,008 | ± 3.0% | 40% | 42% | 10% | 4% |
| SurveyUSA | Sep 13–16, 2019 | 4,520 | ± 1.6% | 44% | 44% | – | 12% |
| ABC News/Washington Post | Sep 2–5, 2019 | 877 | ± 4.0% | 43% | 50% | – | 2% |
| IBD/TIPP | Aug 22–30, 2019 | 848 | – | 46% | 49% | 1% | 4% |
| Emerson College | Aug 24–26, 2019 | 1,458 | ± 2.5% | 50% | 50% | – | – |
| Quinnipiac University | Aug 21–26, 2019 | 1,422 | ± 3.1% | 40% | 51% | 2% | 5% |
| Morning Consult | Aug 16–18, 2019 | 1,998 | ± 2.0% | 35% | 32% | – | 33% |
| Fox News | Aug 11–13, 2019 | 1,013 | ± 3.0% | 39% | 45% | 6% | 7% |
| SurveyUSA | Aug 1–5, 2019 | 5,459 | ± 1.6% | 44% | 45% | – | 11% |
| IBD/TIPP | Jul 25 – Aug 1, 2019 | 856 | – | 45% | 47% | 2% | 5% |
| Emerson College | Jul 27–29, 2019 | 1,233 | ± 2.7% | 52% | 48% | – | – |
| HarrisX | July 25–26, 2019 | 1,000 (RV) | – | 39% | 36% | 16%[lower-alpha 391] | 9% |
| Fox News | Jul 21–23, 2019 | 1,004 | ± 3.0% | 41% | 40% | 7% | 8% |
| NBC News/Wall Street Journal | Jul 7–9, 2019 | 800 | ± 3.5% | 44% | 45% | 4% | 6% |
| Emerson College | Jul 6–8, 2019 | 1,100 | ± 2.9% | 51% | 49% | – | – |
| ABC News/Washington Post | Jun 28 – Jul 1, 2019 | 875 | ± 4.0% | 46% | 48% | 1% | 2% |
| Emerson College | Jun 21–24, 2019 | 1,096 | ± 2.9% | 48% | 52% | – | – |
| HarrisX | Jun 22–23, 2019 | 1,001 (RV) | ± 3.1% | 41% | 33% | 16%[lower-alpha 392] | 10% |
| Fox News | Jun 9–12, 2019 | 1,001 | ± 3.0% | 41% | 42% | 6% | 7% |
| Ipsos/Daily Beast | Jun 10–11, 2019 | 1,005 | ± 2.5% | 35% | 41% | – | 12% |
| Quinnipiac University | Jun 6–10, 2019 | 1,214 | ± 3.5% | 41% | 49% | 1% | 6% |
| Morning Consult | Jun 7–9, 2019 | 1,991 | ± 2.0% | 33% | 30% | – | 37% |
| Ipsos/Reuters | May 29 – Jun 5, 2019 | 3,851 | ± 1.8% | 38% | 41% | 11% | 7% |
| HarrisX | May 25–26, 2019 | 1,001 | ± 3.1% | 38% | 33% | 11% | 12% |
| Change Research | May 18–21, 2019 | 2,904 | ± 1.8% | 45% | 46% | 7% | – |
| Fox News | May 11–14, 2019 | 1,008 | ± 3.0% | 41% | 41% | 7% | 8% |
| Emerson College | May 10–13, 2019 | 1,006 | ± 3.0% | 49% | 51% | – | – |
| Zogby Analytics | May 2–9, 2019 | 903 | – | 41% | 44% | – | 16% |
| Rasmussen Reports | Apr 28 – May 9, 2019 | 5,000 | ± 1.5% | 47% | 42% | – | 12% |
| HarrisX | Apr 28–29, 2019 | 1,002 | ± 3.1% | 39% | 30% | 14% | 10% |
| CNN/SSRS | Apr 25–28, 2019 | 453 | ± 5.5% | 45% | 49% | 0% | 3% |
| Emerson College | Apr 11–14, 2019 | 914 | ± 3.2% | 50% | 50% | – | – |
| Civiqs/Daily Kos | Apr 6–9, 2019 | 1,584 | ± 2.7% | 45% | 44% | – | 10% |
| HarrisX | Mar 31 – Apr 1, 2019 | 1,000 | ± 3.1% | 38% | 32% | 15% | 11% |
| Public Policy Polling | Mar 27–28, 2019 | 846 | ± 3.4% | 41% | 48% | – | 11% |
| Fox News | Mar 17–20, 2019 | 1,002 | ± 3.0% | 41% | 39% | 7% | 9% |
| Emerson College | Mar 17–18, 2019 | 1,153 | ± 2.8% | 48% | 52% | – | – |
| HarrisX | Mar 17–18, 2019 | 1,001 | ± 3.1% | 36% | 34% | 12% | 12% |
| Civiqs/Daily Kos | Mar 9–12, 2019 | 1,622 | ± 2.6% | 44% | 44% | – | 12% |
| Change Research | Mar 8–10, 2019 | 4,049 | ± 2.5% | 47% | 48% | – | – |
| D-CYFOR | Feb 22–23, 2019 | 1,000 | ± 3.1% | 43% | 45% | – | 12% |
| Emerson College | Feb 14–16, 2019 | 1,000 | ± 3.0% | 48% | 52% | – | – |
| Change Research | Jan 31 – Feb 1, 2019 | 1,338 | ± 2.7% | 46% | 47% | – | – |
| Øptimus | Jan 30 – Feb 1, 2019 | 1,079 | ± 3.0% | 45% | 43% | – | 12% |
| Public Policy Polling | Jan 19–21, 2019 | 760 | ± 3.6% | 41% | 48% | – | 11% |
| SurveyMonkey/Axios | Oct 28–30, 2018 | 2,994 | – | 42% | 52% | – | 6% |
| Morning Consult | Aug 16–18, 2018 | 1,974 | ± 2.0% | 29% | 26% | – | 45% |
| Public Policy Polling | Jun 8–10, 2018 | 679 | ± 3.8% | 40% | 45% | – | 15% |
| Zogby Analytics | May 10–12, 2018 | 881 | ± 3.2% | 39% | 35% | – | 26% |
| Public Policy Polling | Mar 23–25, 2018 | 846 | ± 3.4% | 39% | 43% | – | 18% |
| Public Policy Polling | Feb 9–11, 2018 | 687 | ± 3.7% | 43% | 43% | – | 15% |
| Zogby Analytics | Jan 12–15, 2018 | 847 | ± 3.4% | 41% | 42% | – | 16% |
| Public Policy Polling | Dec 11–12, 2017 | 862 | ± 3.3% | 40% | 46% | – | 13% |
| Public Policy Polling | Oct 27–29, 2017 | 572 | ± 4.1% | 39% | 45% | – | 16% |
| Public Policy Polling | Sep 22–25, 2017 | 865 | ± 3.3% | 40% | 41% | – | 19% |
| Public Policy Polling | Aug 18–21, 2017 | 887 | ± 3.3% | 39% | 39% | – | 22% |
| Zogby Analytics | Aug 4–7, 2017 | 1,300 | – | 38% | 41% | – | 21% |
| Public Policy Polling | Jul 14–17, 2017 | 836 | ± 3.4% | 40% | 41% | – | 19% |
| Public Policy Polling | Jun 9–11, 2017 | 811 | ± 3.4% | 41% | 42% | – | 18% |
Steve Bullock
| Poll source | Date(s) administered |
Sample size[lower-alpha 2] |
Margin of error |
Donald Trump (R) |
Steve Bullock (D) |
Other | Undecided |
|---|---|---|---|---|---|---|---|
| HarrisX | Aug 23–24, 2019 | 1,001 (RV) | – | 37% | 31% | 19%[lower-alpha 393] | 12% |
| HarrisX | Jul 26–27, 2019 | 1,001 (RV) | – | 36% | 28% | 22%[lower-alpha 394] | 15% |
| HarrisX | Jun 23–24, 2019 | 1,001 (RV) | ± 3.1% | 38% | 26% | 24%[lower-alpha 395] | 13% |
| Morning Consult | Aug 16–18, 2018 | 1,974 | ± 2.0% | 28% | 18% | – | 54% |
Wayne Messam
| Poll source | Date(s) administered |
Sample size[lower-alpha 2] |
Margin of error |
Donald Trump (R) |
Wayne Messam (D) |
Other | Undecided |
|---|---|---|---|---|---|---|---|
| HarrisX | Aug 23–24, 2019 | 1,001 (RV) | – | 37% | 33% | 22%[lower-alpha 396] | 13% |
| HarrisX | Jul 26–27, 2019 | 1,001 (RV) | – | 37% | 24% | 24%[lower-alpha 397] | 15% |
| HarrisX | Jun 23–24, 2019 | 1,001 (RV) | ± 3.1% | 38% | 23% | 24%[lower-alpha 398] | 14% |
| HarrisX | May 25–26, 2019 | 1,001 | ± 3.1% | 40% | 20% | 19% | 15% |
| HarrisX | Apr 28–29, 2019 | 1,002 | ± 3.1% | 38% | 21% | 21% | 14% |
Beto O'Rourke
| Poll source | Date(s) administered |
Sample size[lower-alpha 2] |
Margin of error |
Donald Trump (R) |
Beto O'Rourke (D) |
Other | Undecided |
|---|---|---|---|---|---|---|---|
| HarrisX | Oct 1–2, 2019 | 1000 (RV) | – | 36% | 32% | 19%[lower-alpha 399] | 12% |
| SurveyUSA | Sep 13–16, 2019 | 4,520 | ± 1.6% | 44% | 41% | – | 15% |
| HarrisX | July 25–26, 2019 | 1,000 (RV) | – | 40% | 29% | 19%[lower-alpha 400] | 12% |
| HarrisX | Jun 22–23, 2019 | 1,001 (RV) | ± 3.1% | 40% | 33% | 16%[lower-alpha 401] | 11% |
| Morning Consult | Jun 7–9, 2019 | 1,991 | ± 2.0% | 32% | 28% | – | 40% |
| HarrisX | May 25–26, 2019 | 1,001 | ± 3.1% | 39% | 30% | 12% | 13% |
| Change Research | May 18–21, 2019 | 2,904 | ± 1.8% | 46% | 46% | 7% | – |
| Emerson College | May 10–13, 2019 | 1,006 | ± 3.0% | 48% | 52% | – | – |
| HarrisX | Apr 28–29, 2019 | 1,002 | ± 3.1% | 38% | 31% | 14% | 11% |
| CNN/SSRS | Apr 25–28, 2019 | 469 | ± 5.5% | 42% | 52% | <1% | 4% |
| Emerson College | Apr 11–14, 2019 | 914 | ± 3.2% | 49% | 51% | – | – |
| HarrisX | Mar 31 – Apr 1, 2019 | 1,000 | ± 3.1% | 38% | 34% | 11% | 11% |
| Public Policy Polling | Mar 27–28, 2019 | 846 | ± 3.4% | 41% | 47% | – | 12% |
| Emerson College | Mar 17–18, 2019 | 1,153 | ± 2.8% | 51% | 49% | – | – |
| HarrisX | Mar 17–18, 2019 | 1,001 | ± 3.1% | 36% | 36% | 9% | 13% |
| Civiqs/Daily Kos | Mar 9–12, 2019 | 1,622 | ± 2.6% | 44% | 43% | – | 13% |
| Change Research | Mar 8–10, 2019 | 4,049 | ± 2.5% | 47% | 48% | – | – |
| Emerson College | Feb 14–16, 2019 | 1,000 | ± 3.0% | 47% | 53% | – | – |
| Change Research | Jan 31 – Feb 1, 2019 | 1,338 | ± 2.7% | 46% | 47% | – | – |
| Public Policy Polling | Jan 19–21, 2019 | 760 | ± 3.6% | 41% | 47% | – | 12% |
| HarrisX | Dec 16–17, 2018 | 1,001 | ± 3.1% | 37% | 30% | – | 34% |
Tim Ryan
| Poll source | Date(s) administered |
Sample size[lower-alpha 2] |
Margin of error |
Donald Trump (R) |
Tim Ryan (D) |
Other | Undecided |
|---|---|---|---|---|---|---|---|
| HarrisX | May 26–27, 2019 | 1,003 | ± 3.1% | 37% | 28% | 17% | 13% |
| HarrisX | Apr 30 – May 1, 2019 | 1,000 | ± 3.1% | 38% | 27% | 16% | 13% |
Bill de Blasio
| Poll source | Date(s) administered |
Sample size[lower-alpha 2] |
Margin of error |
Donald Trump (R) |
Bill de Blasio (D) |
Other | Undecided |
|---|---|---|---|---|---|---|---|
| HarrisX | Aug 23–24, 2019 | 1,001 (RV) | – | 37% | 31% | 20%[lower-alpha 402] | 11% |
| HarrisX | Jul 26–27, 2019 | 1,001 (RV) | – | 38% | 26% | 23%[lower-alpha 403] | 13% |
| HarrisX | Jun 23–24, 2019 | 1,001 (RV) | ± 3.1% | 38% | 25% | 24%[lower-alpha 404] | 12% |
| Rasmussen Reports | May 26 – June 6, 2019 | 5,000 | ± 1.5% | 46% | 38% | – | 16% |
Kirsten Gillibrand
| Poll source | Date(s) administered |
Sample size[lower-alpha 2] |
Margin of error |
Donald Trump (R) |
Kirsten Gillibrand (D) |
Other | Undecided |
|---|---|---|---|---|---|---|---|
| HarrisX | Aug 23–24, 2019 | 1,001 (RV) | – | 38% | 34% | 17%[lower-alpha 405] | 12% |
| HarrisX | Jul 26–27, 2019 | 1,001 (RV) | – | 37% | 32% | 20%[lower-alpha 406] | 11% |
| HarrisX | Jun 23–24, 2019 | 1,001 | ± 3.1% | 38% | 30% | 20%[lower-alpha 407] | 12% |
| HarrisX | May 26–27, 2019 | 1,003 | ± 3.1% | 37% | 29% | 15% | 13% |
| HarrisX | Apr 30 – May 1, 2019 | 1,000 | ± 3.1% | 39% | 28% | 16% | 11% |
| HarrisX | Apr 3–4, 2019 | 1,002 | ± 3.1% | 36% | 29% | 13% | 14% |
| Public Policy Polling | Mar 27–28, 2019 | 846 | ± 3.4% | 41% | 47% | – | 12% |
| HarrisX | Mar 19–20, 2019 | 1,001 | ± 3.1% | 36% | 31% | 10% | 14% |
| Public Policy Polling | Jan 19–21, 2019 | 760 | ± 3.6% | 42% | 47% | – | 12% |
| SurveyMonkey/Axios | Oct 28–30, 2018 | 2,942 | – | 44% | 50% | – | 7% |
| Morning Consult | Aug 16–18, 2018 | 1,974 | ± 2.0% | 29% | 24% | – | 47% |
| Public Policy Polling | Jun 8–10, 2018 | 679 | ± 3.8% | 39% | 45% | – | 16% |
| Public Policy Polling | Mar 23–25, 2018 | 846 | ± 3.4% | 40% | 42% | – | 18% |
| Public Policy Polling | Feb 9–11, 2018 | 687 | ± 3.7% | 43% | 42% | – | 15% |
| YouGov | Jan 9, 2018 | 865 | – | 43% | 41% | – | – |
| Public Policy Polling | Dec 11–12, 2017 | 862 | ± 3.3% | 40% | 47% | – | 14% |
| Public Policy Polling | Oct 27–29, 2017 | 572 | ± 4.1% | 38% | 48% | – | 14% |
| Public Policy Polling | Sep 22–25, 2017 | 865 | ± 3.3% | 39% | 42% | – | 18% |
Seth Moulton
| Poll source | Date(s) administered |
Sample size[lower-alpha 2] |
Margin of error |
Donald Trump (R) |
Seth Moulton (D) |
Other | Undecided |
|---|---|---|---|---|---|---|---|
| HarrisX | Jul 26–27, 2019 | 1,001 (RV) | – | 37% | 25% | 23%[lower-alpha 408] | 15% |
| HarrisX | Jun 23–24, 2019 | 1,001 | ± 3.1% | 38% | 24% | 24%[lower-alpha 409] | 14% |
| HarrisX | May 25–26, 2019 | 1,001 | ± 3.1% | 38% | 21% | 18% | 15% |
| HarrisX | Apr 28–29, 2019 | 1,002 | ± 3.1% | 37% | 22% | 20% | 13% |
Jay Inslee
| Poll source | Date(s) administered |
Sample size[lower-alpha 2] |
Margin of error |
Donald Trump (R) |
Jay Inslee (D) |
Other | Undecided |
|---|---|---|---|---|---|---|---|
| HarrisX | Jul 26–27, 2019 | 1,001 (RV) | – | 37% | 28% | 21%[lower-alpha 410] | 14% |
| HarrisX | Jun 23–24, 2019 | 1,001 (RV) | ± 3.1% | 39% | 24% | 24%[lower-alpha 411] | 13% |
| HarrisX | May 25–26, 2019 | 1,001 | ± 3.1% | 39% | 21% | 17% | 15% |
| HarrisX | Apr 28–29, 2019 | 1,002 | ± 3.1% | 37% | 24% | 19% | 13% |
| HarrisX | Mar 31 – Apr 1, 2019 | 1,000 | ± 3.1% | 38% | 25% | 16% | 15% |
| HarrisX | Mar 17–18, 2019 | 1,001 | ± 3.1% | 36% | 26% | 14% | 17% |
John Hickenlooper
| Poll source | Date(s) administered |
Sample size[lower-alpha 2] |
Margin of error |
Donald Trump (R) |
John Hickenlooper (D) |
Other | Undecided |
|---|---|---|---|---|---|---|---|
| HarrisX | Jul 26–27, 2019 | 1,001 (RV) | – | 37% | 27% | 22%[lower-alpha 412] | 14% |
| HarrisX | Jun 23–24, 2019 | 1,001 (RV) | ± 3.1% | 37% | 27% | 23%[lower-alpha 413] | 13% |
| HarrisX | May 26–27, 2019 | 1,003 | ± 3.1% | 37% | 26% | 16% | 16% |
| HarrisX | Apr 30 – May 1, 2019 | 1,000 | ± 3.1% | 39% | 25% | 17% | 13% |
| HarrisX | Apr 3–4, 2019 | 1,002 | ± 3.1% | 37% | 25% | 15% | 15% |
| HarrisX | Mar 19–20, 2019 | 1,001 | ± 3.1% | 35% | 28% | 13% | 16% |
Mike Gravel
| Poll source | Date(s) administered |
Sample size[lower-alpha 2] |
Margin of error |
Donald Trump (R) |
Mike Gravel (D) |
Other | Undecided |
|---|---|---|---|---|---|---|---|
| HarrisX | Jul 26–27, 2019 | 1,001 (RV) | – | 37% | 25% | 25%[lower-alpha 414] | 14% |
| HarrisX | Jun 23–24, 2019 | 1,001 (RV) | ± 3.1% | 38% | 24% | 25%[lower-alpha 415] | 13% |
| HarrisX | May 25–26, 2019 | 1,001 | ± 3.1% | 39% | 21% | 20% | 14% |
| HarrisX | Apr 28–29, 2019 | 1,002 | ± 3.1% | 38% | 22% | 20% | 13% |
Eric Swalwell
| Poll source | Date(s) administered |
Sample size[lower-alpha 2] |
Margin of error |
Donald Trump (R) |
Eric Swalwell (D) |
Other | Undecided |
|---|---|---|---|---|---|---|---|
| HarrisX | Jun 23–24, 2019 | 1,001 | ± 3.1% | 38% | 25% | 24%[lower-alpha 416] | 13% |
| HarrisX | May 26–27, 2019 | 1,003 | ± 3.1% | 37% | 25% | 18% | 14% |
| HarrisX | Apr 30 – May 1, 2019 | 1,000 | ± 3.1% | 39% | 25% | 17% | 14% |
Hypothetical polling
The scenarios contained in the collapsed table below include candidates who have explicitly declined to run, candidates who have not been the subject of speculation regarding a potential candidacy, and generic Democratic and independent opponents. Hypotheticals are also included involving withdrawn candidates.
Hypothetical polling | |||||||||||||||||||||||||||||||||||||||||||||||||||||||||||||||||||||||||||||||||||||||||||||||||||||||||||||||||||||||||||||||||||||||||||||||||||||||||||||||||||||||||||||||||||||||||||||||||||||||||||||||||||||||||||||||||||||||||||||||||||||||||||||||||||||||||||||||||||||||||||||||||||||||||||||||||||||||||||||||||||||||||||||||||||||||||||||||||||||||||||||||||||||||||||||||||||||||||||||||||||||||||||||||||||||||||||||||||||||||||||||||||||||||||||||||||||||||||||||||||||||||||||||||||||||||||||||||||||||||||||||||||||||||||||||||||||||||||||||||||||||||||||||||||||||||||||||||||||||||||||||||||||||||||||||||||||||||||||||||||||||||||||||||||||||||||||||||||||||||||||||||||||||||||||||||||||||||||||||||||||||||||||||||||||||||||||||||||||||||||||||||||||||||||||||||||||||||||||||||||||||||||||||||||||||||||||||||||||||||||||||||||||||||||||||||||||||||||||||||||||||||||||||||||||||||||||||||||||||||||||||||||||||||||||||||||||||||||||||||||||||||||||||||||||||||||||||||||||||||
|---|---|---|---|---|---|---|---|---|---|---|---|---|---|---|---|---|---|---|---|---|---|---|---|---|---|---|---|---|---|---|---|---|---|---|---|---|---|---|---|---|---|---|---|---|---|---|---|---|---|---|---|---|---|---|---|---|---|---|---|---|---|---|---|---|---|---|---|---|---|---|---|---|---|---|---|---|---|---|---|---|---|---|---|---|---|---|---|---|---|---|---|---|---|---|---|---|---|---|---|---|---|---|---|---|---|---|---|---|---|---|---|---|---|---|---|---|---|---|---|---|---|---|---|---|---|---|---|---|---|---|---|---|---|---|---|---|---|---|---|---|---|---|---|---|---|---|---|---|---|---|---|---|---|---|---|---|---|---|---|---|---|---|---|---|---|---|---|---|---|---|---|---|---|---|---|---|---|---|---|---|---|---|---|---|---|---|---|---|---|---|---|---|---|---|---|---|---|---|---|---|---|---|---|---|---|---|---|---|---|---|---|---|---|---|---|---|---|---|---|---|---|---|---|---|---|---|---|---|---|---|---|---|---|---|---|---|---|---|---|---|---|---|---|---|---|---|---|---|---|---|---|---|---|---|---|---|---|---|---|---|---|---|---|---|---|---|---|---|---|---|---|---|---|---|---|---|---|---|---|---|---|---|---|---|---|---|---|---|---|---|---|---|---|---|---|---|---|---|---|---|---|---|---|---|---|---|---|---|---|---|---|---|---|---|---|---|---|---|---|---|---|---|---|---|---|---|---|---|---|---|---|---|---|---|---|---|---|---|---|---|---|---|---|---|---|---|---|---|---|---|---|---|---|---|---|---|---|---|---|---|---|---|---|---|---|---|---|---|---|---|---|---|---|---|---|---|---|---|---|---|---|---|---|---|---|---|---|---|---|---|---|---|---|---|---|---|---|---|---|---|---|---|---|---|---|---|---|---|---|---|---|---|---|---|---|---|---|---|---|---|---|---|---|---|---|---|---|---|---|---|---|---|---|---|---|---|---|---|---|---|---|---|---|---|---|---|---|---|---|---|---|---|---|---|---|---|---|---|---|---|---|---|---|---|---|---|---|---|---|---|---|---|---|---|---|---|---|---|---|---|---|---|---|---|---|---|---|---|---|---|---|---|---|---|---|---|---|---|---|---|---|---|---|---|---|---|---|---|---|---|---|---|---|---|---|---|---|---|---|---|---|---|---|---|---|---|---|---|---|---|---|---|---|---|---|---|---|---|---|---|---|---|---|---|---|---|---|---|---|---|---|---|---|---|---|---|---|---|---|---|---|---|---|---|---|---|---|---|---|---|---|---|---|---|---|---|---|---|---|---|---|---|---|---|---|---|---|---|---|---|---|---|---|---|---|---|---|---|---|---|---|---|---|---|---|---|---|---|---|---|---|---|---|---|---|---|---|---|---|---|---|---|---|---|---|---|---|---|---|---|---|---|---|---|---|---|---|---|---|---|---|---|---|---|---|---|---|---|---|---|---|---|---|---|---|---|---|---|---|---|---|---|---|---|---|---|---|---|---|---|---|---|---|---|---|---|---|---|---|---|---|---|---|---|---|---|---|---|---|---|---|---|---|---|---|---|---|---|---|---|---|---|---|---|---|---|---|---|---|---|---|---|---|---|---|---|---|---|---|---|---|---|---|---|---|---|---|---|---|---|---|---|---|---|---|---|---|---|---|---|---|---|---|---|---|---|---|---|---|---|---|---|---|---|---|---|---|---|---|---|---|---|---|---|---|---|---|---|---|---|---|---|---|---|---|---|---|---|---|---|---|---|---|---|---|---|---|---|---|---|---|---|---|---|---|---|---|---|---|---|---|---|---|---|---|---|---|---|---|---|---|---|---|---|---|---|---|---|---|---|---|---|---|---|---|---|---|---|---|---|---|---|---|---|---|---|---|---|---|---|---|---|---|---|---|---|---|---|---|---|---|---|---|---|---|---|---|---|---|---|---|---|---|---|---|---|---|---|---|---|---|---|---|---|---|---|---|---|---|---|---|---|---|---|---|---|---|---|---|---|---|---|---|---|---|---|---|---|---|---|---|---|---|---|---|---|---|---|---|---|---|---|---|---|---|---|---|---|---|---|---|---|---|---|---|---|---|---|---|---|---|---|---|---|---|---|---|---|---|---|---|---|---|---|---|---|---|---|---|---|---|---|---|---|---|---|---|---|---|---|---|---|---|---|---|---|---|---|---|---|---|---|---|---|---|---|---|---|---|---|---|---|---|---|---|---|---|---|---|---|---|---|---|---|---|---|---|---|---|
|
See also
- Statewide opinion polling for the 2020 United States presidential election
- Nationwide opinion polling for the 2020 Democratic Party presidential primaries
- Statewide opinion polling for the 2020 Democratic Party presidential primaries
- Opinion polling for the 2020 Republican Party presidential primaries
- 2020 Democratic National Convention
- 2020 Republican National Convention
- Opinion polling on the Donald Trump administration
Notes
- Calculated by taking the difference of 100% and all other candidates combined.
- Key:
A – all adults
RV – registered voters
LV – likely voters
V – unclear - "Some other candidate" with 6%
- "Other" with 4%; would not vote with 1%
- "A different candidate" with 5%
- "Other" with 5%; would not vote with 4%
- "Some other candidate" with 8%; would not vote with 2%
- "Other" with 4%; would not vote with 2%
- "Another candidate" with 3%; "would not vote" with 2%
- 92% of a sample of 1,886 registered voters
- "Other" with 3%; would not vote with 2%
- "Other" with 5%; would not vote with 2%
- "No answer" with 4%
- Additional data sourced from FiveThirtyEight
- "Some other candidate" with 8%; would not vote with 2%
- Would not vote with 6.1%
- "Someone else" with 3%; would not vote with 1%
- "Someone else" with 3%; would not vote and "refused" with 1%
- Additional data sourced from FiveThirtyEight
- Would not vote with 5.5%
- "Third party candidate" with 4%; would not vote with 1%
- "Other" with 3%; would not vote with 2%
- Includes would not vote
- Would not vote with 4.8%
- "Neither/other" with 7.3%
- Would not vote with 5%
- "Some other candidate" with 9%
- "Neither" with 2%; "other" with 1%
- Would not vote with 13%; "Third party candidate" with 6%
- "Other" and would not vote with 4%
- "Someone else" with 7%
- Additional data sourced from FiveThirtyEight
- "A different candidate" with 6.22%
- Jorgensen with 2%; "some other candidate" with 1%
- Includes would not vote
- "Other" with 5%; would not vote with 3%
- "Neither/other" with 5%
- Would not vote with 4.7%
- "Someone else/third party" with 4%; would not vote with 0%
- "Other" with 5%; "no one" with 1%
- Additional data sourced from FiveThirtyEight
- "Third party candidate" with 5%; would not vote with 1%
- "Some other candidate" with 7%
- Would not vote with 4.9%
- "Other" and "Neither" with 1%; would not vote with 0%
- "Other candidate" with 6%; would not vote with 3%
- "Some other candidate" with 6%; would not vote with 2%
- Additional data sourced from FiveThirtyEight
- "A different candidate" with 4.52%
- Additional data sourced from FiveThirtyEight
- "Other" with 5%; would not vote with 3%
- Would not vote with 4.1%
- Would not vote with 3.4%
- "Third party candidate" with 4%; would not vote with 2%
- "Other" with 4%; would not vote with 2%
- "Some other candidate" with 5%; would not vote with 2%
- "Other" with 4%; would not vote with 2%
- Would not vote with 7%
- "Someone else" with 2%; would not vote with 2%
- "Refused" with 3%; "someone else" and would not vote with 1%
- Amash with 3%; "Other" with 5%
- "Would not vote" with 7%
- "Other" with 5%; would not vote with 4%
- "Other" with 4%; would not vote with 2%
- Would not vote with 4.7%
- "Other" and "neither" with 1%
- Includes "refused"
- Standard VI response
- "Third party/write-in" with 4%; would not vote with no voters
- Voting intention for an exclusively vote-by-mail election
- "Third party/write-in" with 4%; would not vote with no voters
- "Some other candidate" with 7%
- Would not vote with 5.5%
- "Other" with 5%; would not vote with 4%
- "Third party candidate" with 5%; would not vote with 2%
- "Some other candidate" with 7%; would not vote with 2%
- "Other" with 4%; would not vote with 3%
- "Someone else" with 7%
- "Would not vote" with 4%
- Standard VI response
- "Other candidate" with 3%; "no one" with 1%
- With Justin Amash
- Justin Amash with 5%; "Other candidate" with 1%; "no one" with 1%
- Would not vote with 3%
- "Third party candidate" with 6%; would not vote with 1%
- Additional data sourced from FiveThirtyEight
- "Some other candidate" with 7%
- Would not vote with 5.2%
- "Someone else/third party" with 4%; would not vote with 0%
- "Other" with 7%; would not vote with 2%
- "Other" with 4%; would not vote with 2%
- Figures calculated as decided voters + leaners
- "Would not vote" with 5.5%
- "Some other candidate" with 6%
- "Third party candidate" with 8%; "refused" with 1%
- "Would not vote" with 4%
- "Would vote for a third party/write-in candidate" with 2%; would not vote with no voters
- "Other" with 3%; would not vote with 2%
- "Some other candidate" with 6%; would not vote with 2%
- "Other" with 5%; would not vote with 4%
- Additional data sourced from FiveThirtyEight
- "A third party candidate" with 6%; would not vote with 0%
- "Some other candidate" with 5%
- "Would not vote" with 3.5%
- Justin Amash with 1%; "Someone else" with 5%; "Would not vote" with 6%
- "Someone else" with 5%; "Would not vote" with 5%
- Vote shares listed as proportion of decided voters for candidate X + proportion of leaners for candidate X * proportion of voters who are leaners
- "Third party candidate" with 6%; would not vote with 1%
- "Other" with 3%; would not vote with 2%
- "Would not vote" with 4%
- Additional data sourced from FiveThirtyEight
- Additional data sourced from FiveThirtyEight
- Would not vote with 4%
- "Third party candidate" with 4%; "Would not vote" with 2%
- "Other" with 4%; would not vote with 2%
- "Other candidate" with 5%; "No one" with 1%
- Other with 0%; “neither” with 2%
- "Neither/other" with 4%
- "Not sure" with 9%; "Depends" with 4%
- "Someone else" with 3%; wouldn't vote with 2%
- "Third party candidate" with 2%
- Additional data sourced from FiveThirtyEight
- Would not vote with 6%
- "Other" with 9%; would not vote with 0%
- "Other" with 5%; "prefer not to answer" with 1%
- "Other" with 4%; would not vote with 3%
- Additional data sourced from FiveThirtyEight
- Would not vote with 6.1%
- "Third party candidate" with 3%; would not vote with 2%
- "Other" with 4%; would not vote with 2%
- Would not vote with 9%
- Percentages calculated as listed percentage in sample without undecided voters * Percentage of voters who are not undecided
- "Would vote for a third party/write-in candidate" with 4%
- "Other" with 4%; would not vote with 2%
- "Neither/other" with 7%; would not vote with 4%
- Listed as "don't know/refused"
- "Third party candidate" with 4%; would not vote with 3%
- "Other" with 2%; would not vote with 3%
- "Neither/other" with 8%; wouldn't vote with 2%
- Listed as "don't know/refused"
- "Someone else" with 1%; wouldn't vote with 2%
- "Other" with 0%; "neither" with 1%
- "Other" with 1%; "refused" with 1%
- "Third party candidate" with 5%; would not vote with 1%
- "Other" with 2%; "would not vote with" 4%
- Additional data sourced from FiveThirtyEight
- Not yet released
- Not yet released
- "Someone else/third party" with 4%; "would not vote with" 1%
- "Other" with 0%; "Neither" with 2%; "would not vote with" 1%
- "Neither/other" with 10%; would not vote with 2%
- Listed as "don't know/refused"
- "Neither/other" with 8%; "would not vote with" 3%
- Includes "refused"
- "Someone else" with 2%; wouldn't vote with 3%
- Sample size for registered voters sourced from FiveThirtyEight
- Other with 1%; refused with 1%
- "Neither/other" with 4%
- "Some other party's candidate" with 6%
- Other with 0%; neither with 2%; would not vote with 1%
- Other with 6%; would not vote with 2%
- Other with 0%; “neither” with 1%
- Other with 2%; refused with 1%
- "Neither/other" with 10%; wouldn't vote with 7%
- "Neither/other" with 12%; wouldn't vote with 8%
- Other with 2%; refused with 1%
- "Someone else" with 2%; wouldn't vote with 2%
- "Neither" with 2%; would not vote with 2%; other with 0%
- Other with 5%; would not vote with 2%
- "Neither/other" with 6%
- Neither with 2%
- Listed as "no opinion"
- Wouldn't vote with 3%; neither/other with 6%
- Includes "refused"
- Other with 5%; would not vote with 6%
- 7% said they'd probably (as opposed to definitely) vote for Trump
- 12% said they'd probably (as opposed to definitely) vote for Biden
- "Someone else" with 13%; "Wouldn't vote" with 6%; no answer with 1%
- See Biden and Trump notes
- Other with 7%; would not vote with 5%
- Other with 8%; would not vote with 3%
- "Libertarian Party candidate"
- "Green Party candidate"
- "Would not vote"
- "Libertarian Party candidate"
- "Green Party candidate"
- "Would not vote"
- "Libertarian Party candidate"
- "Green Party candidate"
- "Would not vote"
- "Third party candidate" with 4%; would not vote with 4%
- "Other" with 3%; would not vote with 2%
- "Third party candidate" with 8%; would not vote with 0%
- "Other" with 6%; "prefer not to answer" with 1%
- "Other" with 4%; would not vote with 2%
- "Someone else" with 9%; would not vote with 2%
- "Third party candidate" with 4%; would not vote with 2%
- "Other" with 4%; would not vote with 2%
- "Neither/other" with 9%; would not vote with 6%
- Listed as "don't know/refused"
- Would not vote with 7%
- Percentages calculated as listed percentage in sample without undecided voters * Percentage of voters who are not undecided
- "Would vote for a third party/write-in candidate" with 3%
- "Other" with 3%; would not vote with 2%
- "Neither/other" with 6%; would not vote with 3%
- Listed as "don't know/refused"
- "Third party candidate" with 4%; would not vote with 4%
- "Other" with 2%; would not vote with 3%
- "Neither/other" with 8%; wouldn't vote with 2%
- Listed as "don't know/refused"
- "Someone else" with 2%; wouldn't vote with 3%
- "Other" with 0%; "neither" with 2%
- "Other" with 2%; "refused" with 0%
- "Third party candidate" with 4%; would not vote with 2%
- "Other" with 2%; would not vote with 3%
- Additional data sourced from FiveThirtyEight
- Not yet released
- Not yet released
- "Someone else/third party" with 3%; "would not vote with" 1%
- "Other" with no voters; "Neither" with 3%; would not vote with 1%
- Would not vote with 4%
- "Neither/other" with 9%; would not vote with 2%
- Listed as "don't know/refused"
- "Neither/other" with 9%; would not vote with 2%
- Includes "refused"
- "Someone else" with 1%; wouldn't vote with 2%
- Sample size for registered voters sourced from FiveThirtyEight
- Other with 2%; refused with 1%
- "Neither/other" with 5%
- "Some other party's candidate" with 8%
- Other with 0%; neither with 2%; would not vote with 1%
- Other with 5%; would not vote with 2%
- Other with 0%; “neither” with 2%
- Responses to the question: “If the 2020 U.S. Presidential election was held today, who would you vote for if the candidates were Bernie Sanders and Donald Trump?”
- Sample size sourced from FiveThirtyEight
- Data not yet released
- Responses to the question: “If the 2020 U.S. Presidential election was held today, who would you vote for if the candidates were Democrat Bernie Sanders and Republican Donald Trump?”
- Sample size sourced from FiveThirtyEight
- Data not yet released
- Responses to the question: " “If the 2020 U.S. Presidential election was held today, who would you vote for if the candidates were Democrat Bernie Sanders, who wants to tax the billionaire class to help the working class and Republican Donald Trump, who says Sanders is a socialist who supports a government takeover of healthcare and open borders?”"
- Data not yet released
- Data not yet released
- Other with 2%; refused with 1%
- "Neither/other" with 9%; wouldn't vote with 6%
- "Neither/other" with 10%; wouldn't vote with 8%
- Other with 3%; refused with 1%
- "Someone else" with 2%; wouldn't vote with 2%
- "Neither" with 2%; would not vote with 1%; other with 0%
- Other with 5%; would not vote with 1%
- Other with 1%; neither with 2%
- Listed as "no opinion"
- Wouldn't vote with 2%; neither/other with 8%
- Includes "refused"
- Other with 10%; would not vote with 6%
- Other with 11%; would not vote with 4%
- Other with 10%; would not vote with 3%
- Other with 10%; would not vote with 7%
- Other with 17%; would not vote with 6%
- Other with 19%; would not vote with 5%
- "Other" with 2%; "refused" with 1%
- "Third party candidate" with 5%; would not vote with 1%
- "Other" with 3%; "would not vote with" 4%
- Additional data sourced from FiveThirtyEight
- Not yet released
- Not yet released
- "Someone else/third party" with 3%; "would not vote with" 1%
- "Other" with 0%; "Neither" with 2%; "would not vote with" 1%
- "Neither/other" with 11%; would not vote with 2%
- Listed as "don't know/refused"
- "Neither/other" with 10%; would not vote with 2%
- Includes "refused"
- "Someone else" with 2%; wouldn't vote with 2%
- Sample size for registered voters sourced from FiveThirtyEight
- Other with 3%; refused with 1%
- "Neither/other" with 5%
- "Some other party's candidate" with 9%
- Other with 0%; neither with 2%; would not vote with 2%
- Other with 6%; would not vote with 3%
- Other with 0%; “neither” with 3%
- Other and refused with 2%
- "Neither/other" with 10%; wouldn't vote with 7%
- "Neither/other" with 12%; wouldn't vote with 8%
- Other with 3%; refused with 2%
- "Someone else" with 2%; wouldn't vote with 2%
- "Neither" with 2%; would not vote with 2%; other with 0%
- Other with 7%; would not vote with 2%
- "Neither/other" with 3%
- Wouldn't vote with 3%; neither/other with 8%
- Includes "refused"
- Neither with 3%
- Listed as "no opinion"
- Other with 8%; would not vote with 7%
- 7% said they'd probably (as opposed to definitely) vote for Trump
- 9% said they'd probably (as opposed to definitely) vote for Warren
- "Someone else" with 17%; "Wouldn't vote" with 6%; no answer with 1%
- See Warren and Trump notes
- Other with 10%; would not vote with 5%
- Other with 12%; would not vote with 4%
- "Other" with 2%; "refused" with 1%
- "Third party candidate" with 7%; would not vote with 2%
- "Other" with 2%; would not vote with 5%
- Additional data sourced from FiveThirtyEight
- Not yet released
- "Someone else/third party" with 6%; "would not vote with" 1%
- "Neither/other" with 8%; would not vote with 3%
- "Other" with 0%; "Neither" with 2%; would not vote with 1%
- "Neither/other" with 7%; would not vote with 3%
- Includes "refused"
- "Someone else" with 2%; wouldn't vote with 3%
- Sample size for registered voters sourced from FiveThirtyEight
- Other with 2%; refused with 1%
- Other with 1%; neither with 2%; would not vote with 1%
- Other with 5%; would not vote with 2%
- Other with 1%; “neither” with 2%
- Other with 3%; refused with 2%
- "Neither/other" with 12%; wouldn't vote with 7%
- Other with 4%; refused with 1%
- "Someone else" with 2%; wouldn't vote with 3%
- "Other" with 2%; "refused" with 1%
- "Other" with 3%; would not vote with 4%
- Additional data sourced from FiveThirtyEight
- Data not yet released
- Data not yet released
- "Someone else/third party" with 5%; "would not vote with" 1%
- "Neither/other" with 12%; would not vote with 2%
- "Other" with 0%; "Neither" with 3%; would not vote with 1%
- "Someone else" with 2%; wouldn't vote with 2%
- "Some other party's candidate" with 11%
- Other with 0%; neither with 2%; would not vote with 2%
- Other with 7%; would not vote with 3%
- Other with 0%; “neither” with 3%
- "Someone else" with 2%; wouldn't vote with 2%
- Other with 13%; would not vote with 7%
- Other with 13%; would not vote with 7%
- Other with 13%; would not vote with 4%
- "Other" with 2%; would not vote with 1%
- "Third party candidate" with 5%; would not vote with 2%
- "Other" with 3%; would not vote with 5%
- Additional data sourced from FiveThirtyEight
- Data not yet released
- Data not yet released
- "Someone else/third party" with 5%; "would not vote with" 1%
- Would not vote with 1%
- "Other" with 1%; "Neither" with 3%; would not vote with 1%
- "Neither/other" with 9%; would not vote with 2%
- Listed as "don't know/refused"
- "Neither/other" with 9%; would not vote with 3%
- Includes "refused"
- "Someone else" with 2%; wouldn't vote with 3%
- Sample size for registered voters sourced from FiveThirtyEight
- Other with 3%; refused with 1%
- "Neither/other" with 6%
- "Some other party's candidate" with 10%
- Other with 0%; neither with 3%; would not vote with 2%
- Other with 0%; “neither” with 3%
- Other and refused with 2%
- "Neither/other" with 11%; wouldn't vote with 9%
- Other with 3%; refused with 2%
- "Someone else" with 2%; wouldn't vote with 2%
- "Neither" with 3%; would not vote with 2%; other with 1%
- Other with 9%; would not vote with 2%
- Other with 1%; neither with 3%
- Listed as "no opinion"
- Other with 10%; would not vote with 8%
- Other with 13%; would not vote with 5%
- Other with 11%; would not vote with 4%
- Other with 13%; would not vote with 7%
- Other with 11%; would not vote with 7%
- Other with 16%; would not vote with 6%
- Other with 14%; would not vote with 6%
- Other with 17%; would not vote with 5%
- Other with 18%; would not vote with 5%
- Other with 12%; would not vote with 8%
- Other with 12%; would not vote with 6%
- Other with 17%; would not vote with 6%
- Other with 18%; would not vote with 5%
- Other with 12%; would not vote with 6%
- Other with 16%; would not vote with 6%
- Other with 18%; would not vote with 6%
- Other with 11%; would not vote with 7%
- Other with 12%; would not vote with 5%
- Other with 13%; would not vote with 5%
- Other with 13%; would not vote with 7%
- Other with 17%; would not vote with 5%
- Other with 18%; would not vote with 5%
- Other with 13%; would not vote with 7%
- Other with 15%; would not vote with 5%
- Other with 14%; would not vote with 6%
- Would not vote with 3%; "Neither" with 2%; other with 0%
- Other with 10%; would not vote with 7%
- Other with 11%; would not vote with 5%
- Other with 12%; would not vote with 4%
- Other with 13%; would not vote with 6%
- Other with 16%; would not vote with 6%
- Other with 18%; would not vote with 5%
- Other with 15%; would not vote with 6%
- Other with 18%; would not vote with 6%
- Other with 19%; would not vote with 5%
- Other with 11%; would not vote with 8%
- Other with 14%; would not vote with 5%
- Other with 12%; would not vote with 4%
- Other with 13%; would not vote with 7%
- Other with 17%; would not vote with 6%
- Other with 19%; would not vote with 6%
- Other with 10%; would not vote with 6%
- Other with 14%; would not vote with 6%
- Other with 15%; would not vote with 5%
- Other with 17%; would not vote with 6%
- Other with 19%; would not vote with 5%
- Other with 16%; would not vote with 5%
- Other with 19%; would not vote with 5%
- Other with 17%; would not vote with 5%
- Other with 17%; would not vote with 6%
- Other with 18%; would not vote with 7%
- Other with 20%; would not vote with 6%
- Other with 18%; would not vote with 5%
- Additional data sourced from FiveThirtyEight
- Other with 3%; refused with 2%
- Other with 4%; would not vote with 2%
- Additional data sourced from FiveThirtyEight
- Not yet released, but poll published on Feb 3, 2019
- Barack Obama is ineligible to run for president due to the Twenty-second Amendment to the United States Constitution
- Ocasio-Cortez is ineligible to run for president until the 2024 Presidential election due to not meeting the minimum age requirement set out in Article II, Section 1, Clause 5 of the Constitution of the United States
- Not yet released, but poll published on Feb 3, 2019
- Percentages listed as a combination of decided voters + leaners * proportion of voters who are undecided
- Would not vote with 10%
- "Someone else" with 8%
- "Someone else" with 10%
- "Someone else" with 8%
- "Someone else" with 9%
- 92% of a sample of 1,886 registered voters
- "Independent or other candidate" with 8%
- Includes "other"
- "Independent or other candidate" with 6%
- Includes "other"
- "Independent or other candidate" with 7%
- Includes "other"
- Would not vote with 2%
- Would not vote with 2%
- "Would vote for independent or other candidate" with 6%
- Would not vote with 1%
- Would not vote with 2%
- Would not vote with 2%
- "Would vote for independent or other candidate" with 6%
- Would not vote with 2%
- Would not vote with 3%
- Would not vote with 2%
- Would not vote with 2%
- "Would vote for independent or other candidate" with 7%
- Would not vote with 3%
- Would not vote with 2%
- No answer with 0%
- Would not vote with 2%
- Would not vote with 3%
- Not yet released
- "Independent or other candidate" with 8%
- Includes "other"
- Would not vote with 2%
- Includes 'other', but not 'will vote for independent and/or other candidate'
- Includes 'other', but not 'will vote for independent and/or other candidate'
- Would not vote with 5%
- Includes 'other', but not 'will vote for independent and/or other candidate'
- No answer with 0%
- Includes 'other', but not 'will vote for independent and/or other candidate'
- "Third-party candidate" with 10%
- Includes 'other', but not 'will vote for independent and/or other candidate'
- Percentage listed as a % of respondents who said they'd definitely vote for the Democratic nominee as a proportion of respondents who said they would definitely not vote for Trump
- "Definitely not Trump and definitely not the Democratic candidate" with 2%
- "Definitely not voting for Trump, but waiting to see the Democratic nominee before deciding whether to vote for them" with 36%; "Would consider voting for Trump" with 14%; "No opinion" with 3%; "No opinion besides definitely not voting for Trump" with 1%
- Listed as "Someone else should be in office" looking ahead to the 2020 presidential election, as opposed to "Trump should be re-elected"
- "Would probably or definitely vote for someone other than Trump" with 55%
- Would not vote with 2%
- Additional data sourced from FiveThirtyEight
- "Will definitely not vote for Trump" with 51%
- "Would consider voting for Trump" with 13%; "Don't know/no answer" with 3%
- "Would never consider voting for Trump" with 46%
- "Would consider voting for Trump" with 54%
- "Would definitely not consider voting for Trump" with 56%
- "Would consider voting for Trump" with 14%; "No opinion" with 1%
- Listed as "Someone else"
- Would not vote with 3%
- Partisan clients
- Poll sponsored by Protect Our Care, a pro-Affordable Care Act Organisation
- This poll was sponsored by the Senate Majority PAC, which supports Democratic Senate candidates, and Priorities USA, a Democratic super PAC
- The poll's sponsor is a pro-Affordable Care Act organisation
- By the time of the poll's sampling dates, Data for Progress had endorsed the Elizabeth Warren 2020 presidential campaign
- Poll sponsored by the Progressive Change Campaign Committee (PCCC)
- An internal poll released by Schultz prior to him ruling out a 2020 presidential bid
- An internal poll released by Schultz prior to him ruling out a 2020 presidential bid
- Poll sponsored by Protect Our Care
- Poll sponsored by Priorities USA Action