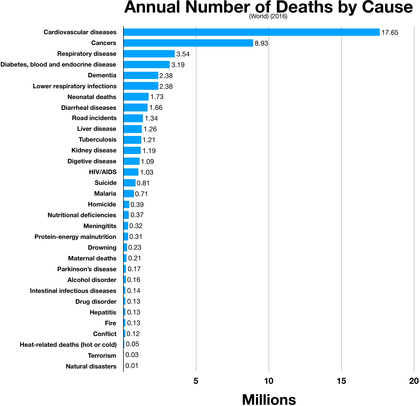
List of causes of death by rate
The following is a list of the causes of human deaths worldwide for different years arranged by their associated mortality rates. There were 57,029,000 deaths tabulated in 2002. Some causes listed include deaths also included in more specific subordinate causes (as indicated by the "Group" column), and some causes are omitted, so the percentages do not sum to 100. According to the World Health Organization, about 58 million people died in 2005, using the International Statistical Classification of Diseases and Related Health Problems (ICD).[1] According to the Institute for Health Metrics and Evaluation, 52.77 million people died in 2010.[2]
The causes listed are relatively immediate medical causes, but the ultimate cause of death might be described differently. For example, tobacco smoking can cause lung disease or cancer, and alcohol abuse can cause liver failure or a motor vehicle accident. For statistics on preventable ultimate causes, see preventable causes of death.
By frequency
Age standardized death rate, per 100,000, by cause, in 2017, and percentage change 2007–2017.[3]
| Cause | Rate | Percent of all deaths | Percent Change 2007–2017 |
|---|---|---|---|
| All causes | 737.7 (729.9 to 745.4) | 100% | -14.2 (-15.0 to -13.5) |
| Communicable, maternal, neonatal, and nutritional disorders | 143.8 (138.4 to 151.6) | 19.49% | -31.8 (-33.3 to -30.1) |
| HIV/AIDS and sexually transmitted infections | 13.9 (12.6 to 15.5) | 1.88% | -53.6 (-55.8 to -51.0) |
| HIV/AIDS | 12.1 (11.5 to 12.9) | 1.64% | -56.5 (-58.0 to -54.7) |
| HIV/AIDS – Drug-susceptible Tuberculosis | 2.5 (1.8 to 3.2) | 0.34% | -61.1 (-63.7 to -57.7) |
| HIV/AIDS – Multidrug-resistant Tuberculosis without extensive drug resistance | 0.3 (0.2 to 0.4) | 0.04% | -58.1 (-70.5 to -41.5) |
| HIV/AIDS – Extensively drug-resistant Tuberculosis | 0.0 (0.0 to 0.0) | 0.00% | -20.3 (-36.4 to -0.2) |
| HIV/AIDS resulting in other diseases | 9.3 (8.4 to 10.4) | 1.26% | -55.1 (-57.2 to -52.6) |
| Sexually transmitted infections excluding HIV | 1.8 (0.7 to 3.3) | 0.24% | -14.4 (-21.5 to -6.6) |
| Syphilis | 1.7 (0.7 to 3.2) | 0.23% | -14.3 (-21.8 to -6.4) |
| Chlamydial infection | 0.0 (0.0 to 0.0) | 0.00% | -15.2 (-21.0 to -8.4) |
| Gonococcal infection | 0.0 (0.0 to 0.0) | 0.00% | -14.9 (-20.8 to -8.2) |
| Other sexually transmitted infections | 0.0 (0.0 to 0.0) | 0.00% | -15.9 (-21.6 to -9.5) |
| Respiratory infections and tuberculosis | 50.5 (48.8 to 52.3) | 6.85% | -24.5 (-26.4 to -22.6) |
| Tuberculosis | 14.9 (14.3 to 15.7) | 2.02% | -31.4 (-34.1 to -27.6) |
| Drug-susceptible tuberculosis | 13.2 (12.0 to 14.2) | 1.79% | -31.9 (-37.3 to -26.4) |
| Multidrug-resistant tuberculosis without extensive drug resistance | 1.6 (0.9 to 2.5) | 0.22% | -28.6 (-57.4 to 11.4) |
| Extensively drug-resistant tuberculosis | 0.2 (0.1 to 0.2) | 0.03% | -7.7 (-34.1 to 28.8) |
| Lower respiratory infections | 35.4 (33.8 to 36.8) | 4.80% | -21.1 (-23.2 to -18.9) |
| Upper respiratory infections | 0.1 (0.1 to 0.2) | 0.01% | -42.1 (-49.6 to -29.9) |
| Otitis media | 0.0 (0.0 to 0.0) | 0.00% | -50.4 (-58.8 to -39.9) |
| Enteric infections | 24.4 (19.5 to 32.4) | 3.31% | -29.9 (-34.9 to -23.1) |
| Diarrhoeal diseases | 21.6 (16.4 to 29.7) | 2.93% | -30.2 (-36.1 to -22.7) |
| Typhoid and paratyphoid | 1.9 (1.1 to 3.0) | 0.26% | -27.8 (-32.8 to -23.9) |
| (Typhoid fever) | 1.6 (0.9 to 2.6) | 0.22% | -29.1 (-34.1 to -25.0) |
| (Paratyphoid fever) | 0.3 (0.1 to 0.5) | 0.04% | -18.9 (-26.1 to -10.8) |
| iNTS | 0.8 (0.5 to 1.4) | 0.11% | -24.8 (-31.9 to -15.6) |
| Other intestinal infectious diseases | 0.0 (0.0 to 0.0) | 0.00% | -44.7 (-70.1 to 2.3) |
| Neglected tropical diseases and malaria | 10.1 (7.5 to 13.2) | 1.37% | -36.1 (-43.7 to -27.3) |
| Malaria | 8.7 (6.1 to 11.9) | 1.18% | -37.3 (-45.4 to -27.9) |
| Chagas disease | 0.1 (0.1 to 0.1) | 0.01% | -21.1 (-25.2 to -14.3) |
| Leishmaniasis | 0.1 (0.0 to 0.5) | 0.01% | -67.8 (-97.5 to -50.3) |
| (Visceral leishmaniasis) | 0.1 (0.0 to 0.5) | 0.01% | -67.8 (-97.5 to -50.3) |
| African trypanosomiasis (sleeping sickness) | 0.0 (0.0 to 0.1) | 0.00% | -82.8 (-96.0 to -34.3) |
| Schistosomiasis | 0.1 (0.1 to 0.1) | 0.01% | -28.5 (-32.7 to -23.7) |
| Cysticercosis | 0.0 (0.0 to 0.0) | 0.00% | -27.3 (-50.5 to 5.3) |
| Cystic echinococcosis | 0.0 (0.0 to 0.0) | 0.00% | -41.9 (-59.8 to -19.0) |
| Dengue | 0.5 (0.2 to 0.7) | 0.07% | 40.7 (3.6 to 69.7) |
| Yellow fever | 0.1 (0.0 to 0.2) | 0.01% | -23.3 (-34.4 to -9.6) |
| Rabies | 0.2 (0.1 to 0.2) | 0.03% | -54.8 (-63.8 to -45.0) |
| Intestinal nematode infections | 0.0 (0.0 to 0.1) | 0.00% | -47.2 (-59.5 to -30.1) |
| (Ascariasis) | 0.0 (0.0 to 0.1) | 0.00% | -47.2 (-59.5 to -30.1) |
| Ebola virus disease | 0.0 (0.0 to 0.0) | 0.00% | -98.4 (-98.4 to -98.4) |
| Zika virus disease | 0.0 (0.0 to 0.0) | 0.00% | - |
| Other neglected tropical diseases | 0.2 (0.1 to 0.5) | 0.03% | -3.7 (-18.3 to 13.9) |
| Other infectious diseases | 11.6 (10.1 to 13.3) | 1.57% | -33.8 (-39.3 to -27.4) |
| Meningitis | 4.0 (3.6 to 4.6) | 0.54% | -27.8 (-33.1 to -19.3) |
| Pneumococcal meningitis | 0.6 (0.5 to 0.7) | 0.08% | -22.4 (-28.9 to -12.4) |
| H influenzae type B meningitis | 1.1 (0.9 to 1.3) | 0.15% | -40.6 (-45.8 to -33.9) |
| Meningococcal infection | 0.4 (0.4 to 0.5) | 0.05% | -37.1 (-42.6 to -29.2) |
| Other meningitis | 2.0 (1.7 to 2.3) | 0.27% | -17.3 (-23.4 to -7.5) |
| Encephalitis | 1.2 (1.1 to 1.4) | 0.16% | -14.3 (-26.5 to -0.9) |
| Diphtheria | 0.1 (0.0 to 0.1) | 0.01% | -28.6 (-58.8 to 29.2) |
| Whooping cough (pertussis) | 1.4 (0.7 to 2.4) | 0.19% | -27.1 (-57.1 to 28.8) |
| Tetanus | 0.5 (0.4 to 0.7) | 0.07% | -59.6 (-69.3 to -45.0) |
| Measles | 1.4 (0.5 to 3.1) | 0.19% | -59.3 (-64.0 to -54.4) |
| Varicella (chickenpox) and herpes zoster (shingles) | 0.2 (0.2 to 0.2) | 0.03% | -29.2 (-34.7 to -23.4) |
| Acute hepatitis | 1.6 (1.2 to 1.9) | 0.22% | -24.5 (-29.2 to -18.4) |
| Acute hepatitis A | 0.3 (0.2 to 0.3) | 0.04% | -38.7 (-46.8 to -28.6) |
| Acute hepatitis B | 1.1 (0.8 to 1.3) | 0.15% | -19.6 (-25.4 to -12.4) |
| Acute hepatitis C | 0.0 (0.0 to 0.1) | 0.00% | -32.1 (-42.4 to -19.6) |
| Acute hepatitis E | 0.2 (0.1 to 0.2) | 0.03% | -25.8 (-35.3 to -15.6) |
| Other unspecified infectious diseases | 1.1 (0.8 to 1.2) | 0.15% | -13.4 (-17.5 to -8.1) |
| Maternal and neonatal disorders | 29.5 (28.2 to 30.8) | 4.00% | -26.6 (-29.3 to -23.5) |
| Maternal disorders | 2.5 (2.3 to 2.7) | 0.34% | -30.7 (-34.8 to -26.6) |
| Maternal haemorrhage | 0.5 (0.4 to 0.6) | 0.07% | -56.4 (-62.7 to -49.3) |
| Maternal sepsis and other pregnancy related infections (e.g. Postpartum infections) | 0.3 (0.2 to 0.3) | 0.04% | -33.5 (-44.2 to -22.6) |
| Maternal hypertensive disorders | 0.4 (0.3 to 0.4) | 0.05% | -13.0 (-27.3 to 2.6) |
| Maternal obstructed labour and uterine rupture | 0.2 (0.1 to 0.2) | 0.03% | -25.2 (-41.0 to -6.3) |
| Maternal abortive outcome | 0.2 (0.2 to 0.3) | 0.03% | -15.7 (-29.3 to -0.4) |
| Ectopic pregnancy | 0.1 (0.1 to 0.2) | 0.01% | -19.2 (-46.2 to 16.8) |
| Indirect maternal deaths | 0.4 (0.4 to 0.5) | 0.05% | -12.5 (-24.0 to -1.0) |
| Late maternal deaths | 0.0 (0.0 to 0.1) | 0.00% | -9.5 (-14.7 to -4.0) |
| Maternal deaths aggravated by HIV/AIDS | 0.0 (0.0 to 0.0) | 0.00% | -32.1 (-38.4 to -25.2) |
| Other maternal disorders | 0.3 (0.3 to 0.4) | 0.04% | -16.5 (-31.2 to 1.5) |
| Neonatal disorders | 27.1 (25.8 to 28.3) | 3.67% | -26.2 (-29.1 to -22.7) |
| Neonatal preterm birth | 9.9 (9.2 to 10.9) | 1.34% | -28.1 (-33.2 to -23.6) |
| Neonatal encephalopathy due to birth asphyxia and trauma | 8.1 (7.2 to 8.8) | 1.10% | -26.5 (-32.0 to -20.2) |
| Neonatal sepsis and other neonatal infections | 3.1 (2.7 to 4.1) | 0.42% | -14.4 (-22.7 to -4.4) |
| Hemolytic disease and other neonatal jaundice | 0.7 (0.7 to 0.8) | 0.09% | -39.3 (-46.8 to -30.2) |
| Other neonatal disorders | 5.3 (4.5 to 5.8) | 0.72% | -25.7 (-31.7 to -17.8) |
| Nutritional deficiencies | 3.8 (3.5 to 4.2) | 0.52% | -33.6 (-38.1 to -26.5) |
| Protein-energy malnutrition | 3.3 (3.0 to 3.7) | 0.45% | -34.6 (-39.4 to -27.5) |
| Other nutritional deficiencies | 0.5 (0.4 to 0.6) | 0.07% | -25.8 (-31.7 to -17.5) |
| Non-communicable diseases | 536.1 (528.4 to 542.2) | 72.67% | -7.9 (-8.8 to -7.0) |
| Neoplasms | 121.2 (119.1 to 122.9) | 16.43% | -4.4 (-5.6 to -3.3) |
| Lip and oral cavity cancer | 2.4 (2.3 to 2.5) | 0.33% | 4.0 (-0.6 to 8.0) |
| Nasopharynx cancer | 0.9 (0.8 to 0.9) | 0.12% | -3.0 (-6.4 to 0.4) |
| Other pharynx cancer | 1.4 (1.3 to 1.5) | 0.19% | 7.9 (-0.3 to 14.0) |
| Oesophageal cancer | 5.5 (5.3 to 5.6) | 0.75% | -14.5 (-16.9 to -12.0) |
| Stomach cancer | 11.0 (10.8 to 11.2) | 1.49% | -17.1 (-18.8 to -15.1) |
| Colon and rectum cancer | 11.5 (11.3 to 11.8) | 1.56% | -4.3 (-7.1 to -1.8) |
| Liver cancer | 10.2 (9.8 to 10.7) | 1.38% | -2.5 (-5.6 to 2.0) |
| (Liver cancer due to hepatitis B) | 4.0 (3.7 to 4.3) | 0.54% | -6.2 (-10.0 to 0.1) |
| (Liver cancer due to hepatitis C) | 3.0 (2.8 to 3.2) | 0.41% | -2.1 (-4.9 to 1.4) |
| (Liver cancer due to alcohol use) | 1.6 (1.4 to 1.8) | 0.22% | 0.6 (-3.0 to 4.8) |
| (Liver cancer due to NASH) | 0.8 (0.8 to 0.9) | 0.11% | 7.6 (4.4 to 11.7) |
| (Liver cancer due to other causes) | 0.8 (0.7 to 0.9) | 0.11% | -0.9 (-4.2 to 3.6) |
| Gallbladder and biliary tract cancer | 2.2 (2.0 to 2.4) | 0.30% | -6.7 (-9.4 to -4.0) |
| Pancreatic cancer | 5.6 (5.5 to 5.7) | 0.76% | 4.8 (2.5 to 6.8) |
| Larynx cancer | 1.6 (1.5 to 1.6) | 0.22% | -7.7 (-10.1 to -5.2) |
| Tracheal, bronchus, and lung cancer | 23.7 (23.3 to 24.2) | 3.21% | -2.0 (-4.3 to 0.1) |
| Malignant skin melanoma | 0.8 (0.6 to 0.9) | 0.11% | -5.1 (-8.5 to -2.5) |
| Non-melanoma skin cancer | 0.8 (0.8 to 0.9) | 0.11% | 2.7 (0.0 to 4.5) |
| (Non-melanoma skin cancer (squamous-cell carcinoma)) | 0.8 (0.8 to 0.9) | 0.11% | 2.7 (0.0 to 4.5) |
| Breast cancer | 7.6 (7.4 to 8.0) | 1.03% | -2.6 (-6.9 to 0.4) |
| Cervical cancer | 3.2 (3.0 to 3.3) | 0.43% | -7.2 (-11.7 to -4.0) |
| Uterine cancer | 1.1 (1.0 to 1.1) | 0.15% | -10.4 (-12.5 to -7.7) |
| Ovarian cancer | 2.2 (2.1 to 2.3) | 0.30% | -1.0 (-3.6 to 1.6) |
| Prostate cancer | 5.5 (4.7 to 6.5) | 0.75% | -2.5 (-4.9 to 1.9) |
| Testicular cancer | 0.1 (0.1 to 0.1) | 0.01% | -9.4 (-12.6 to -5.2) |
| Kidney cancer | 1.8 (1.6 to 1.8) | 0.24% | -1.3 (-4.3 to 1.7) |
| Bladder cancer | 2.6 (2.5 to 2.7) | 0.35% | -5.4 (-7.3 to -3.4) |
| Brain and nervous system cancer | 3.1 (2.7 to 3.3) | 0.42% | 3.8 (-1.0 to 7.0) |
| Thyroid cancer | 0.5 (0.5 to 0.6) | 0.07% | -1.2 (-4.5 to 2.0) |
| Mesothelioma | 0.4 (0.4 to 0.4) | 0.05% | -3.4 (-8.4 to 0.7) |
| Hodgkin lymphoma | 0.4 (0.4 to 0.5) | 0.05% | -16.8 (-19.8 to -14.0) |
| Non-Hodgkin's lymphoma | 3.2 (3.1 to 3.2) | 0.43% | 0.1 (-2.7 to 2.4) |
| Multiple myeloma | 1.4 (1.3 to 1.5) | 0.19% | -0.4 (-3.5 to 2.4) |
| Leukaemia | 4.5 (4.1 to 4.7) | 0.61% | -9.6 (-12.2 to -7.4) |
| Acute lymphoid leukaemia | 0.7 (0.6 to 0.7) | 0.09% | -1.5 (-11.6 to 6.2) |
| Chronic lymphoid leukaemia | 0.5 (0.4 to 0.5) | 0.07% | -10.3 (-13.0 to -7.6) |
| Acute myeloid leukaemia | 1.3 (1.2 to 1.3) | 0.18% | -1.0 (-6.6 to 3.0) |
| Chronic myeloid leukaemia | 0.3 (0.3 to 0.3) | 0.04% | -19.9 (-22.2 to -17.6) |
| Other leukaemia | 1.8 (1.6 to 1.9) | 0.24% | -15.6 (-18.7 to -12.1) |
| Other malignant cancers | 4.6 (4.2 to 4.8) | 0.62% | 0.1 (-2.6 to 2.2) |
| Other neoplasms | 1.3 (1.0 to 1.6) | 0.18% | 7.4 (2.1 to 15.8) |
| Myelodysplastic, myeloproliferative, and other hematopoietic neoplasms | 1.3 (1.0 to 1.5) | 0.18% | 7.1 (1.8 to 15.3) |
| Other benign and in situ neoplasms | 0.1 (0.0 to 0.1) | 0.01% | 15.5 (4.1 to 29.2) |
| Cardiovascular diseases | 233.1 (229.7 to 236.4) | 31.60% | -10.3 (-11.4 to -9.3) |
| Rheumatic heart disease | 3.7 (3.4 to 3.9) | 0.50% | -21.3 (-25.2 to -17.8) |
| Ischaemic heart disease | 116.9 (115.1 to 119.7) | 15.85% | -9.7 (-11.0 to -8.7) |
| Stroke | 80.5 (78.9 to 82.6) | 10.91% | -13.6 (-15.0 to -12.1) |
| Ischaemic stroke | 36.6 (35.5 to 38.0) | 4.96% | -11.8 (-13.4 to -10.3) |
| Intracerebral hemorrhage | 38.2 (37.0 to 39.4) | 5.18% | -15.7 (-17.8 to -13.8) |
| Subarachnoid hemorrhage | 5.7 (5.3 to 6.3) | 0.77% | -9.4 (-13.1 to -4.9) |
| Hypertensive heart disease | 12.3 (9.0 to 13.2) | 1.67% | 7.5 (-7.3 to 16.3) |
| Non-rheumatic valvular heart disease | 2.0 (1.6 to 2.0) | 0.27% | -5.3 (-7.9 to -3.2) |
| Non-rheumatic calcific aortic valve disease | 1.4 (1.1 to 1.5) | 0.19% | -1.0 (-5.6 to 2.2) |
| Non-rheumatic degenerative mitral valve disease | 0.5 (0.4 to 0.6) | 0.07% | -14.0 (-18.1 to -8.6) |
| Other non-rheumatic valve diseases | 0.1 (0.1 to 0.1) | 0.01% | -17.8 (-28.5 to 8.0) |
| Cardiomyopathy and myocarditis | 4.8 (4.5 to 5.0) | 0.65% | -16.6 (-19.8 to -9.4) |
| Myocarditis | 0.6 (0.5 to 0.7) | 0.08% | -13.3 (-20.4 to -0.1) |
| Alcoholic cardiomyopathy | 1.1 (1.0 to 1.2) | 0.15% | -40.5 (-43.7 to -27.6) |
| Other cardiomyopathy | 3.1 (2.8 to 3.3) | 0.42% | -3.6 (-6.7 to -0.7) |
| Atrial fibrillation and flutter | 4.0 (3.9 to 4.2) | 0.54% | 2.6 (0.9 to 4.6) |
| Aortic aneurysm | 2.2 (2.1 to 2.3) | 0.30% | -8.5 (-11.2 to -5.8) |
| Peripheral vascular disease | 1.0 (0.6 to 1.7) | 0.14% | 10.5 (-6.8 to 24.1) |
| Endocarditis | 1.1 (1.0 to 1.2) | 0.15% | 1.0 (-4.0 to 5.0) |
| Other cardiovascular and circulatory diseases | 4.7 (4.4 to 5.1) | 0.64% | -7.9 (-10.9 to -5.9) |
| Chronic respiratory diseases | 51.4 (49.7 to 53.1) | 6.97% | -14.2 (-16.5 to -11.5) |
| Chronic obstructive pulmonary disease | 42.2 (40.0 to 44.2) | 5.72% | -13.6 (-16.5 to -11.0) |
| Pneumoconiosis | 0.3 (0.3 to 0.3) | 0.04% | -16.7 (-20.8 to -12.4) |
| (Silicosis) | 0.1 (0.1 to 0.2) | 0.01% | -15.5 (-23.6 to -7.4) |
| (Asbestosis) | 0.0 (0.0 to 0.1) | 0.00% | -8.3 (-14.1 to -0.4) |
| (Coal workers pneumoconiosis) | 0.0 (0.0 to 0.1) | 0.00% | -26.6 (-33.8 to -16.7) |
| (Other pneumoconiosis) | 0.0 (0.0 to 0.1) | 0.00% | -17.5 (-24.1 to -5.0) |
| Asthma | 6.3 (4.3 to 8.2) | 0.85% | -23.9 (-28.1 to -17.2) |
| Interstitial lung disease and pulmonary sarcoidosis | 1.9 (1.5 to 2.4) | 0.26% | 11.4 (4.0 to 17.9) |
| Other chronic respiratory diseases | 0.7 (0.6 to 0.8) | 0.09% | -3.2 (-8.7 to 6.7) |
| Digestive diseases | 30.3 (29.2 to 32.1) | 4.11% | -10.7 (-13.1 to -7.3) |
| Cirrhosis and other chronic liver diseases | 16.5 (15.8 to 18.1) | 2.24% | -9.7 (-14.7 to -4.6) |
| Cirrhosis and other chronic liver diseases due to hepatitis B | 4.8 (4.3 to 5.5) | 0.65% | -14.3 (-20.2 to -7.3) |
| Cirrhosis and other chronic liver diseases due to hepatitis C | 4.2 (3.9 to 4.7) | 0.57% | -8.4 (-13.0 to -3.9) |
| Cirrhosis and other chronic liver diseases due to alcohol use | 4.1 (3.7 to 4.6) | 0.56% | -8.8 (-13.2 to -3.4) |
| Cirrhosis due to NASH | 1.5 (1.3 to 1.6) | 0.20% | -1.4 (-6.3 to 3.1) |
| Cirrhosis and other chronic liver diseases due to other causes | 1.9 (1.7 to 2.1) | 0.26% | -8.6 (-13.4 to -3.8) |
| Upper digestive system diseases | 3.8 (3.6 to 4.0) | 0.52% | -21.6 (-24.8 to -17.3) |
| Peptic ulcer disease | 3.1 (3.0 to 3.3) | 0.42% | -23.5 (-26.6 to -19.7) |
| Gastritis and duodenitis | 0.7 (0.6 to 0.7) | 0.09% | -11.7 (-17.6 to -2.2) |
| Appendicitis | 0.6 (0.5 to 0.6) | 0.08% | -17.0 (-21.5 to -10.7) |
| Paralytic ileus and intestinal obstruction | 3.2 (2.7 to 3.5) | 0.43% | -5.8 (-11.0 to 0.3) |
| Inguinal, femoral, and abdominal hernia | 0.6 (0.5 to 0.7) | 0.08% | -8.9 (-12.9 to -4.2) |
| Inflammatory bowel disease | 0.5 (0.4 to 0.5) | 0.07% | -10.5 (-16.0 to -5.9) |
| Vascular intestinal disorders | 1.3 (1.2 to 1.3) | 0.18% | -10.2 (-14.2 to -6.2) |
| Gallbladder and biliary diseases | 1.5 (1.4 to 1.6) | 0.20% | -5.0 (-7.5 to -1.7) |
| Pancreatitis | 1.3 (1.1 to 1.4) | 0.18% | -5.7 (-9.0 to -1.7) |
| Other digestive diseases | 1.2 (1.1 to 1.2) | 0.16% | -7.1 (-12.1 to -2.4) |
| Neurological disorders | 43.1 (42.3 to 43.7) | 5.84% | 0.1 (-1.2 to 1.3) |
| Alzheimer's disease and other dementias | 35.4 (34.8 to 35.9) | 4.80% | 0.6 (-0.9 to 1.8) |
| Parkinson's disease | 4.6 (4.4 to 4.8) | 0.62% | 0.8 (-2.8 to 3.0) |
| Epilepsy | 1.7 (1.5 to 2.0) | 0.23% | -10.7 (-15.4 to -0.5) |
| Multiple sclerosis | 0.3 (0.2 to 0.3) | 0.04% | -3.9 (-14.5 to 0.4) |
| Motor neuron disease | 0.4 (0.4 to 0.5) | 0.05% | 1.2 (-2.4 to 4.5) |
| Other neurological disorders | 0.7 (0.7 to 0.8) | 0.09% | 2.0 (-3.9 to 6.8) |
| Mental disorders | 0.0 (0.0 to 0.0) | 0.00% | 7.5 (-1.4 to 15.9) |
| Eating disorders | 0.0 (0.0 to 0.0) | 0.00% | 7.5 (-1.4 to 15.9) |
| Anorexia nervosa | 0.0 (0.0 to 0.0) | 0.00% | 5.5 (-4.1 to 14.4) |
| Bulimia nervosa | 0.0 (0.0 to 0.0) | 0.00% | 13.5 (1.0 to 26.2) |
| Substance use disorders | 4.3 (4.1 to 4.5) | 0.58% | 2.0 (-1.0 to 5.0) |
| Alcohol use disorders | 2.3 (2.0 to 2.4) | 0.31% | -16.5 (-20.4 to -12.4) |
| Drug use disorders | 2.1 (2.0 to 2.1) | 0.28% | 34.1 (31.4 to 36.9) |
| Opioid use disorders | 1.4 (1.3 to 1.4) | 0.19% | 49.4 (42.5 to 59.2) |
| Cocaine use disorders | 0.1 (0.1 to 0.1) | 0.01% | 19.6 (9.2 to 33.0) |
| Amphetamine use disorders | 0.1 (0.0 to 0.1) | 0.01% | 8.7 (-14.0 to 20.7) |
| Other drug use disorders | 0.6 (0.5 to 0.6) | 0.08% | 11.3 (1.2 to 19.9) |
| Diabetes and kidney diseases | 33.6 (32.9 to 34.3) | 4.55% | 1.3 (-0.3 to 2.7) |
| Diabetes mellitus | 17.5 (17.1 to 17.9) | 2.37% | 1.2 (-0.7 to 3.1) |
| Diabetes mellitus type 1 | 4.3 (4.0 to 4.7) | 0.58% | -11.0 (-14.6 to -7.8) |
| Diabetes mellitus type 2 | 13.2 (12.7 to 13.7) | 1.79% | 5.9 (4.1 to 8.0) |
| Chronic kidney disease | 15.9 (15.5 to 16.3) | 2.16% | 1.5 (-0.9 to 3.2) |
| Chronic kidney disease due to diabetes mellitus type 1 | 0.9 (0.8 to 1.2) | 0.12% | -1.2 (-4.0 to 1.2) |
| Chronic kidney disease due to diabetes mellitus type 2 | 4.5 (4.0 to 5.1) | 0.61% | 4.2 (1.4 to 6.2) |
| Chronic kidney disease due to hypertension | 4.6 (4.0 to 5.2) | 0.62% | 3.2 (0.4 to 5.2) |
| Chronic kidney disease due to glomerulonephritis | 2.4 (2.1 to 2.8) | 0.33% | -1.3 (-3.2 to 0.7) |
| Chronic kidney disease due to other and unspecified causes | 3.4 (3.0 to 3.9) | 0.46% | -1.4 (-3.7 to 0.6) |
| Acute glomerulonephritis | 0.1 (0.1 to 0.2) | 0.01% | -9.5 (-14.5 to -3.5) |
| Skin and subcutaneous diseases | 1.3 (0.9 to 1.7) | 0.18% | 8.1 (2.7 to 16.5) |
| Bacterial skin diseases | 1.0 (0.6 to 1.3) | 0.14% | 12.7 (6.0 to 20.7) |
| (Cellulitis | 0.2 (0.1 to 0.3) | 0.03% | 19.6 (9.8 to 28.2) |
| (Pyoderma | 0.8 (0.5 to 0.9) | 0.11% | 10.5 (3.2 to 19.0) |
| Decubitus ulcer | 0.3 (0.2 to 0.4) | 0.04% | -5.1 (-12.2 to 9.2) |
| Other skin and subcutaneous diseases | 0.1 (0.0 to 0.1) | 0.01% | 3.3 (-3.5 to 14.4) |
| Musculoskeletal disorders | 1.6 (1.4 to 1.6) | 0.22% | -0.1 (-4.4 to 3.2) |
| Rheumatoid arthritis | 0.6 (0.5 to 0.7) | 0.08% | -5.9 (-12.9 to -1.2) |
| Other musculoskeletal disorders | 1.0 (0.9 to 1.0) | 0.14% | 3.9 (0.9 to 7.5) |
| Other non-communicable diseases | 16.3 (15.5 to 17.1) | 2.21% | -11.2 (-15.3 to -8.5) |
| Congenital anomalies | 8.7 (8.2 to 9.2) | 1.18% | -18.2 (-24.7 to -14.1) |
| Neural tube defects | 0.9 (0.7 to 1.3) | 0.12% | -16.5 (-27.6 to -4.8) |
| Congenital heart anomalies | 3.9 (3.2 to 4.6) | 0.53% | -21.8 (-28.1 to -14.1) |
| Orofacial clefts | 0.1 (0.0 to 0.1) | 0.01% | -41.9 (-55.9 to -25.1) |
| Down's syndrome | 0.4 (0.3 to 0.5) | 0.05% | -5.2 (-14.2 to 7.0) |
| Other chromosomal abnormalities | 0.3 (0.2 to 0.4) | 0.04% | 0.3 (-10.1 to 13.2) |
| Congenital musculoskeletal and limb anomalies | 0.2 (0.1 to 0.2) | 0.03% | -12.8 (-20.9 to -4.5) |
| Urogenital congenital anomalies | 0.2 (0.1 to 0.2) | 0.03% | -8.5 (-17.1 to 2.1) |
| Digestive congenital anomalies | 0.8 (0.6 to 1.1) | 0.11% | -19.3 (-29.8 to -9.8) |
| Other congenital anomalies | 2.1 (1.5 to 2.6) | 0.28% | -15.9 (-23.3 to -4.5) |
| Urinary diseases and male infertility | 3.6 (3.5 to 3.7) | 0.49% | 5.7 (2.2 to 8.5) |
| Urinary tract infections | 2.7 (2.6 to 3.0) | 0.37% | 10.9 (7.2 to 14.5) |
| Urolithiasis (Kidney stone disease) | 0.2 (0.1 to 0.2) | 0.03% | -1.2 (-9.7 to 12.9) |
| Other urinary diseases | 0.7 (0.6 to 0.8) | 0.09% | -9.9 (-15.3 to -2.2) |
| Gynecological diseases | 0.1 (0.1 to 0.1) | 0.01% | -2.6 (-13.6 to 6.0) |
| Uterine fibroids | 0.0 (0.0 to 0.0) | 0.00% | 8.1 (-14.9 to 24.7) |
| Polycystic ovarian syndrome | 0.0 (0.0 to 0.0) | 0.00% | 1.0 (-22.5 to 34.8) |
| Endometriosis | 0.0 (0.0 to 0.0) | 0.00% | -3.2 (-23.8 to 25.5) |
| Genital prolapse | 0.0 (0.0 to 0.0) | 0.00% | -24.1 (-36.0 to -13.0) |
| Other gynecological diseases | 0.1 (0.1 to 0.1) | 0.01% | -3.6 (-12.2 to 5.9) |
| Hemoglobinopathies and hemolytic anaemias | 1.4 (1.1 to 1.8) | 0.19% | -11.3 (-17.6 to -4.8) |
| Thalassemias | 0.1 (0.1 to 0.1) | 0.01% | -27.9 (-36.5 to -17.2) |
| Sickle cell disorders | 0.5 (0.3 to 0.8) | 0.07% | -3.1 (-17.6 to 10.3) |
| G6PD deficiency | 0.2 (0.2 to 0.3) | 0.03% | -7.1 (-12.1 to -1.0) |
| Other hemoglobinopathies and hemolytic anaemias | 0.6 (0.5 to 0.6) | 0.08% | -16.1 (-18.7 to -13.4) |
| Endocrine, metabolic, blood, and immune disorders | 1.9 (1.5 to 2.0) | 0.26% | 0.8 (-5.0 to 4.4) |
| Sudden infant death syndrome | 0.6 (0.3 to 1.2) | 0.08% | -20.2 (-31.2 to -4.9) |
| Injuries | 57.9 (55.9 to 59.2) | 7.85% | -13.7 (-15.1 to -12.2) |
| Transport injuries | 17.0 (16.4 to 17.4) | 2.30% | -17.0 (-19.5 to -14.9) |
| Road injuries | 15.8 (15.2 to 16.3) | 2.14% | -17.1 (-19.7 to -14.9) |
| Pedestrian road injuries | 6.2 (5.9 to 6.8) | 0.84% | -21.4 (-25.5 to -17.9) |
| Cyclist road injuries | 0.9 (0.7 to 1.0) | 0.12% | -8.8 (-14.8 to -2.5) |
| Motorcyclist road injuries | 2.9 (2.5 to 3.0) | 0.39% | -12.4 (-19.5 to -7.3) |
| Motor vehicle road injuries | 5.8 (5.4 to 6.0) | 0.79% | -15.6 (-18.6 to -12.2) |
| Other road injuries | 0.1 (0.1 to 0.2) | 0.01% | -19.4 (-24.1 to -1.3) |
| Other transport injuries | 1.2 (1.1 to 1.4) | 0.16% | -15.5 (-19.5 to -10.9) |
| Unintentional injuries | 23.8 (22.4 to 24.7) | 3.23% | -15.3 (-17.3 to -12.8) |
| Falls | 9.2 (8.5 to 9.8) | 1.25% | -2.8 (-7.4 to 3.4) |
| Drowning | 4.0 (3.8 to 4.1) | 0.54% | -27.3 (-29.6 to -24.5) |
| Fire, heat, and hot substances | 1.6 (1.3 to 1.7) | 0.22% | -22.9 (-25.4 to -17.3) |
| Poisonings | 0.9 (0.7 to 1.0) | 0.12% | -20.8 (-28.4 to -12.5) |
| (Poisoning by carbon monoxide | 0.5 (0.3 to 0.5) | 0.07% | -26.6 (-34.8 to -20.3) |
| (Poisoning by other means | 0.5 (0.4 to 0.5) | 0.07% | -14.4 (-22.4 to -3.9) |
| Exposure to mechanical forces | 1.8 (1.5 to 1.8) | 0.24% | -20.3 (-22.9 to -17.8) |
| (Unintentional firearm injuries | 0.3 (0.3 to 0.3) | 0.04% | -16.4 (-20.3 to -11.5) |
| (Other exposure to mechanical forces | 1.5 (1.2 to 1.6) | 0.20% | -21.0 (-23.7 to -18.3) |
| Adverse effects of medical treatment | 1.6 (1.4 to 1.8) | 0.22% | -6.2 (-10.0 to -2.5) |
| Animal contact | 1.1 (0.6 to 1.2) | 0.15% | -16.0 (-20.5 to -9.6) |
| (Venomous animal contact | 0.9 (0.5 to 1.1) | 0.12% | -16.0 (-21.0 to -9.7) |
| (Non-venomous animal contact | 0.1 (0.1 to 0.2) | 0.01% | -16.1 (-27.4 to -6.2) |
| Foreign body | 1.7 (1.6 to 1.8) | 0.23% | -14.1 (-17.0 to -11.6) |
| (Pulmonary aspiration and foreign body in airway | 1.6 (1.5 to 1.7) | 0.22% | -13.9 (-17.0 to -11.4) |
| (Foreign body in other body part | 0.1 (0.1 to 0.1) | 0.01% | -15.8 (-20.8 to -10.0) |
| Environmental heat and cold exposure | 0.7 (0.5 to 0.8) | 0.09% | -29.4 (-37.1 to -25.4) |
| Exposure to forces of nature | 0.1 (0.1 to 0.1) | 0.01% | -45.8 (-45.8 to -45.8) |
| Other unintentional injuries | 1.2 (1.2 to 1.3) | 0.16% | -25.8 (-27.6 to -23.8) |
| Self-harm and interpersonal violence | 17.1 (16.3 to 17.5) | 2.32% | -7.6 (-9.9 to -5.5) |
| Self-harm | 10.0 (9.4 to 10.3) | 1.36% | -14.8 (-18.0 to -12.6) |
| Self-harm by firearm | 0.8 (0.7 to 1.0) | 0.11% | -10.3 (-13.9 to -7.2) |
| Self-harm by other specified means | 9.2 (8.5 to 9.5) | 1.25% | -15.2 (-18.4 to -12.8) |
| Interpersonal violence | 5.2 (4.7 to 5.5) | 0.70% | -11.1 (-13.3 to -8.7) |
| Assault by firearm | 2.2 (1.9 to 2.4) | 0.30% | -3.6 (-6.5 to -0.5) |
| Assault by sharp object | 1.2 (0.9 to 1.4) | 0.16% | -22.3 (-25.6 to -17.6) |
| Assault by other means | 1.8 (1.6 to 2.1) | 0.24% | -11.5 (-15.4 to -7.6) |
| Conflict and terrorism | 1.7 (1.7 to 1.7) | 0.23% | 98.4 (98.4 to 98.5) |
| Executions and police conflict | 0.2 (0.2 to 0.2) | 0.03% | 172.4 (156.8 to 187.6) |
Malnutrition
Malnutrition can be identified as an underlying cause for shortened life.[4] 70% of childhood deaths (age 0–4) are reportedly due to diarrheal illness, acute respiratory infection, malaria and immunizable disease. However 56% of these childhood deaths can be attributed to the effects of malnutrition as an underlying cause.[5] The effects of malnutrition include increased susceptibility to infection,[6] musculature wasting, skeletal deformities and neurologic development delays.[7] According to the World Health Organization, malnutrition is named as the biggest contributor to child mortality[8] with 36 million deaths in 2005 related to malnutrition.[9]
Developed vs. developing economies
Top causes of death, according to the World Health Organization report for the calendar year 2001:[10]
| Causes of death in developing countries | Number of deaths | Causes of death in developed countries | Number of deaths |
|---|---|---|---|
| HIV-AIDS | 2,678,000 | Ischaemic heart disease | 3,512,000 |
| Lower respiratory infections | 2,643,000 | Cerebrovascular disease | 3,346,000 |
| Ischaemic heart disease | 2,484,000 | Chronic obstructive pulmonary disease | 1,829,000 |
| Diarrhea | 1,793,000 | Lower respiratory infections | 1,180,000 |
| Cerebrovascular disease | 1,381,000 | Lung cancer | 938,000 |
| Childhood diseases | 1,217,000 | Car crash | 669,000 |
| Malaria | 1,103,000 | Stomach cancer | 657,000 |
| Tuberculosis | 1,021,000 | Hypertensive heart disease | 635,000 |
| Chronic obstructive pulmonary disease | 748,000 | Tuberculosis | 571,000 |
| Measles | 674,000 | Suicide | 499,000 |
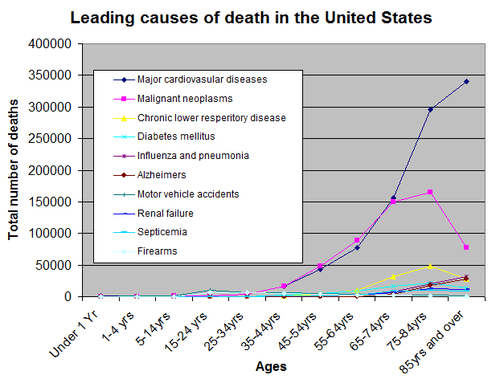
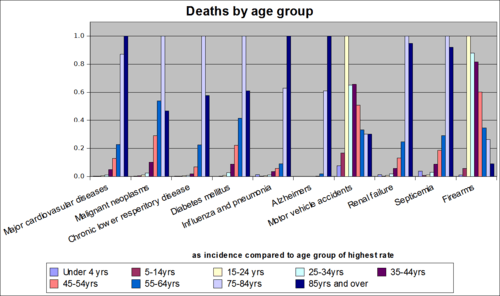
By age group
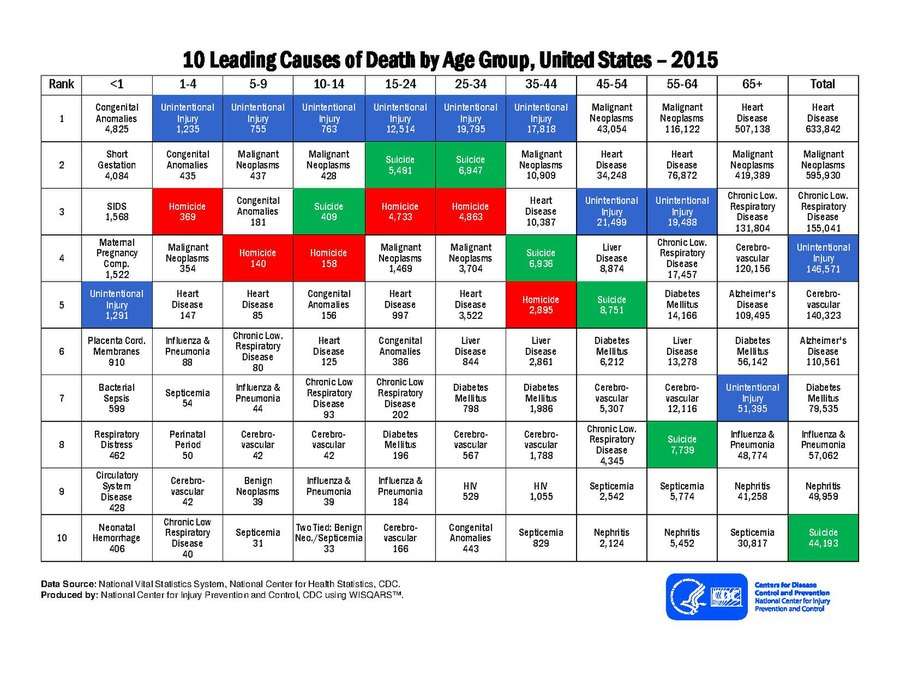
.png)
See also
- Capital punishment by country
- Epidemiology of suicide
- List of countries by intentional homicide rate
- List of killings by law enforcement officers by countries
- List of sovereign states and dependent territories by mortality rate
- List of terrorist incidents
- List of unusual deaths
- List of wars and anthropogenic disasters by death toll (with links to many by-country and by-type detail lists)
- Preventable causes of death
- Medical error
References
- WHO (2005). "Cancer". Archived from the original on May 18, 2020.
- Lozano, Rafael; et al. (Dec 2012). "Global and regional mortality from 235 causes of death for 20 age groups in 1990 and 2010: a systematic analysis for the Global Burden of Disease Study 2010" (PDF). Lancet. 380 (9859): 2095–128. doi:10.1016/S0140-6736(12)61728-0. hdl:10536/DRO/DU:30050819. PMID 23245604. Archived from the original (PDF) on May 19, 2020.
- GBD 2017 Causes of Death Collaborators. "Global, regional, and national age-sex-specific mortality for 282 causes of death in 195 countries and territories, 1980–2017: a systematic analysis for the Global Burden of Disease Study 2017". The Lancet. 8 Nov 2018; 392:1736–88. doi:10.1016/S0140-6736(18)32203-7. Table 1.
- "Mortality In Second And Third Degree Malnutrition". Tropej.oxfordjournals.org. 2014-06-03. Retrieved 2014-06-09.
- Pelletier DL, Frongillo EA, Schroeder DG, Habicht JP (2014-01-24). "The effects of malnutrition on child mortality in developing countries". Bull. World Health Organ. 73 (4): 443–48. PMC 2486780. PMID 7554015.
- "Some effects of malnutrition on the immune response in man". Ajcn.nutrition.org. 1974-06-01. Retrieved 2014-06-09.
- "Elsevier". Pediatric.theclinics.com. Retrieved 2014-06-09.
- Stay informed today; every day (2008-01-24). "Malnutrition: The starvelings". The Economist. Retrieved 2014-06-09.
- Ziegler, Jean (2007). L'Empire de la honte. Fayard
- "Cause of Death". UC Atlas of Global Inequality. University of California, Santa Cruz. 18 February 2004. Archived from the original on 18 June 2014. Retrieved 2014-06-09.
- "Leading causes of death by age group" (PDF). National Center for Injury Prevention and Control. 2015.
- "National Vital Statistics Report" (PDF). National Vital Statistics Report, Vol. 50, No. 15. September 16, 2002.
- Day, Ryan Knutson, Liz (21 May 2012). "Methodology: How We Calculated the Tower Industry Death Rate".
- "Bureau of Labor Statistics; National Census of Fatal Occupational Injuries in 2006" (PDF). Retrieved 2014-06-09.