Kentucky's 6th congressional district
Kentucky's 6th congressional district is a congressional district in the U.S. state of Kentucky. Based in Central Kentucky, the district contains the cities of Lexington (including its suburbs), Richmond, and Frankfort, the state capital. The district is currently represented by Republican Andy Barr.
| Kentucky's 6th congressional district | |||
|---|---|---|---|
.tif.png) Kentucky's 6th congressional district - since January 3, 2013. | |||
| Representative |
| ||
| Distribution |
| ||
| Population (2016) | 765,591[2] | ||
| Median income | $52,156[2] | ||
| Ethnicity |
| ||
| Cook PVI | R+9[3] | ||
Characteristics
As of September 2013, there were 507,252 registered voters: 293,915 (57.94%) Democrats, 171,722 (33.85%) Republicans, and 41,615 (8.20%) "Others". All of the "Others" included 29,934 (5.90%) unclassified Others, 10,760 (2.12%) Independents, 684 (0.13%) Libertarians, 166 (0.03%) Greens, 44 (0.0087%) Constitutionalists, 16 (0.0032%) Reforms, and 11 (0.0022%) Socialist Workers.[4][5]
Until January 1, 2006, Kentucky did not track party affiliation for registered voters who were neither Democratic nor Republican.[6] The Kentucky voter registration card does not explicitly list anything other than Democratic Party, Republican Party, or Other, with the "Other" option having a blank line and no instructions on how to register as something else.[7]
Recent presidential elections
| Election results from presidential races | ||
|---|---|---|
| Year | Office | Results |
| 2000 | President | Bush 56 - 42% |
| 2004 | President | Bush 58 - 41% |
| 2008 | President | McCain 55 - 43% |
| 2012 | President | Romney 56 - 42% |
| 2016 | President | Trump 55 - 39% |
List of members representing the district
| Member | Party | Years | Cong ress |
Electoral history | Location |
|---|---|---|---|---|---|
| District created | March 4, 1803 | ||||
 George M. Bedinger |
Democratic-Republican | March 4, 1803 – March 3, 1807 |
8th 9th |
Elected in 1803. Re-elected in 1804. Retired. |
1803–1813 Bourbon, Fleming, Floyd, Mason, and Nicholas counties |
 Joseph Desha |
Democratic-Republican | March 4, 1807 – March 3, 1813 |
10th 11th 12th |
Elected in 1806. Re-elected in 1808. Re-elected in 1810. Redistricted to the 4th district. | |
 Solomon P. Sharp |
Democratic-Republican | March 4, 1813 – March 3, 1817 |
13th 14th |
Elected in 1812. Re-elected in 1814. Lost re-election. |
1813–1823 Barren, Butler, Cumberland, Logan, and Warren counties |
| David Walker | Democratic-Republican | March 4, 1817 – March 1, 1820 |
15th 16th |
Elected in 1816. Re-elected in 1818. Died. | |
| Vacant | March 1, 1820 – November 13, 1820 | ||||
| Francis Johnson | Democratic-Republican | November 13, 1820 – March 3, 1823 |
16th 17th |
Elected to finish Walker's term. Also elected in 1820 to the next term. Redistricted to the 10th district. | |
| David White | Adams-Clay Democratic-Republican | March 4, 1823 – March 3, 1825 |
18th | Elected in 1822. Retired. |
1823–1833 Franklin, Gallatin, Henry, Owen, and Shelby counties |
| Joseph Lecompte | Jacksonian | March 4, 1825 – March 3, 1833 |
19th 20th 21st 22nd |
Elected in 1824. [data unknown/missing] | |
| Thomas Chilton | Anti-Jacksonian | March 4, 1833 – March 3, 1835 |
23rd | [data unknown/missing] | 1833–1843 [data unknown/missing] |
 John Calhoon |
Anti-Jacksonian | March 4, 1835 – March 3, 1837 |
24th 25th |
[data unknown/missing] | |
| Whig | March 4, 1837 – March 3, 1839 | ||||
| Willis Green | Whig | March 4, 1839 – March 3, 1843 |
26th 27th |
[data unknown/missing] Redistricted to the 2nd district. | |
 John White |
Whig | March 4, 1843 – March 3, 1845 |
28th | Redistricted from the 9th district and re-elected in 1843. [data unknown/missing] |
1843–1853 [data unknown/missing] |
| John P. Martin | Democratic | March 4, 1845 – March 3, 1847 |
29th | [data unknown/missing] | |
| Green Adams | Whig | March 4, 1847 – March 3, 1849 |
30th | [data unknown/missing] | |
| Daniel Breck | Whig | March 4, 1849 – March 3, 1851 |
31st | [data unknown/missing] | |
| Addison White | Whig | March 4, 1851 – March 3, 1853 |
32nd | [data unknown/missing] | |
| John M. Elliott | Democratic | March 4, 1853 – March 3, 1859 |
33rd 34th 35th |
[data unknown/missing] | 1853–1863 [data unknown/missing] |
| Green Adams | Opposition | March 4, 1859 – March 3, 1861 |
36th | [data unknown/missing] | |
 George W. Dunlap |
Unionist | March 4, 1861 – March 3, 1863 |
37th | [data unknown/missing] | |
 Green C. Smith |
Unconditional Unionist | March 4, 1863 – July 1866 |
38th 39th |
[data unknown/missing] Resigned to become Governor of Montana Territory. |
1863–1873 [data unknown/missing] |
| Vacant | July 1866 – December 3, 1866 | ||||
 Andrew H. Ward |
Democratic | December 3, 1866 – March 3, 1867 |
39th | Elected to finish Smith's term. [data unknown/missing] | |
 Thomas L. Jones |
Democratic | March 4, 1867 – March 3, 1871 |
40th 41st |
[data unknown/missing] | |
 William E. Arthur |
Democratic | March 4, 1871 – March 3, 1875 |
42nd 43rd |
[data unknown/missing] | |
| 1873–1883 [data unknown/missing] | |||||
Thomas L. Jones |
Democratic | March 4, 1875 – March 3, 1877 |
44th | [data unknown/missing] | |
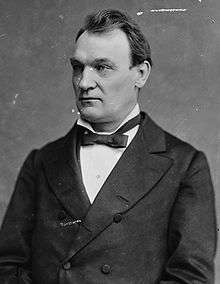 John G. Carlisle |
Democratic | March 4, 1877 – May 26, 1890 |
45th 46th 47th 48th 49th 50th 51st |
[data unknown/missing] Resigned after elected U.S. Senator. | |
| Vacant | May 26, 1890 – June 21, 1890 | ||||
| William W. Dickerson | Democratic | June 21, 1890 – March 3, 1893 |
51st 52nd |
Elected to finish Carlisle's term. [data unknown/missing] | |
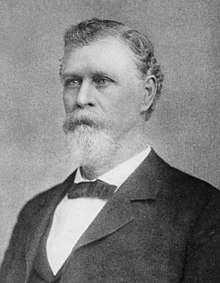 Albert S. Berry |
Democratic | March 4, 1893 – March 3, 1901 |
53rd 54th 55th 56th |
[data unknown/missing] | |
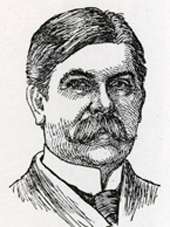 Daniel Linn Gooch |
Democratic | March 4, 1901 – March 3, 1905 |
57th 58th |
[data unknown/missing] | |
| Joseph L. Rhinock | Democratic | March 4, 1905 – March 3, 1911 |
59th 60th 61st |
[data unknown/missing] | |
 Arthur B. Rouse |
Democratic | March 4, 1911 – March 3, 1927 |
62nd 63rd 64th 65th 66th 67th 68th 69th |
[data unknown/missing] | |
| Orie S. Ware | Democratic | March 4, 1927 – March 3, 1929 |
70th | [data unknown/missing] | |
| J. Lincoln Newhall | Republican | March 4, 1929 – March 3, 1931 |
71st | [data unknown/missing] | |
 Brent Spence |
Democratic | March 4, 1931 – March 3, 1933 |
72nd | [data unknown/missing] Redistricted to the at-large district. | |
| District not used. | March 4, 1933 – January 3, 1935 | ||||
.jpg) Virgil Chapman |
Democratic | January 3, 1935 – January 3, 1949 |
74th 75th 76th 77th 78th 79th 80th |
Redistricted from the at-large district and re-elected in 1934. | |
 Thomas R. Underwood |
Democratic | January 3, 1949 – March 17, 1951 |
81st 82nd |
[data unknown/missing] Resigned when appointed U.S. Senator. | |
| Vacant | March 17, 1951 – April 4, 1951 | ||||
 John C. Watts |
Democratic | April 4, 1951 – September 24, 1971 |
82nd 83rd 84th 85th 86th 87th 88th 89th 90th 91st 92nd |
Elected to finish Underwood's term. Died. | |
| Vacant | September 24, 1971 – December 4, 1971 | ||||
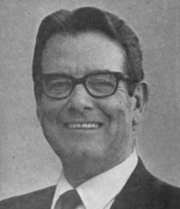
 William P. Curlin Jr. |
Democratic | December 4, 1971 – January 3, 1973 |
92nd | Elected to finish Watts's term. [data unknown/missing] | |
 John B. Breckinridge |
Democratic | January 3, 1973 – January 3, 1979 |
93rd 94th 95th |
[data unknown/missing] | |
 Larry Hopkins |
Republican | January 3, 1979 – January 3, 1993 |
96th 97th 98th 99th 100th 101st 102nd |
[data unknown/missing] | |
 Scotty Baesler |
Democratic | January 3, 1993 – January 3, 1999 |
103rd 104th 105th |
[data unknown/missing] Retired to run for U.S. Senator. |
[data unknown/missing] |
 Ernie Fletcher |
Republican | January 3, 1999 – January 3, 2003 |
106th 107th 108th |
[data unknown/missing] Resigned when elected Governor of Kentucky. | |
| January 3, 2003 – December 8, 2003 |
2003–2013 | ||||
| Vacant | December 8, 2003 – February 17, 2004 | ||||
 Ben Chandler |
Democratic | February 17, 2004 – January 3, 2013 |
108th 109th 110th 111th 112th |
Elected to finish Fletcher's term. Re-elected in 2006. Re-elected in 2008. Re-elected in 2010. Lost re-election. | |
 Andy Barr |
Republican | January 3, 2013 – Present |
113th 114th 115th 116th |
Elected in 2012. Re-elected in 2014. Re-elected in 2016. Re-elected in 2018. |
2013–Present.tif.png) |
Recent election results
2002
| Party | Candidate | Votes | % | |
|---|---|---|---|---|
| Republican | Ernie Fletcher* | 115,622 | 71.95 | |
| Independent | Gatewood Galbraith | 41,753 | 25.98 | |
| Libertarian | Mark Gailey | 3,313 | 2.06 | |
| Total votes | 160,688 | 100.00 | ||
| Turnout | ||||
| Republican hold | ||||
2004
| Party | Candidate | Votes | % | |||
|---|---|---|---|---|---|---|
| Democratic | Ben Chandler | 84,168 | 55.16 | |||
| Republican | Alice Forgy Kerr | 65,474 | 42.91 | |||
| Libertarian | Mark Gailey | 2,952 | 1.94 | |||
| Total votes | 152,594 | 100.00 | ||||
| Turnout | ||||||
| Democratic gain from Republican | ||||||
| Party | Candidate | Votes | % | |
|---|---|---|---|---|
| Democratic | Ben Chandler* | 175,355 | 58.61 | |
| Republican | Tom Buford | 119,716 | 40.01 | |
| Independent | Stacy Abner | 2,388 | 0.80 | |
| Libertarian | Mark Gailey | 1,758 | 0.59 | |
| Total votes | 299,217 | 100.00 | ||
| Turnout | ||||
| Democratic hold | ||||
2006
| Party | Candidate | Votes | % | |
|---|---|---|---|---|
| Democratic | Ben Chandler* | 158,869 | 85.46 | |
| Libertarian | Paul Ard | 27,024 | 14.54 | |
| Total votes | 185,893 | 100.00 | ||
| Turnout | ||||
| Democratic hold | ||||
2008
| Party | Candidate | Votes | % | |
|---|---|---|---|---|
| Democratic | Ben Chandler* | 203,764 | 64.66 | |
| Republican | Jon Larson | 111,378 | 35.34 | |
| Total votes | 315,142 | 100.00 | ||
| Turnout | ||||
| Democratic hold | ||||
2010
| Party | Candidate | Votes | % | |
|---|---|---|---|---|
| Democratic | Ben Chandler* | 119,812 | 50.08 | |
| Republican | Andy Barr | 119,165 | 49.81 | |
| No party | C. Wes Collins | 225 | 0.09 | |
| No party | Randolph S. Vance | 22 | 0.01 | |
| Total votes | 239,224 | 100.00 | ||
| Turnout | ||||
| Democratic hold | ||||
2012
| Party | Candidate | Votes | % | |||
|---|---|---|---|---|---|---|
| Republican | Andy Barr | 153,222 | 50.57 | |||
| Democratic | Ben Chandler* | 141,438 | 46.70 | |||
| No party | Randolph S. Vance | 8,340 | 2.75 | |||
| Total votes | 303,000 | 100.00 | ||||
| Turnout | ||||||
| Republican gain from Democratic | ||||||
2014
| Party | Candidate | Votes | % | |
|---|---|---|---|---|
| Republican | Andy Barr* | 147,404 | 59.99 | |
| Democratic | Elisabeth Jensen | 98,290 | 40.00 | |
| Total votes | 245,694 | 100.00 | ||
| Turnout | ||||
| Republican hold | ||||
2016
| Party | Candidate | Votes | % | |
|---|---|---|---|---|
| Republican | Andy Barr* | 202,099 | 61.09 | |
| Democratic | Nancy Jo Kemper | 128,728 | 38.91 | |
| Total votes | 330,827 | 100.00 | ||
| Turnout | ||||
| Republican hold | ||||
2018
| Party | Candidate | Votes | % | ± | |
|---|---|---|---|---|---|
| Republican | Andy Barr (incumbent) | 154,468 | 51.00% | -10.09% | |
| Democratic | Amy McGrath | 144,730 | 47.78% | +8.87% | |
| Libertarian | Frank Harris | 2,150 | 0.71% | N/A | |
| Independent | Rikka Wallin | 1,011 | 0.33% | N/A | |
| Independent | James Germalic | 522 | 0.17% | N/A | |
| Margin of victory | 9,738 | 3.22% | -18.96% | ||
| Total votes | '302,881' | '100.0%' | N/A | ||
| Republican hold | |||||
References
- "Archived copy". Archived from the original on 2017-07-17. Retrieved 2018-02-11.CS1 maint: archived copy as title (link)
- Center for New Media & Promotion (CNMP), US Census Bureau. "My Congressional District". www.census.gov.
- "Partisan Voting Index – Districts of the 115th Congress" (PDF). The Cook Political Report. April 7, 2017. Retrieved April 7, 2017.
- "Registration Statistics: By Congression District". Kentucky State Board of Elections. September 2013. Retrieved 2014-02-06.
- "Registration Statistics: Other Political Organizations and Groups". Kentucky State Board of Elections. September 2013. Retrieved 2014-02-06.
- "Kentucky Administrative Regulations 31KAR4:150". Kentucky Legislative Research Commission. November 2005. Retrieved 2014-02-06.
- "Register To Vote". Kentucky State Board of Elections. August 2003. Retrieved 2014-02-06.
- "UNOFFICIAL RESULTS". Kentucky State Board of Elections. November 7, 2018.
- Martis, Kenneth C. (1989). The Historical Atlas of Political Parties in the United States Congress. New York: Macmillan Publishing Company.
- Martis, Kenneth C. (1982). The Historical Atlas of United States Congressional Districts. New York: Macmillan Publishing Company.
- Congressional Biographical Directory of the United States 1774–present
| U.S. House of Representatives | ||
|---|---|---|
| Preceded by Ohio's 8th congressional district |
Home district of the Speaker of the House December 3, 1883 – March 4, 1889 |
Succeeded by Maine's 1st congressional district |