Iowa's 5th congressional district
Iowa's 5th congressional district is an obsolete congressional district in the U.S. state of Iowa. It was last represented by Republican Steve King, who continued to serve in the United States House of Representative after the district's obsolescence as a representative of Iowa's 4th congressional district.
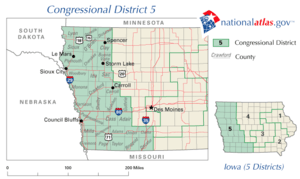
The district became obsolete for the 113th Congress in 2013 as Iowa lost a seat in the U.S. House of Representatives as a result of redistricting based upon the 2010 Census. Official redistricting maps divided the territory in this district in half, attaching the northern half to the 4th district and the southern half to the 3rd district.
History

Iowa's 5th congressional district was redistricted in 1942. U.S. Representative Karl M. LeCompte became the representative of Iowa's 4th congressional district, and U.S. Representative Paul H. Cunningham was the representative from Iowa's 6th congressional district.
Iowa's 5th congressional district was also redistricted in 1972. U.S. Representative Neal Smith was taken out of Iowa's 5th congressional district and put in the 4th congressional district. U.S. Representative William J. Scherle was taken out of Iowa's 7th congressional district (which was permanently removed) and put into the 5th congressional district where he ran against future U.S. Senator Tom Harkin.
On June 22, 2001, the Iowa General Assembly passed a plan to redistrict the state of Iowa. The plan went into effect in 2002 for the 108th U.S. Congress. The prior redistricting plan was effective from 1992–2001.[1]
Presidential election results
Election results from presidential races:
| Year | Office | Results |
|---|---|---|
| 2000 | President | George W. Bush 57% – Al Gore 40% |
| 2004 | President | George W. Bush 60% – John Kerry 39% |
| 2008 | President | John McCain 54% – Barack Obama 44% |
List of representatives
| Representative | Party | Term | Cong- ress |
Note |
|---|---|---|---|---|
District created |
March 4, 1863 | |||
 |
Republican | March 4, 1863 – March 3, 1867 | 38th 39th |
|
 |
Republican | March 4, 1867 – March 3, 1869 | 40th | |
 |
Republican | March 4, 1869 – March 3, 1873 | 41st 42nd |
|
-seated.jpg) |
Republican | March 4, 1873 – March 3, 1877 | 43rd 44th |
|
 |
Republican | March 4, 1877 – April 29, 1879 | 45th 46th |
Died |
Vacant |
April 29, 1879 - December 1, 1879 | |||
.jpg) |
Republican | December 1, 1879 – March 3, 1883 | 46th 47th |
|
|
Republican | March 4, 1883 – March 3, 1885 | 48th | Lost contested election |
 |
Democratic | March 4, 1885 – March 3, 1887 | 49th | Won contested election |
 |
Republican | March 4, 1887 – March 3, 1891 | 50th 51st |
|
 |
Democratic | March 3, 1891 – March 3, 1893 | 52nd | |
.jpg) |
Republican | March 4, 1893 – March 3, 1909 | 53rd 54th 55th 56th 57th 58th 59th 60th |
|
 |
Republican | March 4, 1909 – June 15, 1921 | 61st 62nd 63rd 64th 65th 66th 67th |
Resigned |
Vacant |
June 15, 1921 - July 19, 1921 | |||
 |
Republican | August 1, 1921 – March 3, 1933 | 67th 68th 69th 70th 71st 72nd |
|
 |
Republican | March 4, 1933 – January 3, 1939 | 73rd 74th 75th |
Redistricted from the 8th district |
 |
Republican | January 3, 1939 – January 3, 1943 | 76th 77th |
Redistricted to the 4th district |
.jpg) |
Republican | January 3, 1943 – January 3, 1959 | 78th 79th 80th 81st 82nd 83rd 84th 85th |
Redistricted from the 6th district |
 |
Democratic | January 3, 1959 – January 3, 1973 | 86th 87th 88th 89th 90th 91st 92nd |
Redistricted to the 4th district |
 |
Republican | January 3, 1973 – January 3, 1975 | 93rd | Redistricted from the 7th district |
 |
Democratic | January 3, 1975 – January 3, 1985 | 94th 95th 96th 97th 98th |
Elected to the United States Senate |
 |
Republican | January 3, 1985 – January 3, 1993 | 99th 100th 101st 102nd |
Redistricted to the 3rd district |
 |
Republican | January 3, 1993 – January 3, 1995 | 103rd | Redistricted from the 6th district |
 |
Republican | January 3, 1995 – January 3, 2003 | 104th 105th 106th 107th |
Redistricted to the 4th district |
 |
Republican | January 3, 2003 – January 3, 2013 | 108th 109th 110th 111th 112th |
Redistricted to the 4th district |
District eliminated |
January 3, 2013 | |||
Historical election results
| Year[2]
|
Party affiliation | Winner | Number of votes | Party affiliation | Loser | Number of votes | Percentage of votes |
|---|---|---|---|---|---|---|---|
| 1920 | Republican | James W. Good | 58,197 | N/A | N/A | 0 | 100% - 0% |
| 1922 | Republican | Cyrenus Cole | 32,586 | Democrat | G. A. Smith | 24,532 | 57% - 43% |
| 1924 | Republican | Cyrenus Cole | 52,237 | Democrat | W. N. Townsend | 22,175 | 70% - 30% |
| 1926 | Republican | Cyrenus Cole | 31,253 | Democrat | C. E. Walters | 12,263 | 72% - 28% |
| 1928 | Republican | Cyrenus Cole | 54,703 | Democrat | Maurice Cahill | 27,893 | 66% - 34% |
| 1930 | Republican | Cyrenus Cole | 23,221 | Democrat | H. M. Cooper | 19,931 | 54% - 46% |
| 1932 | Republican | Lloyd Thurston | 51,909 | Democrat | Lloyd Ellis | 51,732 | 50.1% - 49.9% |
| 1934 | Republican | Lloyd Thurston | 54,699 | Democrat | Ernest H. Fabritz | 48,949 | 52% - 47% |
| 1936 | Republican | Lloyd Thurston | 63,802 | Democrat | Kenneth F. Baldridge | 59,971 | 51% - 48% |
| 1938 | Republican | Karl M. LeCompte | 50,860 | Democrat | Ruth F. Hollingshead | 43,452 | 54% - 46% |
| 1940 | Republican | Karl M. LeCompte | 66,940 | Democrat | Roy E. Stevens | 58,718 | 54% - 46% |
| 1942 | Republican | Paul H. Cunningham | 48,578 | Democrat | E. Frank Fox | 28,287 | 63% - 37% |
| 1944 | Republican | Paul H. Cunningham | 66,260 | Democrat | Ralph N. Lynch | 56,138 | 54% - 46% |
| 1946 | Republican | Paul H. Cunningham | 41,679 | Democrat | Vince L. Browner | 28,490 | 59% - 41% |
| 1948 | Republican | Paul H. Cunningham | 60,103 | Democrat | William F. Martin | 57,370 | 51% - 48% |
| 1950 | Republican | Paul H. Cunningham | 57,429 | Democrat | Gibson C. Holliday | 43,105 | 57% - 43% |
| 1952 | Republican | Paul H. Cunningham | 95,057 | Democrat | Alvin P. Meyer | 66,303 | 59% - 41% |
| 1954 | Republican | Paul H. Cunningham | 61,355 | Democrat | James A. McLaughlin | 49,063 | 56% - 44% |
| 1956 | Republican | Paul H. Cunningham | 85,178 | Democrat | William F. Denman | 81,418 | 51% - 49% |
| 1958 | Democrat | Neal Smith | 61,693 | Republican | Paul H. Cunningham | 56,320 | 52% - 48% |
| 1960 | Democrat | Neal Smith | 91,808 | Republican | Floyd M. Burgeson | 81,474 | 53% - 47% |
| 1962 | Democrat | Neal Smith | 73,963 | Republican | Sonja C. Egenes | 43,877 | 63% - 37% |
| 1964 | Democrat | Neal Smith | 108,212 | Republican | Benjamin J. Gibson, Jr. | 46,160 | 70% - 30% |
| 1966 | Democrat | Neal Smith | 72,875 | Republican | Don Mahon | 46,981 | 60% - 39% |
| 1968 | Democrat | Neal Smith | 99,586 | Republican | Don Mahon | 60,710 | 62% - 38% |
| 1970 | Democrat | Neal Smith | 73,820 | Republican | Don Mahon | 37,374 | 65% - 33% |
| 1972 | Republican | William J. Scherle | 108,596 | Democrat | Tom Harkin | 87,937 | 55% - 45% |
| 1974 | Democrat | Tom Harkin | 81,146 | Republican | William J. Scherle | 77,683 | 51% - 49% |
| 1976 | Democrat | Tom Harkin | 135,600 | Republican | Kenneth R. Fulk | 71,377 | 65% - 34% |
| 1978 | Democrat | Tom Harkin | 82,333 | Republican | Julian B. Garrett | 57,377 | 59% - 41% |
| 1980 | Democrat | Tom Harkin | 127,895 | Republican | Cal Hultman | 84,472 | 60% - 40% |
| 1982 | Democrat | Tom Harkin | 93,333 | Republican | Arlyn E. Danker | 65,200 | 59% - 41% |
| 1984 | Republican | Jim Ross Lightfoot | 104,632 | Democrat | Jerry Fitzgerald | 101,435 | 51% - 49% |
| 1986 | Republican | Jim Ross Lightfoot | 85,025 | Democrat | Scott Hughes | 58,552 | 59% - 40% |
| 1988 | Republican | Jim Ross Lightfoot | 117,761 | Democrat | Gene Freund | 66,599 | 64% - 36% |
| 1990 | Republican | Jim Ross Lightfoot | 99,978 | Democrat | Mike D. Earll | 47,022 | 68% - 32% |
| 1992 | Republican | Fred Grandy | 196,942 | N/A | N/A | 1,424 | 99% - 1% |
| 1994 | Republican | Tom Latham | 114,796 | Democrat | Sheila McGuire | 73,627 | 61% - 39% |
| 1996 | Republican | Tom Latham | 147,576 | Democrat | MacDonald Smith | 75,785 | 65% - 34% |
| 1998 | Republican | Tom Latham | 132,730 | N/A | N/A | 1,041 | 99% - 1% |
| 2000 | Republican | Tom Latham | 159,367 | Democrat | Mike Palecek | 67,593 | 69% - 29% |
| 2002 | Republican | Steve King | 113,257 | Democrat | Paul Shomshor | 68,853 | 62% - 38% |
| 2004 | Republican | Steve King | 168,583 | Democrat | E. Joyce Schulte | 97,597 | 63% - 37% |
| 2006 | Republican | Steve King | 105,245 | Democrat | E. Joyce Schulte | 64,004 | 59% - 36% |
| 2008[3] | Republican | Steve King | 159,430 | Democrat | Rob Hubler | 99,601 | 60% - 37% |
| 2010[4] | Republican | Steve King | 128,363 | Democrat | Matthew Campbell | 63,160 | 66% - 32% |
Recent election results
2002
| Party | Candidate | Votes | % | |
|---|---|---|---|---|
| Republican | Steve King | 113,257 | 62.15 | |
| Democratic | Paul Shomshor | 68,853 | 37.78 | |
| No party | Others | 127 | 0.07 | |
| Total votes | 182,237 | 100.00 | ||
| Turnout | ||||
| Republican hold | ||||
2004
| Party | Candidate | Votes | % | |
|---|---|---|---|---|
| Republican | Steve King* | 168,593 | 63.30 | |
| Democratic | Joyce Schulte | 97,597 | 36.64 | |
| No party | Others | 161 | 0.06 | |
| Total votes | 266,351 | 100.00 | ||
| Turnout | ||||
| Republican hold | ||||
2006
| Party | Candidate | Votes | % | |
|---|---|---|---|---|
| Republican | Steve King* | 121,650 | 58.50 | |
| Democratic | Joyce Schulte | 64,181 | 35.56 | |
| Independent | Roy Nielsen | 8,159 | 4.52 | |
| Independent | Cheryl Broderson | 2,479 | 1.37 | |
| No party | Others | 65 | 0.04 | |
| Total votes | 196,534 | 100.00 | ||
| Turnout | ||||
| Republican hold | ||||
2008
| Party | Candidate | Votes | % | |
|---|---|---|---|---|
| Republican | Steve King* | 159,430 | 59.80 | |
| Democratic | Rob Hubler | 99,601 | 37.36 | |
| Independent | Victor Vara | 7,406 | 2.78 | |
| No party | Others | 180 | 0.07 | |
| Total votes | 266,617 | 100.00 | ||
| Turnout | ||||
| Republican hold | ||||
2010
| Party | Candidate | Votes | % | |
|---|---|---|---|---|
| Republican | Steve King* | 128,363 | 65.75 | |
| Democratic | Matthew Campbell | 63,160 | 32.35 | |
| Independent | Martin James Monroe | 3,622 | 1.86 | |
| No party | Others | 94 | 0.05 | |
| Total votes | 195,239 | 100.00 | ||
| Turnout | ||||
| Republican hold | ||||
See also
References
- "2001 Iowa Redistricting Plan,". 2001. Archived from the original on 2006-10-16. Retrieved 2006-11-10.
- "Election Statistics,". 2005. Archived from the original on 2007-07-25.
- "Archived copy". Archived from the original on 2009-04-08. Retrieved 2009-02-10.CS1 maint: archived copy as title (link)
- http://www.sos.state.ia.us/pdfs/elections/2010/usreporr.pdf
External links
- Martis, Kenneth C. (1989). The Historical Atlas of Political Parties in the United States Congress. New York: Macmillan Publishing Company.
- Martis, Kenneth C. (1982). The Historical Atlas of United States Congressional Districts. New York: Macmillan Publishing Company.
- Congressional Biographical Directory of the United States 1774–present