Iowa's 2nd congressional district
Iowa's 2nd congressional district is a congressional district in the U.S. state of Iowa that covers most of its southeastern part. It includes Davenport, Iowa City, Muscatine, Clinton, Burlington, Ottumwa, Fort Madison, Oskaloosa, Bettendorf, Newton and Pella. The district is currently represented by Democrat Dave Loebsack, who has been in office since 2007.
| Iowa's 2nd congressional district | |||
|---|---|---|---|
.tif.png) Iowa's 2nd congressional district since January 3, 2013 | |||
| Representative |
| ||
| Distribution |
| ||
| Population (2018 est.) | 783,983 | ||
| Median income | $55,239[1] | ||
| Ethnicity | |||
| Cook PVI | D+1[3] | ||
Redistricting
On June 22, 2001, the Iowa General Assembly passed a plan to redistrict the state of Iowa. The plan went into effect in 2002 for the 108th U.S. Congress. The prior redistricting plan was effective from 1992 to 2001.[4]
Recent election results in statewide races
| Year | Office | Results |
|---|---|---|
| 2000 | President | Gore 53% – Bush 43% |
| 2004 | President | Kerry 55% – Bush 44% |
| 2008 | President | Obama 60% – McCain 38% |
| 2012 | President | Obama 56% – Romney 43% |
| 2016 | President | Trump 49% – Clinton 45% |
List of members representing the district
| Member | Party | Term | Cong ress |
Electoral history |
|---|---|---|---|---|
| District created | March 4, 1847 | |||
.jpg) Shepherd Leffler |
Democratic | March 4, 1847 – March 3, 1851 |
30th 31st |
Redistricted from the at-large district and re-elected in 1846. [data unknown/missing] |
.jpg) Lincoln Clark |
Democratic | March 4, 1851 – March 3, 1853 |
32nd | [data unknown/missing] |
| John P. Cook | Whig | March 4, 1853 – March 3, 1855 |
33rd | [data unknown/missing] |
 James Thorington |
Whig | March 4, 1855 – March 3, 1857 |
34th | [data unknown/missing] |
.jpg) Timothy Davis |
Republican | March 4, 1857 – March 3, 1859 |
35th | [data unknown/missing] |
 William Vandever |
Republican | March 4, 1859 – March 3, 1863 |
36th 37th |
[data unknown/missing] |
 Hiram Price |
Republican | March 4, 1863 – March 3, 1869 |
38th 39th 40th |
[data unknown/missing] |
 William Smyth |
Republican | March 4, 1869 – September 30, 1870 |
41st | [data unknown/missing] Died. |
| Vacant | September 30, 1870 – December 6, 1870 | |||
.jpg) William P. Wolf |
Republican | December 6, 1870 – March 3, 1871 |
Elected to finish Smyth's term. [data unknown/missing] | |
 Aylett R. Cotton |
Republican | March 4, 1871 – March 3, 1875 |
42nd 43rd |
[data unknown/missing] |
 John Q. Tufts |
Republican | March 4, 1875 – March 3, 1877 |
44th | [data unknown/missing] |
Hiram Price |
Republican | March 4, 1877 – March 3, 1881 |
45th 46th |
[data unknown/missing] |
_2.jpg) Sewall S. Farwell |
Republican | March 4, 1881 – March 3, 1883 |
47th | [data unknown/missing] |
.jpg) Jeremiah H. Murphy |
Democratic | March 4, 1883 – March 3, 1887 |
48th 49th |
[data unknown/missing] |
 Walter I. Hayes |
Democratic | March 4, 1887 – March 3, 1895 |
50th 51st 52nd 53rd |
[data unknown/missing] |
 George M. Curtis |
Republican | March 4, 1895 – March 3, 1899 |
54th 55th |
[data unknown/missing] |
 Joseph R. Lane |
Republican | March 4, 1899 – March 3, 1901 |
56th | [data unknown/missing] |
.jpg) John N. W. Rumple |
Republican | March 4, 1901 – January 31, 1903 |
57th | [data unknown/missing] Died. |
| Vacant | January 31, 1903 – March 3, 1903 | |||
 Martin J. Wade |
Democratic | March 4, 1903 – March 3, 1905 |
58th | [data unknown/missing] |
.jpg) Albert F. Dawson |
Republican | March 4, 1905 – March 3, 1911 |
59th 60th 61st |
[data unknown/missing] |
 Irvin S. Pepper |
Democratic | March 4, 1911 – December 22, 1913 |
62nd 63rd |
[data unknown/missing] Died. |
| Vacant | December 22, 1913 – February 10, 1914 |
63rd | ||
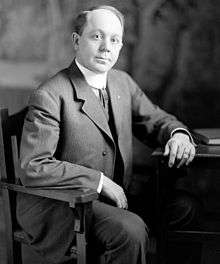
.jpg) Henry Vollmer |
Democratic | February 10, 1914 – March 3, 1915 |
Elected to finish Pepper's term. [data unknown/missing] | |
 Harry E. Hull |
Republican | March 4, 1915 – March 3, 1925 |
64th 65th 66th 67th 68th |
[data unknown/missing] |
.jpg) F. Dickinson Letts |
Republican | March 4, 1925 – March 3, 1931 |
69th 70th 71st |
[data unknown/missing] |
.jpg) Bernhard M. Jacobsen |
Democratic | March 4, 1931 – June 30, 1936 |
72nd 73rd 74th |
[data unknown/missing] Died. |
| Vacant | June 30, 1936 – January 3, 1937 |
74th | ||
 William S. Jacobsen |
Democratic | January 3, 1937 – January 3, 1943 |
75th 76th 77th |
[data unknown/missing] |
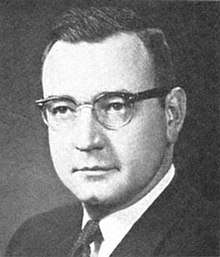
.jpg) Henry O. Talle |
Republican | January 3, 1943 – January 3, 1959 |
78th 79th 80th 81st 82nd 83rd 84th 85th |
Redistricted from the 4th district and reelected in 1942. |
.jpg) Leonard G. Wolf |
Democratic | January 3, 1959 – January 3, 1961 |
86th | [data unknown/missing] |
 James E. Bromwell |
Republican | January 3, 1961 – January 3, 1965 |
87th 88th |
[data unknown/missing] |
 John Culver |
Democratic | January 3, 1965 – January 3, 1975 |
89th 90th 91st 92nd 93rd |
[data unknown/missing] |
 Mike Blouin |
Democratic | January 3, 1975 – January 3, 1979 |
94th 95th |
[data unknown/missing] |
 Tom Tauke |
Republican | January 3, 1979 – January 3, 1991 |
96th 97th 98th 99th 100th 101st |
[data unknown/missing] |
 Jim Nussle |
Republican | January 3, 1991 – January 3, 2003 |
102nd 103rd 104th 105th 106th 107th |
[data unknown/missing] Redistricted to the 1st district. |
 Jim Leach |
Republican | January 3, 2003 – January 3, 2007 |
108th 109th |
Redistricted from the 1st district and reelected in 2002. |
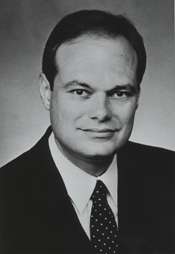
 Dave Loebsack |
Democratic | January 3, 2007 – Present |
110th 111th 112th 113th 114th 115th 116th |
Elected in 2006. Not running for re-election in 2020. |
Recent election results
| Year | Winner | Second | Percentage | ||||
|---|---|---|---|---|---|---|---|
| Party affiliation | Candidate | Votes | Party affiliation | Candidate | Votes | ||
| 1920 | Republican | Harry E. Hull | 50,160 | Farmer-Labor | F. B Althouse | 6,058 | 89% – 11% |
| 1922 | Republican | Harry E. Hull | 27,450 | Democratic | Wayne G. Cook | 25,620 | 51% – 48% |
| 1924 | Republican | Fred Dickinson Letts | 49,117 | Democratic | Ralph U. Thompson | 32,893 | 60% – 40% |
| 1926 | Republican | Fred Dickinson Letts | 29,200 | Democratic | J. P. Gallagher | 19,612 | 60% – 40% |
| 1928 | Republican | Fred Dickinson Letts | 49,690 | Democratic | Frank Z. Titzell | 37,344 | 57% – 43% |
| 1930 | Democratic | Bernhard M. Jacobsen | 30,008 | Republican | F. D. Letts | 24,113 | 55% – 45% |
| 1932 | Democratic | Bernhard M. Jacobsen | 71,914 | Republican | Frank W. Elliott | 50,636 | 59% – 41% |
| 1934 | Democratic | Bernhard M. Jacobsen | 60,654 | Republican | Martin B. Andelfinger | 39,047 | 63% – 35% |
| 1936 | Democratic | William S. Jacobsen | 70,923 | Republican | Charles Penningroth | 55,255 | 53% – 41% |
| 1938 | Democratic | William S. Jacobsen | 48,155 | Republican | Alfred C. Mueller | 47,535 | 50% – 49% |
| 1940 | Democratic | William S. Jacobsen | 75,774 | Republican | W. A. McCullough | 69,298 | 52% – 48% |
| 1942 | Republican | Henry O. Talle | 62,290 | Democratic | William S. Jacobsen | 46,310 | 57% – 43% |
| 1944 | Republican | Henry O. Talle | 86,903 | Democratic | George C. Classen | 68,489 | 56% – 44% |
| 1946 | Republican | Henry O. Talle | 60,111 | Democratic | Richard V. Bernhart | 41,544 | 59% – 41% |
| 1948 | Republican | Henry O. Talle | 82,139 | Democratic | T. W. Mullaney | 60,272 | 57% – 42% |
| 1950 | Republican | Henry O. Talle | 79,066 | Democratic | Eugene J. Kean | 55,359 | 59% – 41% |
| 1952 | Republican | Henry O. Talle | 114,553 | Democratic | T. W. Mullaney | 69,421 | 62% – 38% |
| 1954 | Republican | Henry O. Talle | 72,231 | Democratic | Ruben V. Austin | 58,092 | 55% – 46% |
| 1956 | Republican | Henry O. Talle | 95,999 | Democratic | Leonard G. Wolf | 90,843 | 51% – 49% |
| 1958 | Democratic | Leonard G. Wolf | 67,022 | Republican | Henry O. Talle | 64,073 | 51% – 49% |
| 1960 | Republican | James E. Bromwell | 108,137 | Democratic | Leonard G. Wolf | 97,608 | 53% – 47% |
| 1962 | Republican | James E. Bromwell | 67,475 | Democratic | Frank W. Less | 60,296 | 53% – 47% |
| 1964 | Democratic | John C. Culver | 97,470 | Republican | James E. Bromwell | 89,299 | 52% – 48% |
| 1966 | Democratic | John C. Culver | 76,281 | Republican | Robert M. L. Johnson | 65,079 | 54% – 46% |
| 1968 | Democratic | John C. Culver | 103,651 | Republican | Tom Riley | 84,634 | 55% – 45% |
| 1970 | Democratic | John C. Culver | 84,049 | Republican | Cole McMartin | 54,934 | 60% – 40% |
| 1972 | Democratic | John C. Culver | 115,489 | Republican | Theodore R. Ellsworth | 79,667 | 59% – 41% |
| 1974 | Democratic | Michael T. Blouin | 73,416 | Republican | Tom Riley | 69,088 | 51% – 48% |
| 1976 | Democratic | Michael T. Blouin | 102,980 | Republican | Tom Riley | 100,344 | 50% – 49% |
| 1978 | Republican | Thomas J. Tauke | 72,644 | Democratic | Michael T. Blouin | 65,450 | 52% – 47% |
| 1980 | Republican | Thomas J. Tauke | 111,587 | Democratic | Steve Sovern | 93,175 | 54% – 45% |
| 1982 | Republican | Thomas J. Tauke | 99,478 | Democratic | Brent Appel | 69,539 | 59% – 41% |
| 1984 | Republican | Thomas J. Tauke | 136,839 | Democratic | Joe Welsh | 77,335 | 64% – 36% |
| 1986 | Republican | Thomas J. Tauke | 88,708 | Democratic | Eric Tabor | 55,903 | 61% – 39% |
| 1988 | Republican | Thomas J. Tauke | 113,543 | Democratic | Eric Tabor | 86,438 | 58% – 43% |
| 1990 | Republican | Jim Nussle | 82,650 | Democratic | Eric Tabor | 81,008 | 50% – 49% |
| 1992 | Republican | Jim Nussle | 134,536 | Democratic | David R. Nagle | 131,570 | 50% – 49% |
| 1994 | Republican | Jim Nussle | 111,076 | Democratic | David R. Nagle | 86,087 | 56% – 43% |
| 1996 | Republican | Jim Nussle | 127,827 | Democratic | Donna L. Smith | 109,731 | 53% – 46% |
| 1998 | Republican | Jim Nussle | 104,613 | Democratic | Rob Tully | 83,405 | 55% – 44% |
| 2000 | Republican | Jim Nussle | 139,906 | Democratic | Donna L. Smith | 110,327 | 55% – 44% |
| 2002 | Republican | James A. Leach | 108,130 | Democratic | Julie Thomas | 94,767 | 52% – 46% |
| 2004 | Republican | James A. Leach | 176,684 | Democratic | Dave Franker | 117,405 | 59% – 39% |
| 2006 | Democratic | Dave Loebsack | 107,097 | Republican | James A. Leach | 101,386 | 51% – 49% |
| 2008 | Democratic | Dave Loebsack | 173,639 | Republican | Mariannette Miller-Meeks | 118,040 | 57% – 38% |
| 2010 | Democratic | Dave Loebsack | 115,839 | Republican | Mariannette Miller-Meeks | 104,319 | 50% – 45% |
| 2012 | Democratic | Dave Loebsack | 211,863 | Republican | John Archer | 161,977 | 55% – 42% |
| 2014 | Democratic | Dave Loebsack | 143,431 | Republican | Mariannette Miller-Meeks | 129,455 | 52% – 47% |
| 2016 | Democratic | Dave Loebsack | 198,571 | Republican | Christopher Peters | 170,933 | 53% – 46% |
| 2018 | Democratic | Dave Loebsack | 171,120 | Republican | Christopher Peters | 133,051 | 54% – 42% |
- "Election Statistics". 2005. Archived from the original on July 25, 2007.
2002
| Party | Candidate | Votes | % | |
|---|---|---|---|---|
| Republican | James A. Leach | 108,130 | 52.19% | |
| Democratic | Julie Thomas | 94,767 | 45.74% | |
| Libertarian | Kevin Litten | 4,178 | 2.02% | |
| No party | Others | 96 | 0.05% | |
| Total votes | 207,171 | 100.00% | ||
| Republican hold | ||||
2004
| Party | Candidate | Votes | % | |
|---|---|---|---|---|
| Republican | James A. Leach (Incumbent) | 176,684 | 58.92% | |
| Democratic | Dave Franker | 117,405 | 39.15% | |
| Libertarian | Kevin Litten | 5,586 | 1.86% | |
| No party | Others | 206 | 0.07% | |
| Total votes | 299,881 | 100.00% | ||
| Republican hold | ||||
2006
| Party | Candidate | Votes | % | |||
|---|---|---|---|---|---|---|
| Democratic | Dave Loebsack | 107,683 | 51.38% | |||
| Republican | James A. Leach (Incumbent) | 101,707 | 48.53% | |||
| No party | Others | 196 | 0.09% | |||
| Total votes | 209,586 | 100.00% | ||||
| Democratic gain from Republican | ||||||
2008
| Party | Candidate | Votes | % | |
|---|---|---|---|---|
| Democratic | Dave Loebsack (Incumbent) | 175,218 | 57.19% | |
| Republican | Mariannette Miller-Meeks | 118,778 | 38.77% | |
| Green | Wendy Barth | 6,664 | 2.18% | |
| Independent | Brian White | 5,437 | 1.78% | |
| No party | Others | 261 | 0.09% | |
| Total votes | 306,358 | 100.00% | ||
| Democratic hold | ||||
2010
| Party | Candidate | Votes | % | |
|---|---|---|---|---|
| Democratic | Dave Loebsack (Incumbent) | 115,839 | 50.99% | |
| Republican | Mariannette Miller-Meeks | 104,319 | 45.92% | |
| Libertarian | Gary Joseph Sicard | 4,356 | 1.92% | |
| Constitution | Jon Tack | 2,463 | 1.08% | |
| No party | Others | 198 | 0.09% | |
| Total votes | 227,175 | 100.00% | ||
| Democratic hold | ||||
2012
| Party | Candidate | Votes | % | |
|---|---|---|---|---|
| Democratic | Dave Loebsack (Incumbent) | 211,863 | 55.57% | |
| Republican | John Archer | 161,977 | 42.48% | |
| Independent | Alan Aversa | 7,112 | 1.87% | |
| No party | Others | 323 | 0.08% | |
| Total votes | 381,275 | 100.00% | ||
| Democratic hold | ||||
2014
| Party | Candidate | Votes | % | |
|---|---|---|---|---|
| Democratic | Dave Loebsack (Incumbent) | 143,431 | 52.5% | |
| Republican | Mariannette Miller-Meeks | 129,455 | 47.4% | |
| Write-ins | 443 | 0.2% | ||
| Total votes | 273,329 | 100% | ||
| Democratic hold | ||||
2016

Map showing the results of the 2016 election in Iowa's second congressional district by county
| Party | Candidate | Votes | % | |
|---|---|---|---|---|
| Democratic | Dave Loebsack (Incumbent) | 198,571 | 53.7% | |
| Republican | Christopher Peters | 170,933 | 46.2% | |
| Write-ins | 528 | 0.1% | ||
| Total votes | 370,032 | 100.00% | ||
| Democratic hold | ||||
2018
| Party | Candidate | Votes | % | ± | |
|---|---|---|---|---|---|
| Democratic | Dave Loebsack (Incumbent) | 171,120 | 54.8% | +1.1 | |
| Republican | Christopher Peters | 133,051 | 42.6% | -3.6 | |
| Libertarian | Mark David Strauss | 6,176 | 1.98% | +1.98 | |
| Independent | Daniel Clark | 1,839 | 0.59% | +0.59 | |
| Write-ins | 171 | 0.05% | -0.05 | ||
| Majority | 38,069 | 12.2% | |||
| Turnout | 312,357 | 100% | |||
| Democratic hold | Swing | +4.7 | |||
Historical district boundaries

Iowa's 2nd congressional district boundaries from 2003 to 2013
References
- Center for New Media & Promotion (CNMP), US Census Bureau. "My Congressional District". www.census.gov.
- "Census profile: Congressional District 2, IA". Census Reporter.
- "Partisan Voting Index – Districts of the 115th Congress" (PDF). The Cook Political Report. April 7, 2017. Retrieved April 7, 2017.
- "2001 Iowa Redistricting Plan". 2001. Archived from the original on October 16, 2006. Retrieved November 10, 2006.
- "Iowa General Election 2018". Iowa Secretary of State. Retrieved November 11, 2018.
- Martis, Kenneth C. (1989). The Historical Atlas of Political Parties in the United States Congress. New York: Macmillan Publishing Company.
- Martis, Kenneth C. (1982). The Historical Atlas of United States Congressional Districts. New York: Macmillan Publishing Company.
- Congressional Biographical Directory of the United States 1774–present
This article is issued from Wikipedia. The text is licensed under Creative Commons - Attribution - Sharealike. Additional terms may apply for the media files.