Humber—St. Barbe—Baie Verte
Humber—St. Barbe—Baie Verte was a federal electoral district in Newfoundland and Labrador, Canada, that was represented in the House of Commons of Canada from 1988 to 2015.
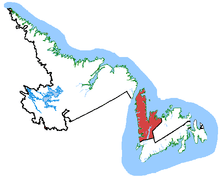 Humber—St. Barbe—Baie Verte in relation to other Newfoundland and Labrador ridings | |
| Defunct federal electoral district | |
| Legislature | House of Commons |
| District created | 1987 |
| District abolished | 2013 |
| First contested | 1988 |
| Last contested | 2011 |
| District webpage | profile, map |
| Demographics | |
| Population (2011)[1] | 71,563 |
| Electors (2011) | 59,797 |
| Area (km²)[2] | 31,075.06 |
| Census divisions | Division No. 5, Division No. 6, Division No. 8, Division No. 9 |
| Census subdivisions | Corner Brook, Deer Lake, Pasadena, Springdale, St. Anthony |
Demographics
Ethnic groups: 96.2% White, 3.4% Native Canadian
Languages: 99.3% English
Religions: 73.8% Protestant, 23.2% Catholic, 2.1% No affiliation
Average income: $20 573
Humber—St. Barbe—Baie Verte is the riding with the highest percentage of people with English ethnic origin in all of Canada (46.8% - multiple responses).[3]
Geography
The district included the Great Northern Peninsula, the Baie Verte Peninsula, the area along the southwest coast of Notre Dame Bay, the Bay of Islands, and the Corner Brook area. It also included most of Glover Island, the Grey Islands (Groais Island and Bell Island), and the Horse Islands.
The neighbouring ridings were Labrador, Bonavista—Gander—Grand Falls—Windsor, and Random—Burin—St. George's.
According to Elections Canada, the geographic boundaries for the 39th General Election (2006) were:
- "All that area consisting of that part of the Island of Newfoundland lying westerly and northerly of a line described as follows: commencing at a point midway between the towns of Triton and Leading Tickles in Notre Dame Bay; thence southerly in said bay to Seal Bay; thence southerly in a straight line to Frozen Ocean Lake at approximate latitude 49°11'N and approximate longitude 55°41'W; thence westerly in a straight line to Hinds Lake; thence southerly in a straight line to the mouth of Lloyds River at the westernmost extremity of Red Indian Lake; thence westerly in a straight line to Georges Lake; thence westerly in a straight line to Bluff Head on the eastern shoreline of Port au Port Bay. Including St. John Island, Quirpon Island, Sop's Island, Bell Island and Groais Island of the Grey Islands, Horse Islands and all other islands adjacent to the shoreline of the above-described area."
History
The electoral district was created in 1987 from Grand Falls—White Bay—Labrador and Humber—Port au Port—St. Barbe. Following the 2012 federal electoral redistribution, this riding was dissolved and divided between Long Range Mountains (80%) and Coast of Bays—Central—Notre Dame (20%), with the new boundaries taking effect at the 2015 federal election.
Members of Parliament
This riding has elected the following Members of Parliament:
| Parliament | Years | Member | Party | |
|---|---|---|---|---|
| Humber—St. Barbe—Baie Verte Riding created from Grand Falls—White Bay—Labrador and Humber—Port au Port—St. Barbe |
||||
| 34th | 1988–1993 | Brian Tobin | Liberal | |
| 35th | 1993–1996 | |||
| 1996–1997 | Gerry Byrne | Liberal | ||
| 36th | 1997–2000 | |||
| 37th | 2000–2004 | |||
| 38th | 2004–2006 | |||
| 39th | 2006–2008 | |||
| 40th | 2008–2011 | |||
| 41st | 2011–2015 | |||
| Riding dissolved into Long Range Mountains and Coast of Bays—Central—Notre Dame |
||||
Election results
Humber—St. Barbe—Baie Verte, 2003 Representation Order
| 2011 Canadian federal election | ||||||||
|---|---|---|---|---|---|---|---|---|
| Party | Candidate | Votes | % | ±% | Expenditures | |||
| Liberal | Gerry Byrne | 17,119 | 57.04 | -10.88 | $40,692.36 | |||
| Conservative | Trevor Taylor | 7,559 | 25.18 | +14.56 | $34,234.84 | |||
| New Democratic | Shelley Senior | 4,751 | 15.83 | -1.97 | $6,860.99 | |||
| Independent | Wayne Ronald Bennett | 332 | 1.11 | -2.55 | $2,100.81 | |||
| Green | Robin Gosse | 253 | 0.84 | – | $0.00 | |||
| Total valid votes/Expense limit | 30,014 | 100.0 | – | $93,645.93 | ||||
| Total rejected, unmarked and declined ballots | 97 | 0.32 | -0.25 | |||||
| Turnout | 30,111 | 50.94 | +6.67 | |||||
| Eligible voters | 59,109 | |||||||
| Liberal hold | Swing | -12.72 | ||||||
| Change for Independent candidate Wayne Roland Bennett is based on results from Newfoundland and Labrador First. | ||||||||
| Sources:[4][5] | ||||||||
| 2008 Canadian federal election | ||||||||
|---|---|---|---|---|---|---|---|---|
| Party | Candidate | Votes | % | ±% | Expenditures | |||
| Liberal | Gerry Byrne | 17,943 | 67.92 | +15.02 | $40,633.78 | |||
| New Democratic | Mark Kennedy | 4,703 | 17.80 | +2.90 | $2,377.46 | |||
| Conservative | Lorne Robinson | 2,806 | 10.62 | -20.54 | $11,451.29 | |||
| Newfoundland and Labrador First | Wayne Ronald Bennett | 967 | 3.66 | – | $14,072.95 | |||
| Total valid votes/Expense limit | 26,419 | 100.0 | – | $90,812 | ||||
| Total rejected, unmarked and declined ballots | 150 | 0.57 | -0.01 | |||||
| Turnout | 26,472 | 44.27 | -10.55 | |||||
| Eligible voters | 59,797 | |||||||
| Liberal hold | Swing | +6.06 | ||||||
| 2006 Canadian federal election | ||||||||
|---|---|---|---|---|---|---|---|---|
| Party | Candidate | Votes | % | ±% | Expenditures | |||
| Liberal | Gerry Byrne | 17,208 | 52.90 | -9.66 | $51,137.92 | |||
| Conservative | Cyril Pelley, Jr. | 10,137 | 31.16 | +8.21 | $40,695.65 | |||
| New Democratic | Holly Pike | 4,847 | 14.90 | +1.76 | $6,539.20 | |||
| Green | Martin Hanzalek | 339 | 1.04 | -0.31 | none listed | |||
| Total valid votes/Expense limit | 32,531 | 100.0 | – | $84,468 | ||||
| Total rejected, unmarked and declined ballots | 191 | 0.58 | +0.13 | |||||
| Turnout | 32,722 | 54.82 | +7.05 | |||||
| Eligible voters | 59,685 | |||||||
| Liberal hold | Swing | -8.94 | ||||||
| 2004 Canadian federal election | ||||||||
|---|---|---|---|---|---|---|---|---|
| Party | Candidate | Votes | % | ±% | Expenditures | |||
| Liberal | Gerry Byrne | 17,820 | 62.56 | +14.14 | $60,642.45 | |||
| Conservative | Wynanne Downer | 6,538 | 22.95 | -4.13 | $49,487.66 | |||
| New Democratic | Holly Pike | 3,743 | 13.14 | -11.36 | $5,864.44 | |||
| Green | Steve Durant | 384 | 1.35 | – | $177.50 | |||
| Total valid votes/Expense limit | 28,485 | 100.0 | – | $82,511 | ||||
| Total rejected, unmarked and declined ballots | 128 | 0.45 | ||||||
| Turnout | 28,613 | 47.77 | ||||||
| Eligible voters | 59,893 | |||||||
| Liberal notional hold | Swing | +9.14 | ||||||
| Changes from 2000 are based on redistributed results. Change for the Conservatives is based on the combined total of the Progressive Conservatives and the Canadian Alliance. | ||||||||
| 2000 federal election redistributed results | |||
|---|---|---|---|
| Party | Vote | % | |
| Liberal | 16,814 | 48.42 | |
| New Democratic | 8,509 | 24.50 | |
| Progressive Conservative | 7,404 | 21.32 | |
| Alliance | 1,999 | 5.76 | |
Previous elections
| 2000 Canadian federal election | ||||||||
|---|---|---|---|---|---|---|---|---|
| Party | Candidate | Votes | % | ±% | ||||
| Liberal | Gerry Byrne | 15,446 | 48.79 | +8.95 | ||||
| New Democratic | Trevor Taylor | 8,173 | 25.82 | +11.22 | ||||
| Progressive Conservative | Peter McBreairty | 6,340 | 20.03 | -19.03 | ||||
| Alliance | Murdock Cole | 1,698 | 5.33 | -1.17 | ||||
| Total votes | 31,657 | 100.00 | ||||||
| Total rejected ballots | 117 | 0.37 | ||||||
| Turnout | 31,774 | 57.99 | ||||||
Canadian Alliance changes from 1997 are based on the results of its predecessor, the Reform Party.
| 1997 Canadian federal election | ||||||||
|---|---|---|---|---|---|---|---|---|
| Party | Candidate | Votes | % | ±% | ||||
| Liberal | Gerry Byrne | 12,057 | 39.84 | -15.85 | ||||
| Progressive Conservative | Art Bull | 11,825 | 39.06 | +15.56 | ||||
| New Democratic | Joan Scott | 4,421 | 14.60 | +12.13 | ||||
| Reform | Randy Wells | 1,969 | 6.50 | -11.84 | ||||
| Total votes | 30,272 | 100.00 | ||||||
| Total rejected ballots | 129 | 0.42 | ||||||
| Turnout | 30,401 | 54.93 | ||||||
| Canadian federal by-election, 25 March 1996 | ||||||||
|---|---|---|---|---|---|---|---|---|
| Party | Candidate | Votes | % | ±% | ||||
| On the resignation of Brian Tobin, 25 January 1996 | ||||||||
| Liberal | Gerry Byrne | 12,453 | 55.69 | -26.49 | ||||
| Progressive Conservative | Danny Kane | 5,253 | 23.50 | +8.12 | ||||
| Reform | Deon Hancock | 4,099 | 18.34 | |||||
| New Democratic | Coleen Dingwell-Corbin | 554 | 2.47 | +0.03 | ||||
| Total votes | 22,359 | 100.00 | ||||||
| 1993 Canadian federal election | ||||||||
|---|---|---|---|---|---|---|---|---|
| Party | Candidate | Votes | % | ±% | ||||
| Liberal | Brian Tobin | 25,920 | 82.18 | +15.15 | ||||
| Progressive Conservative | Margaret Ann O'Rourke | 4,852 | 15.38 | -13.91 | ||||
| New Democratic | Linda Soper | 770 | 2.44 | -1.24 | ||||
| Total votes | 31,542 | 100.00 | ||||||
| 1988 Canadian federal election | ||||||||
|---|---|---|---|---|---|---|---|---|
| Party | Candidate | Votes | % | |||||
| Liberal | Brian Tobin | 26,259 | 67.03 | |||||
| Progressive Conservative | Terry Young | 11,477 | 29.29 | |||||
| New Democratic | Marie Newhook | 1,441 | 3.68 | |||||
| Total votes | 39,177 | 100.00 | ||||||
See also
- List of Canadian federal electoral districts
- Past Canadian electoral districts
References
- "(Code 10003) Census Profile". 2011 census. Statistics Canada. 2012. Retrieved 2011-03-03.
Notes
- Statistics Canada: 2012
- Statistics Canada: 2012
- "2Profile of Ethnic Origin and Visible Minorities for Canada, Provinces, Territories and Federal Electoral Districts (2003 Representation Order), 2006 Census". 2.statcan.gc.ca. Retrieved 2012-12-02.
- Elections Canada – Official voting results, Forty-first general election, 2011
- Elections Canada – Candidate's electoral campaign return, 41st general election