Malpeque (electoral district)
Malpeque is a federal electoral district in Prince Edward Island, Canada, that has been represented in the House of Commons of Canada since 1968. Its population in 2011 was 35,039.
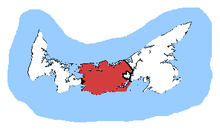 Malpeque in relation to the other Prince Edward Island ridings | |||
| Coordinates: | 46.345°N 63.383°W | ||
| Federal electoral district | |||
| Legislature | House of Commons | ||
| MP |
Liberal | ||
| District created | 1966 | ||
| First contested | 1968 | ||
| Last contested | 2019 | ||
| District webpage | profile, map | ||
| Demographics | |||
| Population (2019)[1] | 36,030 | ||
| Electors (2019) | 30,275 | ||
| Area (km²)[1] | 1,663 | ||
| Pop. density (per km²) | 21.7 | ||
| Census divisions | Prince, Queens | ||
| Census subdivisions | Towns: Borden-Carleton Cornwall Kensington Villages: Bedeque, Brackley, Breadalbane, Central Bedeque, Clyde River, Crapaud, DeSable, Hunter River, Kinkora, Meadowbank, Miltonvale Park, Stanley Bridge, Hope River, Bayview, Cavendish and North Rustico, Union Road, Victoria, Warren Grove, Winsloe Park First Nations reserves: Rocky Point 3 Lots: Lot 18, 19, 20, 21, 22, 23, 24, 25, 26, 27, 28, 29, 30, 31, 33, 34, 65, 67 | ||
Demographics
- Ethnic groups: 98.8% White
- Languages: 95.7% English, 2.5% French, 1.4% Other
- Religions: 53.2% Protestant, 36.4% Catholic, 2.9% Other Christian, 7.3% no affiliation
- Average income: $24,005
- According to the Canada 2016 Census
- Most common mother tongue languages (2016) : 95.5% English, 2.0% French, 0.6% Dutch, 0.3% German, 0.3% Mandarin, 0.2% Spanish, 0.2% Tagalog[2]
Geography
The district includes the extreme eastern part of Prince County and most of Queens County except the extreme eastern portion and the City of Charlottetown. Communities include Cornwall, Kensington, Miltonvale Park, Borden-Carleton, North Rustico and Clyde River. The area is 1,663 km2.
History
The electoral district was created in 1966 from parts of Prince and Queen's ridings. There will be no boundary changes as a result of the 2012 federal electoral redistribution.
Members of Parliament
This riding has elected the following Members of Parliament:
| Parliament | Years | Member | Party | |
|---|---|---|---|---|
| Malpeque Riding created from Prince and Queen's |
||||
| 28th | 1968–1972 | Angus MacLean | Progressive Conservative | |
| 29th | 1972–1974 | |||
| 30th | 1974–1976 | |||
| 1977–1979 | Donald Wood | Liberal | ||
| 31st | 1979–1980 | Melbourne Gass | Progressive Conservative | |
| 32nd | 1980–1984 | |||
| 33rd | 1984–1988 | |||
| 34th | 1988–1993 | Catherine Callbeck | Liberal | |
| 35th | 1993–1997 | Wayne Easter | ||
| 36th | 1997–2000 | |||
| 37th | 2000–2004 | |||
| 38th | 2004–2006 | |||
| 39th | 2006–2008 | |||
| 40th | 2008–2011 | |||
| 41st | 2011–2015 | |||
| 42nd | 2015–2019 | |||
| 43rd | 2019–present | |||
Election results
2019 general election
| 2019 Canadian federal election | ||||||||
|---|---|---|---|---|---|---|---|---|
| Party | Candidate | Votes | % | ±% | Expenditures | |||
| Liberal | Wayne Easter | 9,533 | 41.38 | −20.70 | $52,375.96 | |||
| Green | Anna Keenan | 6,103 | 26.49 | +17.30 | ||||
| Conservative | Stephen Stewart | 5,908 | 25.64 | +8.08 | ||||
| New Democratic | Craig Nash | 1,495 | 6.49 | −4.68 | ||||
| Total valid votes/Expense limit | 23,039 | 100.0 | $86,221.22 | |||||
| Total rejected ballots | 288 | 1.23 | +0.78 | |||||
| Turnout | 23,327 | 77.05 | −1.80 | |||||
| Eligible voters | 30,275 | |||||||
| Liberal hold | Swing | −19.00 | ||||||
| Source: Elections Canada[3] | ||||||||
2015 general election
| 2015 Canadian federal election | ||||||||
|---|---|---|---|---|---|---|---|---|
| Party | Candidate | Votes | % | ±% | Expenditures | |||
| Liberal | Wayne Easter | 13,950 | 62.08 | +19.68 | $84,420.76 | |||
| Conservative | Stephen Stewart | 3,947 | 17.56 | –21.54 | $40,127.00 | |||
| New Democratic | Leah-Jane Hayward | 2,509 | 11.17 | –3.46 | $6,264.15 | |||
| Green | Lynne Lund | 2,066 | 9.19 | +5.32 | $12,265.59 | |||
| Total valid votes/Expense limit | 22,472 | 99.55 | $170,512.40 | |||||
| Total rejected ballots | 102 | 0.45 | +0.01 | |||||
| Turnout | 22,574 | 79.05 | +1.58 | |||||
| Eligible voters | 28,556 | |||||||
| Liberal hold | Swing | +20.61 | ||||||
| Source: Elections Canada[4][5] | ||||||||
2011 general election
| 2011 Canadian federal election | ||||||||
|---|---|---|---|---|---|---|---|---|
| Party | Candidate | Votes | % | ±% | Expenditures | |||
| Liberal | Wayne Easter | 8,605 | 42.40 | -1.79 | $47,363.15 | |||
| Conservative | Tim Ogilvie | 7,934 | 39.10 | -0.18 | $62.426.68 | |||
| New Democratic | Rita Jackson | 2,970 | 14.63 | +4.96 | $5,426.11 | |||
| Green | Peter Bevan-Baker | 785 | 3.87 | -2.99 | $1,367.33 | |||
| Total valid votes/Expense limit | 20,294 | 100.0 | $69,634.73 | |||||
| Total rejected, unmarked and declined ballots | 90 | 0.44 | -0.16 | |||||
| Turnout | 20,384 | 77.47 | +6.06 | |||||
| Eligible voters | 26,311 | |||||||
| Liberal hold | Swing | -0.80 | ||||||
| Sources:[6][7] | ||||||||
2008 general election
| 2008 Canadian federal election | ||||||||
|---|---|---|---|---|---|---|---|---|
| Party | Candidate | Votes | % | ±% | Expenditures | |||
| Liberal | Wayne Easter | 8,312 | 44.19 | -6.29 | $51,835.54 | |||
| Conservative | Mary Crane | 7,388 | 39.28 | +4.65 | $56,705.00 | |||
| New Democratic | J'Nan Brown | 1,819 | 9.67 | -0.57 | $5,225.01 | |||
| Green | Peter Bevan-Baker | 1,291 | 6.86 | +2.21 | $3,626.22 | |||
| Total valid votes/Expense limit | 18,810 | 100.0 | $67,177 | |||||
| Total rejected, unmarked and declined ballots | 113 | 0.60 | +0.01 | |||||
| Turnout | 18,923 | 71.41 | -3.69 | |||||
| Eligible voters | 26,498 | |||||||
| Liberal hold | Swing | -5.47 | ||||||
2006 general election
| 2006 Canadian federal election | ||||||||
|---|---|---|---|---|---|---|---|---|
| Party | Candidate | Votes | % | ±% | Expenditures | |||
| Liberal | Wayne Easter | 9,779 | 50.48 | -1.42 | $51,121.23 | |||
| Conservative | George Noble | 6,708 | 34.63 | +2.13 | $52,989.45 | |||
| New Democratic | George Marshall | 1,983 | 10.24 | +0.15 | $3,388.31 | |||
| Green | Sharon Labchuk | 901 | 4.65 | -0.85 | $2,925.11 | |||
| Total valid votes/Expense limit | 19,371 | 100.0 | $62,210 | |||||
| Total rejected, unmarked and declined ballots | 114 | 0.59 | -0.17 | |||||
| Turnout | 19,485 | 75.10 | +2.09 | |||||
| Eligible voters | 25,945 | |||||||
| Liberal hold | Swing | -1.78 | ||||||
2004 general election
| 2004 Canadian federal election | ||||||||
|---|---|---|---|---|---|---|---|---|
| Party | Candidate | Votes | % | ±% | Expenditures | |||
| Liberal | Wayne Easter | 9,782 | 51.90 | +3.28 | $49,256.92 | |||
| Conservative | Mary Crane | 6,126 | 32.50 | -13.28 | $52,127.38 | |||
| New Democratic | Ken Bingham | 1,902 | 10.09 | +5.86 | $3,055.96 | |||
| Green | Sharon Labchuk | 1,037 | 5.50 | +4.15 | $2,989.44 | |||
| Total valid votes/Expense limit | 18,847 | 100.0 | $60,645 | |||||
| Total rejected, unmarked and declined ballots | 144 | 0.76 | ||||||
| Turnout | 18,991 | 73.01 | ||||||
| Eligible voters | 26,010 | |||||||
| Liberal hold | Swing | +8.28 | ||||||
| Change for the Conservatives is from the combined totals of the Progressive Conservatives and the Canadian Alliance. | ||||||||
2000 general election
| 2000 Canadian federal election | ||||||||
|---|---|---|---|---|---|---|---|---|
| Party | Candidate | Votes | % | ±% | ||||
| Liberal | Wayne Easter | 8,972 | 48.62 | +3.53 | ||||
| Progressive Conservative | Jim Gorman | 7,186 | 38.94 | -2.05 | ||||
| Alliance | Chris Wall | 1,263 | 6.84 | +3.53 | ||||
| New Democratic | Ken Bingham | 781 | 4.23 | -6.39 | ||||
| Green | Jeremy Stiles | 250 | 1.35 | |||||
| Total valid votes | 18,452 | 100.00 | ||||||
| Changes for the Canadian Alliance from 1997 are based on the results of its predecessor, the Reform Party. | ||||||||
1997 general election
| 1997 Canadian federal election | ||||||||
|---|---|---|---|---|---|---|---|---|
| Party | Candidate | Votes | % | ±% | ||||
| Liberal | Wayne Easter | 7,912 | 45.09 | -16.03 | ||||
| Progressive Conservative | Jimmie Gorman | 7,194 | 40.99 | +9.80 | ||||
| New Democratic | Andrew Wells | 1,863 | 10.62 | +6.21 | ||||
| Reform | Stephen Livingstone | 580 | 3.31 | |||||
| Total valid votes | 17,549 | 100.00 | ||||||
1993 general election
| 1993 Canadian federal election | ||||||||
|---|---|---|---|---|---|---|---|---|
| Party | Candidate | Votes | % | ±% | ||||
| Liberal | Wayne Easter | 10,579 | 61.12 | +9.22 | ||||
| Progressive Conservative | Garth E. Staples | 5,399 | 31.19 | -8.98 | ||||
| New Democratic | Karen Fyfe | 763 | 4.41 | -3.52 | ||||
| Christian Heritage | John Freddie Gunn | 318 | 1.84 | |||||
| Green | Jeremy Stiles | 249 | 1.44 | |||||
| Total valid votes | 17,308 | 100.00 | ||||||
1988 general election
| 1988 Canadian federal election | ||||||||
|---|---|---|---|---|---|---|---|---|
| Party | Candidate | Votes | % | ±% | ||||
| Liberal | Catherine Callbeck | 9,381 | 51.90 | +18.94 | ||||
| Progressive Conservative | Gordon Lank | 7,260 | 40.17 | -16.18 | ||||
| New Democratic | Judy Whitaker | 1,434 | 7.93 | -2.76 | ||||
| Total valid votes | 18,075 | 100.00 | ||||||
1984 general election
| 1984 Canadian federal election | ||||||||
|---|---|---|---|---|---|---|---|---|
| Party | Candidate | Votes | % | ±% | ||||
| Progressive Conservative | Melbourne Gass | 10,577 | 56.35 | +6.21 | ||||
| Liberal | Paul H. Schurman | 6,186 | 32.96 | -9.71 | ||||
| New Democratic | Janet Norgrove | 2,006 | 10.69 | +3.50 | ||||
| Total valid votes | 18,769 | 100.00 | ||||||
1980 general election
| 1980 Canadian federal election | ||||||||
|---|---|---|---|---|---|---|---|---|
| Party | Candidate | Votes | % | ±% | ||||
| Progressive Conservative | Melbourne Gass | 8,486 | 50.14 | -2.56 | ||||
| Liberal | David S. Peppin | 7,221 | 42.67 | +2.17 | ||||
| New Democratic | Vic Arsenault | 1,216 | 7.19 | +0.39 | ||||
| Total valid votes | 16,923 | 100.00 | ||||||
1979 general election
| 1979 Canadian federal election | ||||||||
|---|---|---|---|---|---|---|---|---|
| Party | Candidate | Votes | % | ±% | ||||
| Progressive Conservative | Melbourne Gass | 8,729 | 52.70 | +5.63 | ||||
| Liberal | Don Wood | 6,707 | 40.50 | -7.87 | ||||
| New Democratic | Charlie Sark | 1,126 | 6.80 | +2.72 | ||||
| Total valid votes | 16,562 | 100.00 | ||||||
1977 by-election
| Canadian federal by-election, 24 May 1977 On the resignation of Angus MacLean, 20 October 1976 | ||||||||
|---|---|---|---|---|---|---|---|---|
| Party | Candidate | Votes | % | ±% | ||||
| Liberal | Donald Wood | 4,657 | 48.37 | +3.80 | ||||
| Progressive Conservative | Ian MacQuarrie | 4,532 | 47.07 | -3.54 | ||||
| New Democratic | Charles H. Sark | 393 | 4.08 | -0.73 | ||||
| Independent | A. Neil Harpham | 46 | 0.48 | |||||
| Total valid votes | 9,628 | 100.00 | ||||||
1974 general election
| 1974 Canadian federal election | ||||||||
|---|---|---|---|---|---|---|---|---|
| Party | Candidate | Votes | % | ±% | ||||
| Progressive Conservative | Angus MacLean | 5,649 | 50.61 | -2.92 | ||||
| Liberal | John W. MacNaught | 4,975 | 44.57 | +2.62 | ||||
| New Democratic | Doreen Sark | 537 | 4.81 | +0.29 | ||||
| Total valid votes | 11,161 | 100.00 | ||||||
1972 general election
| 1972 Canadian federal election | ||||||||
|---|---|---|---|---|---|---|---|---|
| Party | Candidate | Votes | % | ±% | ||||
| Progressive Conservative | Angus MacLean | 5,835 | 53.53 | +3.53 | ||||
| Liberal | Sinclair Cutcliffe | 4,573 | 41.95 | -5.97 | ||||
| New Democratic | Maurice J. Darte | 493 | 4.52 | +2.43 | ||||
| Total valid votes | 10,901 | 100.00 | ||||||
1968 general election
| 1968 Canadian federal election | ||||||||
|---|---|---|---|---|---|---|---|---|
| Party | Candidate | Votes | % | |||||
| Progressive Conservative | Angus MacLean | 5,049 | 50.00 | |||||
| Liberal | Don Wood | 4,839 | 47.92 | |||||
| New Democratic | Douglas H. MacFarlane | 211 | 2.09 | |||||
| Total valid votes | 10,099 | 100.00 | ||||||
Student Vote results
2011 election
In 2011, a Student Vote was conducted at participating Canadian schools to parallel the 2011 Canadian federal election results. The vote was designed to educate students and simulate the electoral process for persons who have not yet reached the legal majority. Schools with a large student body that reside in another electoral district had the option to vote for candidates outside of the electoral district then where they were physically located.[8]
| 2011 Canadian federal election | ||||||||
|---|---|---|---|---|---|---|---|---|
| Party | Candidate | Votes | % | |||||
| Liberal | Wayne Easter | 318 | 34.79 | |||||
| New Democratic | Rita Jackson | 255 | 27.90 | |||||
| Conservative | Tim Ogilvie | 191 | 20.90 | |||||
| Green | Peter Bevan-Baker | 180 | 19.69 | |||||
| Total valid votes | 914 | 100.00 | ||||||
References
- "(Code 11004) Census Profile". 2011 census. Statistics Canada. 2012. Retrieved 3 March 2011.
Notes
- Statistics Canada: 2012
- https://www12.statcan.gc.ca/census-recensement/2016/dp-pd/dt-td/Rp-eng.cfm?LANG=E&APATH=3&DETAIL=0&DIM=0&FL=A&FREE=0&GC=0&GID=0&GK=0&GRP=1&PID=109979&PRID=10&PTYPE=109445&S=0&SHOWALL=0&SUB=888&Temporal=2016,2017&THEME=118&VID=0&VNAMEE=&VNAMEF=
- "Results Validated by the Returning Officer". Elections Canada. Retrieved 25 October 2019.
- "October 19, 2015 Election Results — Malpeque (Validated results)". Elections Canada. 20 October 2015. Retrieved 24 October 2015.
- Elections Canada – Preliminary Election Expenses Limits for Candidates Archived 4 March 2016 at the Wayback Machine
- Elections Canada – Official voting results, Forty-first general election, 2011
- Elections Canada – Candidate's electoral campaign return, 41st general election
- "School by School results". Student Vote Canada. Retrieved 12 June 2013.